A Comparison of Selected Parametric and Non-Parametric Statistical Approaches for Candidate Genes Selection in Transcriptome Data
Gene expression data analysis are usually high-dimensional (there are many genes collected from few individuals). Classical statistical methods don’t work well for high-dimensional data. In this paper, we rigorously compare three gene selection methods, namely the two sample t-test, Wilcoxon Mann-Whitney (WMW) on Atopic Dermatitis data. We create the third gene selection method which is the combination of the two methods. This method chooses the top common genes selected from both methods. These feature selection methods are compared on four discriminant functions: Support Vector Machine (SVM), Linear Discriminant Analysis (LDA), Naive Bayes Discriminant function (NB) and K-Nearest Neighbor (KNN). We show that we can achieve 100% accuracy rate for testing data using very small number of genes.
Keywords: Atopic Dermatitis (AD); Gene Selection; K-Nearest Neighbor (KNN); Linear Discriminant Analysis (LDA); Naive Bayes Discriminant Functions (NB); Support Vector Machines (SVM); Two-sample T-test; Wilcoxon Mann-Whitney (WMW)
The gene expression data are usually high-dimensional which means that the sample size n is smaller than the dimension p which can make some classifiers not applicable. When the feature space dimension p is very high compared to the sample size n, most of the discriminant rules perform poorly. A procedure using all the features can be as poor as random guessing due to noise accumulation in estimating population centroids in high-dimensional feature space [1]. As a result feature selection is important in high-dimensional classification.
We know that only few genes carry the useful information which can determine a specific genetic trait, such as susceptibility to a disease while most of genes carry nothing useful but the noises. If we take all the genes instead of the most informative ones for classification can’t provide a better accuracy but result in the widely inefficiency. Usually, a smaller set of genes are selected based the amount of information in terms of the group separation to be considered as the most important genes in the process of classification.
Dudoit, et al. performed gene screening based on the ratio of between-group and within-group sums of squares. Many statisticians applied two-sample t-statistic which measures the distance between two populations and can be used as the criterion to preliminarily select the most important genes while other people picked up the variables based on Wilcoxon-Mann-Whitney (WMW) statistic which is also good measurement in terms of group separation [1-5].
Fan and Fan gave a condition under which the two-sample t-test picks up all the important features with probability 1. Asheber Abebe and Shuxin Yin (PhD dissertation, 2010 gave a condition under which the Wilcoxon-Mann Whitney test can pick up all the important features with probability 1 [1,6].
Most of the current researches compare how single gene selection methods affect discriminant functions [1,7,8]. In this paper we fill the gap by considering three feature selection methods: two-sample t-test and Wilcoxon Mann-Whitney with the common of the two as a separate gene selection method and studying how these different gene selection methods affect the four selected discriminant functions: Linear Discriminant Analysis (LDA), or sometimes called Fisher Discriminant Function (Fisher), Naive Bayes Discriminant Function (NB), Support Vector Machines (SVM) and K-Nearest Neighbor (KNN). The first two discriminant functions are parametric and the last two are non-parametric.
The rest of this paper is presented as follows: section 2 introduces our methods, section 3 is about the data set we use in the paper, section 4 presents the results with discussion, section 5 is the conclusion, and section 6 is the limitations to this paper. We conclude the paper by listing our references.
We use the parametric two-sample t-test and the non-parametric Wilcoxon Mann-Whitney tests for gene selection. We compare these two gene selection methods on four discriminant functions: Linear Discriminant Analysis (LDA), Naive Bayes Discriminant Function (NB), K-Nearest Neighbor (KNN) and Support Vector Machine (SVM). We created the third gene selection method from combining the common genes selected by each of the two gene selection methods. Through this paper, testing accuracy rates, accuracy rates on the testing data, are reported. Accuracy rate is defined as the proportion of genes which are correctly classified by our classifiers.
The parametric two sample t-test is used to test the hypothesis that the means of two groups are the same. The test assumes that each gene is normally distributed in the two groups. When this assumption is not hold, the non-parametric Wilcoxon-Mann-Whitney (or rank sum) test is an alternative. The Wilcoxon-Mann-Whitney test consists of taking all the observations from the two groups and ranking them in order of size. The ranks of the observations are summed from either group to form a test statistic. We believe that the two methods select different sets of genes. We also believe that the common genes selected by both methods will be useful sets to be studied separately as they are chosen by the both methods.
The goal of the LDA technique is to project the original data matrix onto a lower dimensional space. To achieve this goal, three steps needed to be performed. The first step is to calculate the separability between different classes (i.e. the distance between the means of different classes), which is called the between-class variance or between-class matrix. The second step is to calculate the distance between the mean and the samples of each class, which is called the within-class variance or within-class matrix. The third step is to construct the lower dimensional space which maximizes the between-class variance and minimizes the within-class variance.
NB function works similar to LDA except that NB assumes the variables are independent within class.
KNN is a simple algorithm that stores all available cases and classifies new cases based on a similarity measure (e.g., distance functions). KNN is used for classification as follows; we are given some data points for training and also a new unlabelled data for testing. Our aim is to find the class label for the new point. The algorithm has different behavior based on k. We used k=1 in this paper. This is the simplest scenario. Let x be the point to be labeled. Find the point closest to x. Let it be y. Now nearest neighbor rule assigns the label of y to x.
Support vector machines (SVMs, also support vector networks) are supervised learning models with associated learning algorithms that analyze data and recognize patterns, used for classification and regression analysis. Given a set of training examples, each marked as belonging to one of two categories, an SVM training algorithm builds a model that assigns new examples into one category or the other, making it a non-probabilistic binary linear classifier. An SVM model is a representation of the examples as points in space, mapped so that the examples of the separate categories are divided by a clear gap that is as wide as possible. New examples are then mapped into that same space and predicted to belong to a category based on which side of the gap they fall on.
For linear separable case, let us define two hyperplanes H1 and H2:
H1: xi .w+b≥+1 when yi=+1 (class C1) H2: xi .w+b≤-1 when yi=-1 (class C0)
The points on the planes H1 and H2 are called Support Vectors. We want a classifier with as big margin as possible. Margin is defined as the smallest perpendicular distance from points in the data set to the hyperplane. The distance between H1 and H2 is 2/||w||. In order to maximize the margin, we need to minimize ||w|| with condition that there are no data points between H1 and H2. This is a constrained optimization problem solved by Lagrangian multiplier method.
In addition to performing linear classification, SVMs can efficiently perform a non-linear classification using what is called the kernel trick, implicitly mapping their inputs into high-dimensional feature spaces so that they can be separable linearly. In this paper we used SVM with radial kernel.
Atopic dermatitis is a skin disease characterized by areas of severe itching, redness, scaling, and loss of the surface of the skin. Atopic dermatitis is the most common of the many types of eczema. Atopic dermatitis is frequently associated with other allergic disorders, especially asthma and hay fever. We analyze the two high-dimensional Atopic Dermatitis (AD) data sets available (GEO IDs: GSE36842, GSE16161). The data set can be found at https://www.ncbi.nlm.nih.gov/geo/. The first is used for training and the second for testing. There are 24 AD cases and 15 normal individuals in the training data. The testing data has 9 AD cases and 9 normal. There are genes in each of the training and testing data.
Gene selection is an important part of high-dimensional data analysis. We divide the two data sets as follows: one for training or model building and gene selection and one data set for testing. We choose the top few genes selected from the training data using both methods. We then compare how the three discriminant functions perform on classifying the testing data based on the above selected genes. We use R programming software (R Studio, 2018) to analyze these data sets.
Two- sample t-test and Wilcoxon Mann-Whitney tests are applied on the training data. We rank the absolute values of the t-test statistics and the Wilcoxon Mann-Whitney statistics from largest to smallest. The gene which has the largest test statistic is ranked as first for each method and we continue this way until all the 54,675 genes are ranked.
The following are the top 10 genes selected based on the two- sample t-test and Wilcoxon Mann-Whitney respectively with 4 genes selected as common for both methods: “C5orf28”, “MALAT1”, “LPHN1”, “IDE”, “FAM160B2”, “MBD3”, “TNS4”, “ZNF720”, “SERPINA12” and “C5orf28”, “MBD3”, “LPHN1”, “RICTOR”, “ACTN4”, “SMARCC2”, “LTB4R”, “TNS4” , “C15orf44”. One gene from each of the two methods has no gene names listed in our data.
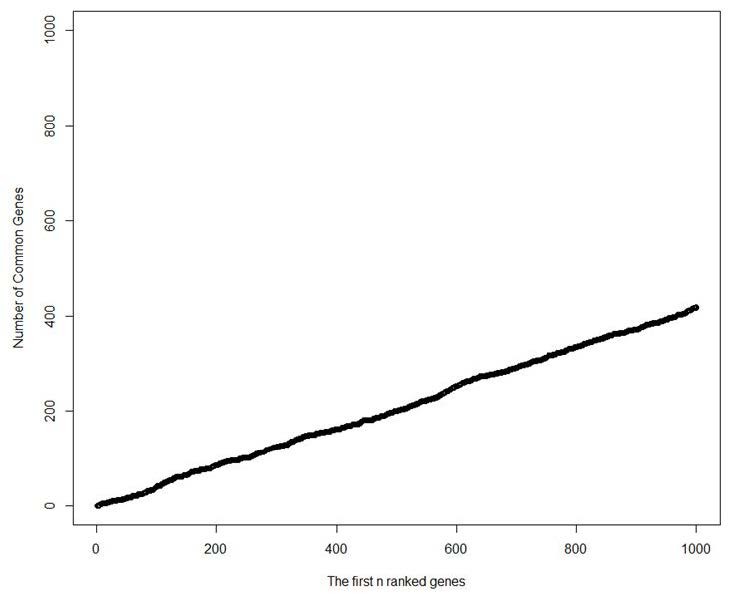
We study the inter-rater agreement for the genes selected by t-test and Wilcoxon Mann-Whitney. Since we believe that only the first few genes are important, we calculate the Cohen’s kappa on the indexes of the first 1000 genes selected by each method. This result shows that t-test and Wilcoxon Mann-Whitney chooses the genes in much different order. The Cohen estimate is -0.01851, which is very low.
But from the top 100 genes selected using both methods, the number of common genes is 37 with one gene name not found in our data. The following are the 37 common genes: “C5orf28”, “LPHN1”, “FAM160B2”, “MBD3”, “TNS4”, “PPDPF”, “ACTN4”, “RAB1B”, “LOXL4”, “COX2”, “TRAPPC9”, “MAN2C1”, “DVL1”, “C17orf63”, “KIAA0284”, “ZMIZ2”, “COL5A3”, “RNF145”, “ZBTB7B”, “C15orf44”, “RER1”, “MAP3K11”, “INO80E”, “RNPEPL1”, “SELO”, “MINK1”, “RAD23A”, “ATF7IP”, “TRIM28” , “UBE2O”, “SF3A2”, “SRRT”, “PIP5K1C” “CHD9”, “DND1”, “STRN4”.
Figure 1 is the plot of the first 1000 ranked genes by each method with the number of common genes selected by both methods. As this figure shows t-test and Wilcoxon Mann-Whitney choose a quite large number of common genes as we increase the number of genes selected by each method. This also shows that for the first few selected genes only small number are selected as common.
As we can see from Table 1 to 3, all the methods give 100% accuracy rate for the genes selected by t-test. SVM and NB acheive this accuracy at lower number of genes which is 3. But Fisher needs 9 genes and KNN needs 10 before they can achieve 100% accuracy. Only NB has 100% accuracy rate for the 6 genes selected by Wilcoxon Mann-Whitney. KNN achieve 100% accuracy rate using 3 genes selected from the common of t-test and Wilcoxon.
We can see some interesting points from these results. First, we observe that the performances of the discriminant functions depend on the gene selection methods (or the genes selected). For example, SVM has a 1000% accuracy rate for the genes selected by t-test, 83% accuracy rate for the genes selected by Wilcoxon and 94% accuracy rate for the common genes selected by the two gene selection methods. This shows that randomly choosing a gene selection method and discriminant function combination may not always give the best result. Secondly, we can see that we are achieving very high accuracy rates using only very few genes (maximum of 10 as we can see from the above tables). This shows that only very few genes discriminate patients from normal when we use gene expression data sets and most of the genes are just noise. This is consistent with our recent research [8].
We compare the three gene selection methods with the four discriminant functions all together. These results are better than the previous results [5]. We also use testing data to calculate these accuracy rates. Most of the work use k-fold cross validation to test their model. We believe our result is more robust to other data sets than theirs [5,9].
Our study shows that if we carefully choose our genes using the right methods we can achieve a high accuracy in identifying patients with atopic dermatitis disease. Using only such few number of genes with such high accuracy for discrimination will save us time, money and is very efficient.
In this paper, we analyzed two publicly available atopic dermatitis data sets. We compared the parametric two sample t-test and the non-parametric Wilcoxon Mann-Whitney gene selection methods. The genes selected by these methods are compared on four discriminant functions. We have found that the two gene selection methods choose very different set of genes. We have also found that regardless of the discriminant functions used, two sample t-test choose the most important genes in terms of classification. We believe our methods are more robust for other gene expression data sets as we use testing data for testing our methods.
This paper suffers from some limitations. First, we only use one type of data (i.e. atopic dermatitis data) to compare our methods and we believe using more type of data will make the methods more trustworthy. Secondly, we only used the independent gene selection methods which ignore the correlation among the genes. By assuming the genes are independent, we may lose some information. Thirdly, we have not studied the specific genes selected using their biological relevance.