A Mobile Health Intervention to Support TB Eradication Programme for Adherence to Treatment and a Novel QR Code Based Technique to Monitor Patient–DOTS Provider Interaction
Tuberculosis (TB) continues to be a major public health burden in India as the number of new cases still is in ascending trend. The major challenges lie in adherence of treatment of identified cases which involve treating them by ensuring the patient is completing full course of treatment with proper medication. Deviation from proper medication might lead to drug-resistant TB which will be even more complicated to get treated. World Health Organization recommends Directly Observed Therapy (DOT) as a measure for TB control strategy but challenge lies in patient visiting to health clinics regularly for treatment supervision. Alternate choice could be community based DOT(CB-DOT) since they are acceptable and accessible to the patient. The proposed mobile health (mHealth) based solution to support TB programmer objectives is a smart phone based application framework named TB track. The smart phone app is used by patients as well as DOTS provider helps in adhering to proper medication. This is achieved by proper monitoring of patients medicine intake, educating and motivating them during different phase of treatment through TB track smart app. The app also helps the patients in reporting symptoms during the phase of treatment. TB track app has a novel QR Code based technique for remote monitoring the patient-DOTS provider interaction. The mobile apps are designed to address common people with mobile HCI in mind. All the data collected from patient interaction with smart app such as their regular medicine intake, symptoms occurring during phase of treatment are saved in storage environment in web which can be used for data analytics.
Keywords: mHealth; National TB programme; DOTS provider; QR code; Mobile HCI Volume
Smart phone app based mobile health intervention is becoming a viable solution to support TB eradication programme. It could bring unique solutions by adapting newer technologies available through the technological growth. But it could be effectively utilized only if proper Human Computer Interaction(HCI) is taken care off. The proposed mHealth solution is to support TB programme through TB track app. The app provides support to the TB patients in taking right medicine for the day, motivates and educates the patients with regular messages, helps to report symptoms of uneasiness easily. Virtual medicine strips, symbolic representation and localization features were implemented in designing of app with mobile HCI aspects in mind. Novel QR code based patient-DOTS provider tracking helped to achieve accountability in DOTS provider and hence improved the Directly Observed Therapy concept proposed by WHO. This paper addresses through our proposed work the challenges mentioned through the literature survey. The Methodology and results through pilot testing demonstrate the outcome of implementing the smart phone based mHealth solution to support the TB programme.
World Health Organization (WHO) TB statistics reports for the year 2015 points out estimated incidence of TB for India is around 2.2 million cases out of a global incidence of 9.6 million with more than 2 million new cases every year Monitoring treatment response, treatment adherence, maintaining records for all TB patients, public health responsibility, notification of TB cases, health education are quite few important guidelines the National TB programme implements on TB patients in India as per the recommendations of World Health Organization(WHO) [1,2]. WHO insists the patients should be observed while taking their medicine which could be implemented through Directly Observed Therapy (DOT) as the TB control strategy [3]. The crucial element of the TB programme is to focus on strict adherence to TB treatment by patient until cure. It involves continual medicine intake and periodical TB test for patients until cure and avoidance of wrong dosage of medicine. Failing to do so will result in increase on cases of drug resistance TB which will complicate in further treatment. Treatment supervision by DOT in clinic will be an additional burden due to resource constraint and cost intensive for health clinics. Patients might also have constraints in visiting clinic daily due to the reasons of travel and waiting time for treatment. The alternate choice could be an community based –DOT(CB-DOT) which can be from organized community groups, peer groups, chosen members of the community, and family members if trained could act as potential supervisors to ensure completion of treatment and hence cure [4]. Patient should not be left as mere passive recipient of services they should be motivated and educated and should be an active partner in TB programme. They should be made to have responsibility in sharing information to the public health, adhering treatment properly and come forward in sharing their expertise experienced during treatment [5].
Increasing penetration of smart phones among common people because of its lowering cost and the proliferation of high speed mobile networks and services available at cheaper prices the smart phone based mHealth solution will play a far greater role in healthcare in both developed and developing countries in the future [6-8]. Success of mHealth solution will be based on good Human Computer Interaction (HCI) design which should be user centric, in fact technological developments and its impact could effectively utilized only if proper focus is given to the usability of the technology fitting in to daily life of common people. The design approach should be based on intellectual traditions of several disciplines including human factors, computer science, information systems, psychology, sociology, and visual design [9-11]. With technology becoming viable, mHealth solution will have to become an inevitable part of strategic design for setting future TB programme standards where mobile phone will the easiest mode to reach out patients who are located in places where difficulty in approaching them is high. Proof of concept and studies have shown mHealth has been influential in TB treatment through medication monitoring, record keeping and possibly help in motivating and educating patients. This could be useful when scarcity of human observers is an issue [12].
India accounts for one fourth of the global TB burden. In 2015, an estimated 2800000 cases occurred and 480000 people died due to TB (GOI, 2017). India has highest burden of both TB and MDR TB based on estimates reported in Global TB Report 2016. An estimated 130000 incident multi-drug resistant TB patients emerge annually in India which includes 79000 MDR-TB Patients estimates among notified pulmonary cases. India bears second highest number of estimated HIV associated TB in the world. An estimated 110000 HIV associated TB occurred in 2015 and 37,000 estimated number of patients died among them (Table 1).
With a rise in smart phone ownership globally, China will have highest number of smart phone users, 1.3 billion, in 2018, followed by India with 530 million users. The US will be a distant third, with 229 million users. According to a new study by US-based media agency Zenith, smart phone ownership globally will continue to expand in 2018. The agency said that 66 per cent of individuals in 52 countries will own a smart phone in 2018 – up from 63 per cent in 2017. India currently has in between 300-400 million smart phone users. There are about 650 million mobile phone users in India, and just over 300 million of them have a smart phone, according to Counterpoint Research. Two out of three Indian mobile users – or roughly 433 million people are planning to upgrade their phones in the next year. The number of internet users in India is expected to reach 450-465 million, said a recent from the Internet and Mobile Association of India (IAMAI) and market research firm IMRB International. The report said overall internet penetration in India is currently around 31 per cent.
In this paper we propose a mHealth system to support TB programme demonstrated through a developed pilot project. The architecture diagram is shown in Figure 1. Smart mobile phones are provided to identify tuberculosis patients with customized mobile application TB track loaded to it. The app enables to monitor them throughout the course of treatment. The system also has web based application intended for TB units where patient details and schedules for treatment can be entered. The web application can also generate reports on patient’s record like daily medicine intake, their reported symptoms and more. The system ties up with third party SMS service provider which enables web application to implement message communication to be send to respective patients, DOTS providers and medical supervisors. The web app can compute reminders separately for each patient if the patient had skipped medicine. It can send alert messages to intended DOTS provider if the patient has reported symptoms of uneasiness. It also sends motivational and educational messages at regular interval. The DOTS provider is also provided with mobile app to report their attendance. The collected data such as patient medical intake, patient symptoms occurring during course of treatment, report of sputum test and DOTS provider attendance are stored in database these data can be analyzed and report can be generated for perusal.
Of the 20 patients whom we have tested the mobile application included for categories
i) Young Men – Below the age of 35
ii) Young Women – Below the Age of 35
iii) Adult Men – Above 35
iv) Adult Women –above 35
The distribution was done equally among these four groups. All of them were educated up to high school. Since Kerala is a high literate state with literacy rate above 90% the education level in general is high compared to other states.
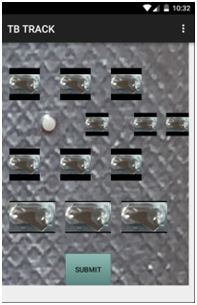
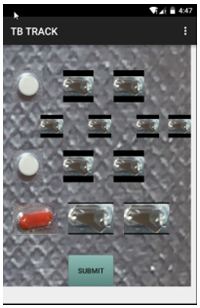
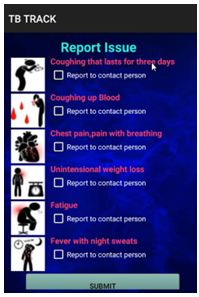
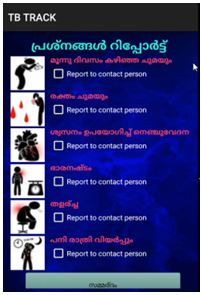
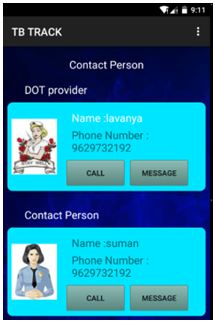
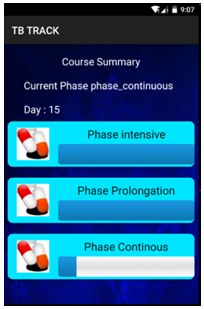
TB patient mobile app: The internet enabled mobile application is used by patients to report their daily intake of medicine during the different phases of treatment namely intensive phase, prolongation phase and continuous phase. The data will be collected by the web application and stored in database. Figure 2 shows the TB track mobile app screen shot of a patient in ‘intensive phase’ who is presented with virtual tablet strip with voice support which the patient needs to submit to TB track database. Figure 3and 4 shows the screen shot of patient in ‘continuous phase’ that is presented with different tablet dosage for intake. The patient can also report any symptoms during the course of medication immediately through SMS to DOTS provider Figure 5, 6and 7 shows the screen shot. The patient will receive educational, motivational messages and also reminders or alert messages for intake of medicines or alerting patient when medical test is due (Figure 8, 9and10). The app provides feature for one touch calling and messaging to connect to contact person or DOTS provider in case of emergency is shown in Figure 8. It also provides details like course of treatment; schedule for next sputum test of the patient by fetching the values from database is shown in Figure 11.
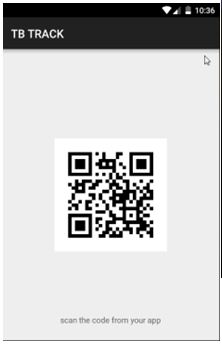
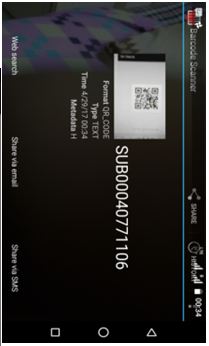
DOTS provider mobile app: The DOTS provider are also provided with internet enabled app which interact with patients mobile app for registering the presence of DOTS provider interaction with patient (Figure 12andFigure 13). Figure 13 shows the screen shot of QR code scanner component used to scan the generated QR code in patient’s TB track app Figure 12 for registering attendance which will be recorded in TB track database with timestamp. We can also record time spend by DOT provider with patient with entry and exit times.
The web application part of TB track can be used by medical staffs, doctors, lab technician of TB units with respective access level. When a patient is identified with TB, a TB sheet is generated with the entire data set being entered in to the data base through web interface. A unique ID and password will be generated for the registered patient which will be given to the patient along with smart phone with TB track app loaded. Similarly A unique ID and password will be generated for the DOTS providers to enable them to login in to their customized app. The patient will be using the user ID and password every time to login to the mobile app for daily reporting medicine intake and report symptoms if he had any during the day. The web application runs a cron job routine twice a day at stipulated time to identify each registered patients has taken medicine properly or not. It escalates any issue of non-adherence of treatment by a patient through reporting to respective DOTS providers for the patient .The web application further escalates and reports to the treatment supervisor if DOTS provider has not responded with in time. The web application also sends separate educational and motivational messages for each patient. A set of messages stored in data base will be send in sequence on daily basis at different time intervals based on which phase of treatment course the patient is in. The web application also allows entering diagnostic test reports and treatment schedule which could be viewed by patient and helps in alerting patient through SMS for going for medical tests when it is due. TB track application records all the activities of patient interacting with the mobile app in to TB track database. Consolidated report can be generated for patients registered in TB unit like the medicine intake during the phase of treatment, symptoms recorded by patients during the phase of treatment, DOTS providers attendance recorded during the patient interaction.
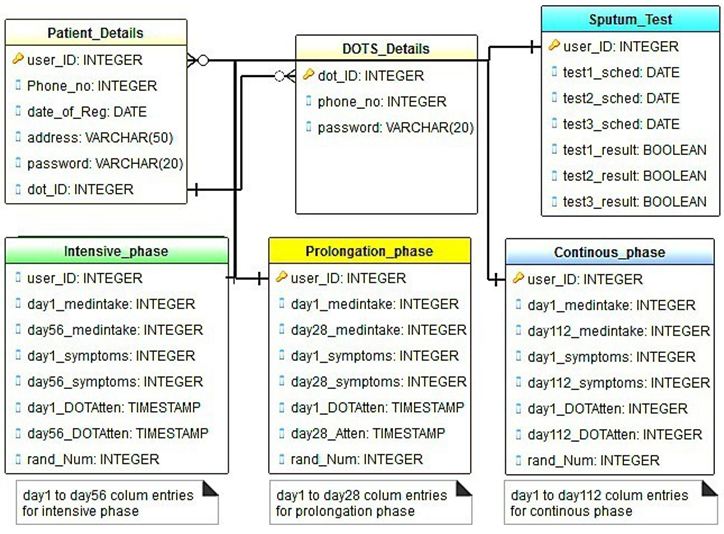
TB track application records the activities of patients, TB unit personals and DOTs providers. Patients reporting with the mobile app to report medicine intake and symptoms, TB unit personals entering patient data such as their details, sputum test reports, etc., through web interface and DOTs provider registering attendance through DOTs provider mobile app are recorded in to TB track database. Figure 14 shows the partly database schema used by TB track application. TB unit registering patient details while registering them for treatment and their scheduled patient sputum test dates and reports are entered through web interface in “Patient Details” table and “Sputum Test” table respectively. Patient’s medicine intake details and symptoms details are recorded through their mobile app in to the “Intensive phase”, “Prolondgation phase” or “Continuous phase” Table depending on which phase they are in. Similarly DOTs provider attendances are recorded from their mobile app when they interact with patients as a timestamp in the respective patient detail entry in the respective table. Consolidated report can be generated for patients registered in TB unit for getting details like the medicine intake during the phase of treatment, symptoms recorded by patients during the phase of treatment, DOTS providers attendance recorded during the patient interaction.
The TB track application framework uses third party bulk SMS service for sending periodical alerting, educational and motivational messages to the TB patients. The SMS application is leveraged with the TB track web application for sending messages to patients, dot providers, medical treatment supervisors in their local native language whose phone numbers are stored in TB track database. Messages were send twice a day to DOTS providers and medical officers on their respective patients status of intake of medicine so that they can act upon if they have not submitted medicine intake status through app .Educational and motivational messages were send to patients day to day basis depending on the particular day of treatment. Compute alert messages will be send to patients and DOTS provider to remind them if they had not taken medicine, reminders the patients for taking regular checkup when it is due and alerting DOTS provider and medical supervisors if patient has reported symptoms through app.
• First the patient identified with TB will be registered to nearby TB unit by entering details, diagnostic test reports and treatment schedule in TB track web portal. A unique ID and password will be generated for the registered patient which will be given to the patient along with smart phone with TB track app loaded to it.
• Patient starts using internet enabled smart phone for reporting his daily intake of their medicine during the different phase of treatment. Intensive phase, prolongation phase or continuous phase. Data are collected by the web application. Each day according the course of treatment the patient is shown with virtual medicine strip to direct him to take correct medicine.
• The patient is accepted to submit his acknowledgement through mobile app to the TB track web application. The web app monitors whether the patient has taken right medicine at right time and alerts the DOTS provider, medical treatment supervisor based on escalation level. The messages can be send in local languages too.
• The web application also sends exclusive educational and motivational messages on daily basis through a cron job routine at different time intervals for each patient by computing on which duration of treatment course the patient is in.
• The web application checks daily through a cron job routine to compute due date for diagnostic test and treatment schedule for each individual patients and intimates them along with DOTS provider when it is due through SMS service.
• The app will be closed on successful completion of course after the stipulated duration of treatment is over. The medical administrator decides the course of action for continual of further treatment.
• DOTS providers’ smart phone with its IMEI number gets registered in Web application database. DOTS providers are provided with an app which has QR code scanner feature.
• When DOTS provider reaches out to patient for monitoring his medicine intake or during situation TB patient needing attention he asks the patient to open their mobile app. The mobile app in patient mobile will connect to TB track web application which will generate a QR code image. The QR Code image which is based on a 6 digit computed random number is now downloaded to patient mobile app .The random number generated is stored against the patient entry in database will be used for verification from DOTS provider confirming his interaction.
• The DOTS provider has to scan the generated QR code in the patient mobile app through their registered app.
• The scanned code would be computed in the app to get decrypted to original code and would be send from DOT provider’s mobile app to the TB track web application where it is compared with the computed random number generated and stored against the patient entry in database. The mobile’s IMEI number and DOTS provider ID are also compared with registered one in database to ensure the data is send from the registered DOTS provider mobile only
• If comparisons are correct then a timestamp would be stored in database against the entry of DOTS provider to register the DOT provider presence with patient. A SMS could send to the medical officer who can conduct cross verification with patient or DOT provider for ensuring adherence of treatment.
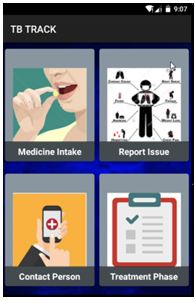
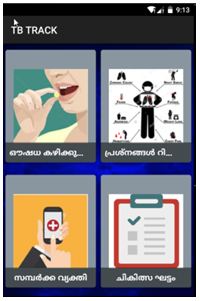
Ergonomics and psychology were considered in designing the TB track mobile app [13, 14]. The patient logs in to the app for reporting intake of medicine can view the virtual medicine strip which provides proper guidelines to take appropriate medicine for the day. The virtual medicine strip in the app not only reminded patient to take right medicine for the day but also psychologically supported them in taking medicine. The app also provides facility for one touch emergency call/SMS to respective DOTS provider assigned for each patient to report an issue in case of emergency. Symbolic representation as well as voice based intimation made the patient easy to adapt in using the app when they were trained. The app has multi language support through localization feature which enables the patient to choose appropriate language of their choice. Figure 6, 7, 8and 9 shows TB track app menu and symptoms report screen shot with multi-lingual support.
By using TB track mHealth framework we intent to record and submit daily medicine intake by patients, symptoms if any during the course of treatment and assesses the impact of educational and motivational messages during the full course of TB therapy and evaluate mobile health workers adherence in interaction with TB patients throughout the pilot project testing period.
We selected 20 Patients of the TB care unit, they were provided with smart phones loaded with TB track app and were trained to use it. The patient logs in to the app to view medicine intake for the day if there is any presented in the mobile app as a virtual medicine strip. The patient needs to press each tablet image and press submit button to report to the TB track system that they had taken right medicine for the day. Patients were asked to report symptoms through app if they had experienced during the course of treatment. Mock test were conducted by asking patients to report symptoms through app. TB patients were send with motivational and educational messages through SMS besides all important reminders to remind them for taking periodical sputum test.
This pilot project experience demonstrated encouraging signs of people adhering to TB track app. Out of 20 patients given the app for pilot testing 17 patients of various age group gave positive response and rated for overall usage of app as good, whereas only 3 patients found it difficult to get used the app during the course of treatment. Since the data for the app is internet fetched based on individual credential it is customized for every individual patients. It is been observed about 70% of the patients found it easy to take right medicine for the day by comparing with virtual medicine strip appearing in app screen. The huge plus of this TB track solution lied in monitoring attendance of TB patient–health worker (DOTS provider) interaction. The TB track application framework insist health workers (DOTS provider) to follow the protocol of scanning the QR code generated from patient mobile. This sends immediate message to the higher medical officer who can immediately track them. These created accountability in health workers since their attendance were registered in database.
i) TB track application was given to users with the following scenario: “The patients were urgently asked to report through the TB track app for given mock symptoms to DOT provider at random days during the course of treatment”. The objective is to find the usability of the app and monitor the response of DOT provider in attending the patient.
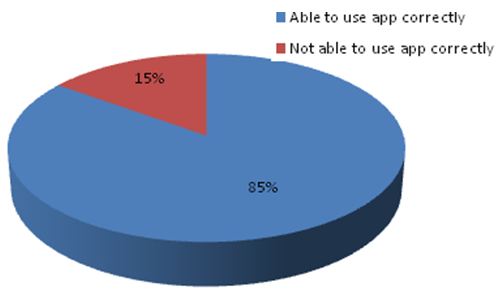
a) 17 out of 20 patient users (85 %) found it ease of use when they were are asked to report symptoms where symbolic representation and localization were found to be helpful in selecting the choice of symptoms (Figure 15).
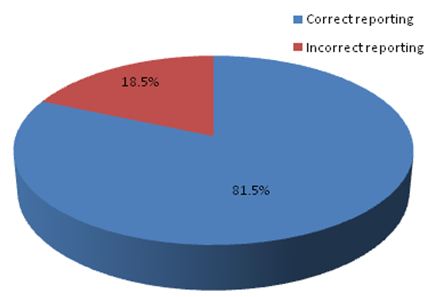
b) Out of 200 responses collected from patients for symptoms during the phase of treatment where patients were reported to submit mock symptoms through app. We were able to collect 81.5 % of responses being reported correctly (5 cases during the mock test had real symptoms and they reported them correctly) (Figure 16).
c) DOT providers were asked to attend their respective patients for monitoring their patient’s medicine intake as well as the time when they had reported symptoms. It is been observed since their attendance were tracked with timestamp in TB track database though they were in remote places. They felt they are accountable to answer when they were called upon for verification. This led to improved response of DOT provider attending patient regularly.
The second scenario was to implement pilot testing for collecting medicine intake on patients in intensive phase period and continuous phase period .The objective is to monitor and collect information of medicine intake of patients, support existing system for correct medicine intake and physiological impact in motivating patients for adhering treatment properly. Out of 20 patients observed for treatment for 15 days 16 were taking treatment in intensive phase and 4 were in continuous phase.
a) There were 7 instances recorded patients need not report medicine intake. DOT providers were informed to ensure medicine intake was taken properly
b) 17 patients gave feedback that TB track app was supportive for providing reminder and correct medicine intake .All the patients gave feedback that single touch for calling DOT provider was helpful.
c) Regular motivating and educating messages had made positive impact among the patients. App supporting local language was preferred
In mobile and e-health platforms confidentiality and anonymity are central issues and there is a need to address them. In this project we have addressed both by taking consent from the participants. The app gives the option for the subscriber to be anonymous or open. The names have been changed to numbers. The data are shows as anonymous data while patients can use the data for their own use like follow up and treatment assessment and third party view of data is shown in anonymous mode. More over since the data is managed primarily by patients the sharing option also is kept with the users.
This paper presents a smart phone based mHealth solution for supporting TB treatment. The educational back ground, age and family background would still pose major challenge and limit the prospect of inculcating mHealth solution in to TB treatment programme. It is also observed that success of smart app based mHealth solution is largely based on good HCI design which is instrumental in acceptance of app by users. The results of pilot testing of project on usability showed virtual medicine strip, symbolic presentation to report symptoms, localization and voice support substantially aided the effort needed to train the patients for using the app. The TB track application infused responsibility and accountability in DOTS providers’ ensured better patient monitoring through the QR code based attendance system. With cheaper the smart phones and availability of internet services due to improved information and communication technology(ICT) smart phone based mHealth solution for TB programme is a viable strategy to be adopted along with the existing practice at least at selected areas where technology is available.
Pilot testing of the TB track app framework was done in SRM University Medical Hospital located in Kattankulathur, Chennai with the support of school of public health department in SRM University Medical college. The app was also tested with 8 patients in Thrissur District TB Hospital, Kerala. We thank Mr. Tom Thomas Founder Chairman Olive Touch Healthcare Services Limited &Mutual Assistance Resource Group (MARG) P.O, Ayyanthole, Near State Bank of Travancore, Ayyanthole Thrissur, Kerala 680003 – India for providing support.


