A Novel Potential Strategy for Enhancing Antigen Presentation of Human Hepatocellular Carcinoma Cells Propagated ex-vivo Using a Ribonuclease Enzyme System
Hepatocellular carcinoma (HCC) is considered a major health problem as it is the fifth most common neoplasm in the world. It represents one of the most resistant types of malignancy, as systemic therapy with cytotoxic drugs provides only marginal benefits, especially with advanced stages. Dendritic cells-based immunotherapy may represent a novel and effective tool for HCC treatment. The current study was designed to investigate the possible enhancement of antigen presentation following treatment of HCC cancer cells ex-vivo using ribonuclease A (RNase A). Activated lymphocytes and monocytes-derived dendritic cells isolated from HCC patients were pulsed by RNase A- and/or sorafenib-treated autologous HCC cells. The expression of genes involved in antigen presentation, including LMP-2 and TAP-2, and some immunophenotypic markers in different phases of the immune response were evaluated. Treatment of HCC cells with RNase A caused a significant enhancement of antigen presentation, as demonstrated by the upregulation of LMP-2 and TAP-2 mRNA gene expressions, augmented T-lymphocytes priming by dendritic cells (as revealed by the upregulation of CD44 mRNA gene expression), that ultimately exaggerated the immune response. Our findings indicate that RNase A-treated HCC cells exhibited a better presentation of tumor associated antigens. Further studies are recommended to elucidate the underlying contributory mechanisms involved in HCC attenuation by RNases.
Keywords: Antigen presentation; Hepatocellular carcinoma; Immunotherapy; Ribonuclease A; Sorafenib
Hepatocellular carcinoma (HCC) is the third most frequent cause of death from cancer worldwide, which accounts for about 6% of all new cancer cases diagnosed worldwide (nearly 750,000 new cases/year) [1]. Current therapies for early disease include liver transplantation, surgical resection or local ablation, however, these modalities do not lead to long-term cure in the majority of patients with advanced HCC [2]. Therapeutic options in advanced irresectable HCC are limited to sorafenib, a multi-tyrosine kinase inhibitor with antiangiogenic and antiproliferative effects, although it prolongs the overall survival for only 2~3 months. Furthermore, some HCC patients initially respond to sorafenib, but eventually succumb to the disease, indicating that the acquired resistance to sorafenib greatly limits its beneficial effects [3].
The immune evasion in HCC represents a main barrier to the delivery of an effective immunotherapy [4]. Therefore, inhibiting the immune suppressive effect of cancer cells represents an important step in cancer immunotherapy. Although protocols differ, a common outline in immunotherapy is the activation of dendritic cells (DCs) in order to enhance antigen presentation, and hence the studying of surface and molecular markers can aid in evaluating efficient immunotherapeutic tools [5].
Endogenous processing of peptides in antigen presenting cells (APCs) involves degradation of cytoplasmic proteins into short peptides, mediated by the multi-catalytic proteasome complex, particularly large multifunctional proteases (LMPs) [6]. These peptides are transported from the cytosol to the endoplasmic reticulum lumen for loading into major histocompatibility complex (MHC) molecules, and this translocation across the membrane is accomplished by transporters associated with antigen processing.
Bovine pancreatic ribonuclease A (RNase A) is well known to catalyze phosphodiester bond cleavage after 3'-pyrimidine bases in RNA that results in the formation of RNA fragments and ultimate inhibition of protein synthesis [9]. The present study aimed to investigate whether treatment of HCC cells propagated ex-vivo with RNase A and subsequent culturing with autologous DCs and lymphocytes enhances antigen presentation. In order to achieve the goal of the study, molecular markers including the expression of some genes involved in antigen presentation and T-cells priming (TAP-2, LMP-2 and CD44), as well as immunophenotypic markers were evaluated.
Sorafenib (Santa Cruz Biotechnology, Inc., Dallas, TX, USA) was dissolved in dimethyl sulfoxide (DMSO) and freshly diluted with Dulbecco’s Modified Eagle’s Medium (DMEM)-high glucose (Biowest Inc., Nuaillé, France) and HyClone™ Ham's Nutrient Mixture F12 medium (1:1) (Thermo Fisher Scientific, Utah, USA). Bovine pancreatic ribonuclease A (RNase A, A797A) was provided from Promega (WI, USA).
A total of fifty newly diagnosed HCC patients was initially chosen from the outpatient clinic (2015-2016) at the Egyptian National Cancer Institute (Cairo University, Giza, Egypt). All experiments were approved by the Institutional Ethical Committee of the Egyptian National Cancer Institute (IRB No: IRB00004025 and Approval No: 201516031.3) and informed consents were obtained from all subjects according to the Helsinki Declaration. A small portion of the core liver biopsies from HCC patients was placed into sterile tubes containing 2 ml Dulbecco’s Modified Eagle’s Medium (DMEM)-high glucose with 4% penicillin/streptomycin [10]. Within one-hour, biopsy sections were washed twice with phosphate-buffered saline (PBS), minced into small pieces and approximately 4 or 5 tissue pieces were placed into a 25 cm2 tissue culture flask followed by the gentle addition of 1 ml complete DMEM-high glucose medium and HyClone™ Ham's Nutrient Mixture F12 medium (1:1) complemented with 10 % FCS, antibiotic (1%) and enriched with hepatocyte growth factor (HGF, 20 μg/ml) (Sigma Chemicals, St Louis, MO, USA). The flasks were incubated in a humidified 37 ºC, 5% CO2 incubator for 48 h followed by the addition of 3 ml of the aforementioned media. The culturing medium was exchanged every 72 h for maintenance and cultured HCC cells for each patient were established after 20-25 days. Success culturing was approximately 15 out of 50 specimens, which were therefore selected in the current study. Successfully established HCC cells in culture were washed twice with PBS and harvested using trypsin for 1 min followed by the addition of complete DMEM/HAM’s medium (1:1). The cell suspension was transferred into a sterile falcon tube and centrifuged at 1800 rpm for 5 min. The HCC cell pellets were washed twice with PBS and a volume of 1 ml complete DMEM/HAM’s culture media (1:1) was added to the cell pellet. HCC cells were then stained with 0.4% trypan blue and counted with a hemocytometer. Characteristics of selected patients were depicted in Table 1.
Peripheral blood mononuclear cells (PBMCs) were isolated from HCC patients by the Ficoll-Hypaque density gradient centrifugation (Biochrom KG, Berlin, Germany) and then cultured in a complete RPMI-1640 medium (Sigma Aldrich, St Louis, MO, USA) containing 10% fetal calf serum (FCS), penicillin (100 U/ml) and streptomycin (100 μg/ml) (Biochrom AG, Berlin, Germany) in 25 cm2 cell culture flasks that were stored horizontally for 4 h in a humidified 37 ºC, 5% CO2 incubator [11,12]. The medium suspension containing non-adherent cells (lymphocytes) was transferred into a sterile falcon tube and centrifuged at 1800 rpm for 5 min. Cell pellets were cultured in 25 cm2 cell culture flasks containing complete RPMI-1640 medium enriched with recombinant human interleukin-2 (rhIL-2; 20 IU/ml) and interleukin-6 (rhIL-6; 10 IU/ml) (Bio Basic Inc., Ontario, Canada) [13]. Flasks were stored horizontally for 6 days in a humidified 37 ºC, 5% CO2 incubator and semi-refreshment of the culture medium, including the cytokines, was performed every three days. The medium suspension containing propagated lymphocytes was transferred into a sterile falcon tube that was centrifuged at 1800 rpm for 5 min and pelleted lymphocytes were washed twice with PBS. A volume of 1 ml complete RPMI-1640 medium was added to the cell pellet, lymphocytes were stained with 0.4% trypan blue and then counted with a hemocytometer. Lymphocyte suspensions were centrifuged at 1800 rpm for 5 min, cell pellets were preserved in a 1 ml cryotube containing complete RPMI-1640 medium supplemented with 10 % DMSO and then stored at -80 ºC. After the removal of the medium suspension containing non-adherent cells (lymphocytes), the flasks were washed twice with PBS, adherent cells (monocytes) were cultured in a complete RPMI-1640 medium containing 10% FCS, recombinant human granulocyte monocyte-colony stimulating factor (rhGM-CSF; 800 IU/ml) and recombinant human interleukin-4 (rhIL-4;500 IU/ml) (Bio Basic Inc., Ontario, Canada). Flasks were stored horizontally for 6 days in a humidified 37 ºC, 5% CO2 incubator and semi-refreshment of the culture medium, including the cytokines, was performed every three days. After incubation, non-adhered and loosely adhered cells (non-viable dendritic cells) were removed by washing the flasks twice with PBS and viable immature dendritic cells (imDCs; well-attached cells) were harvested after adding trypsin (Biowest Inc., Nuaillé, France) for 30 sec followed by the addition of complete RPMI-1640 medium. The cell suspension was transferred into a sterile falcon tube and harvested imDCs were washed in PBS twice, centrifuged at 1800 rpm for 5 min and then a volume of 1 ml complete RPMI-1640 medium was added to the cell pellet. Immature DCs were then stained with 0.4% trypan blue and counted with a hemocytometer. The suspension of imDCs was centrifuged at 1800 rpm for 5 min and cell pellets were preserved in a 1 ml cryotube containing complete RPMI-1640 medium supplemented with 10% DMSO and then stored at -80 ºC.
A number of 15×103 propagated HCC cells was equally divided into 3 wells (5×10³ cells/well) and cultured in complete DMEM/HAM’s culture media containing either 5 μl RNase A (10 mg/ml) (group II), sorafenib (5 μmol/ml) (group III), or both RNase A and sorafenib (group IV) for 12 h, followed by cell trypsinization and fixation with 2% cold and freshly prepared paraformaldehyde in PBS for 10 min [ 14]. Fixed HCC cells were washed thrice with PBS and then centrifuged at 1800 rpm for 5 min. Cell pellets were suspended in 2 ml complete DMEM/HAM’s culture media (1:1).
The present study included four groups; group I (Control), HCC cancer cells (5×10³) from each patient were simultaneously cultured with their autologous imDCs and lymphocytes; group II (RN) where RNase A-treated HCC cells (5×10³) from each patient were simultaneously cultured with their autologous imDCs and lymphocytes; group III (Sorf) where sorafenib-treated HCC cells (5×10³) were simultaneously cultured with their autologous imDCs and lymphocytes; group IV (RN-Sorf) in which RNase A- and sorafenib-treated HCC cells (5×10³) were simultaneously cultured with their autologous imDCs and lymphocytes.
Propagated imDCs were activated by culturing in a six-well plate in complete DMEM/HAM’s culture media (1:1) containing rhGM-CSF (400 IU/ml), recombinant human interleukin-4 (rhIL-4; 250 IU/ml) and recombinant human tumor necrosis factor alpha (rhTNF-α; 10 ng/ml) (Bio Basic Inc., Ontario, Canada) for 24 h in a humidified 37 °C, 5% CO2 incubator in the presence of their autologous HCC cells (groups I to IV) at a ratio of one-fold HCC cells to ten-folds imDCs. After the incubation period, propagated autologous lymphocytes were added to the previous cocktail of cells (at a ratio of 10:1 lymphocytes to mature DCs) in addition to rhIL-2 (50 IU/ml) and rhIL-6 (50 IU/ml) for 72 h. All non-attached cells (mature DCs, lymphocytes and unattached HCC cells) were transferred into a sterile falcon tube and centrifuged at 1800 rpm for 5 min. The cell pellets were then suspended in 2 ml complete DMEM/HAM’s media (1:1) then subdivided into two aliquots. The first one was instantaneously used to measure immune cells immunophenotyping, while the other aliquot was preserved at -80 ºC for mRNA extraction. The liquid culture media supernatant was separated and preserved at -20 °C for the quantitation of interleukin 12 (IL-12) and lactate dehydrogenase (LDH) levels.
Immunophenotype analysis was done in EPICS® Flow Cytometer (Beckman Coulter Inc., CA, USA) using monoclonal antibodies against CD3, CD4, CD8 and CD56 (DakoCytomation, Münster, Germany), CD19, CD38, CD81, CD83, CD86 and CD209 (eBioscience, CA, USA) [15].
The levels of LDH (a cell death marker) and IL-12 (a marker of DCs maturation and stimulation) were measured in the culture media supernatant using ELISA kits provided from Cloud-Clone Corp. (Houston, TX, USA) and R&D Systems Inc. (Minneapolis, MN, USA), respectively [16,17].
Total cellular RNA was extracted from all non-attached cells (mature DCs, lymphocytes and HCC cancer cells) using an RNA Isolation Kit (Roche Diagnostics, Mannheim, Germany). Extracted RNA was quantified by NanoDrop One (Thermo Fisher Scientific, WI, USA) and was reversely transcribed by a cDNA Reverse Transcription Kit (Applied Bioscience, CA, USA). Real-time polymerase chain reaction (RT-PCR) quantitative estimation of CD44, TAP-2 and LMP-2 mRNA gene expressions was done by RT2 SYBR® Green ROX™ qPCR Mastermix (QIAGEN, Hilden, Germany) in a mini PikoReal™ (Ver.2.2) machine (Thermo Scientific, Finland). Primers used in the amplification process (AlphaDNA, Montreal, Canada) were listed in Table 2[18-21]. Relative mRNA expression of selected genes was calculated using the comparative threshold cycle method [22].
The Shapiro-Wilk's test for normality (p>0.05) was used to examine the normality of obtained data [23]. Equal variance between groups was first checked using the Levene’s test for homogeneity of variances and statistical analysis of the difference between mean values of parametric data was carried out using one-way analysis of variance (ANOVA) followed by the least significant difference (LSD) test for multiple comparisons. For non-parametric data, Kruskal-Wallis test was applied, followed by the Mann-Whitney test. A value of p<0.05 was considered statistically significant for all tests. SPSS statistical software 24.0 for Windows (SPSS, Inc., Chicago, IL, USA) was used for all analyses.
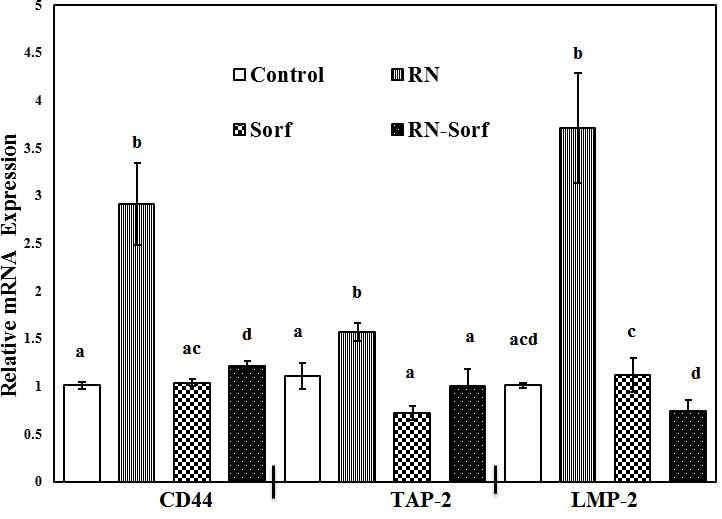
Treatment of HCC cells with RNase A and subsequent pulsation to dendritic cells showed a significant upregulation of mRNA expressions of TAP-2 (41.44%; p<0.01), LMP-2 (267.33%; p<0.001) and CD44 (188.12%; p<0.001) genes, compared to untreated pulsed HCC cells. On the other hand, combining RNase A with sorafenib treatment resulted in a significant upregulation of CD44 mRNA gene expression (19.80%; p<0.05), compared to untreated pulsed HCC cells ( Figure 1).
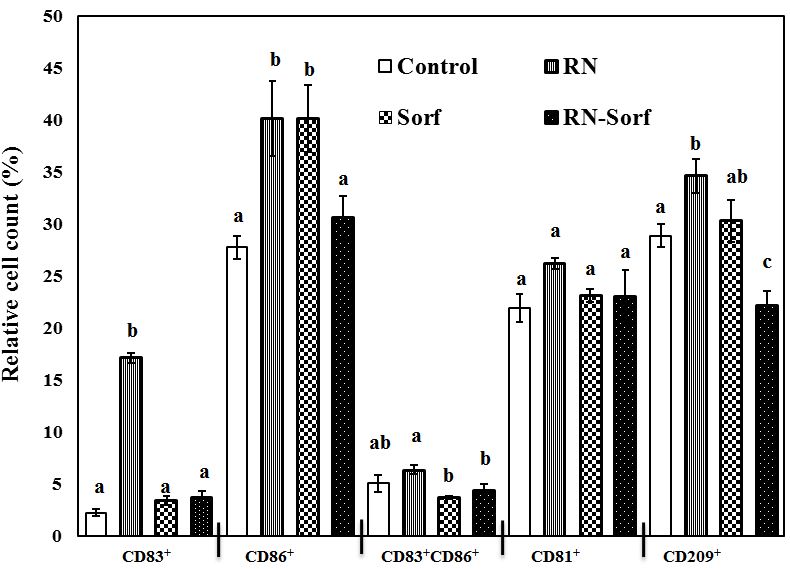
Dendritic cells pulsed by RNase A-treated HCC cells showed enhancement of antigen presentation as revealed by the significant elevation in several immunophenotypic markers, including CD83+ (665.63%; p<0.001), CD86+ (44.60%; p<0.01) and CD209+ (19.80%; p<0.05) levels, while dendritic cells pulsed by sorafenib-treated HCC cells showed a significant elevation in the relative count of mature DCs (CD86+) (44.60%; p<0.01), compared to untreated pulsed HCC cells. By contrast, sorafenib treatment counterbalanced the antigen presentation-enhancing effect of RNase A on HCC cells and caused a significant decrease in CD209+ (22.95%; p<0.01) level, compared to untreated pulsed HCC cells (Figure 2).
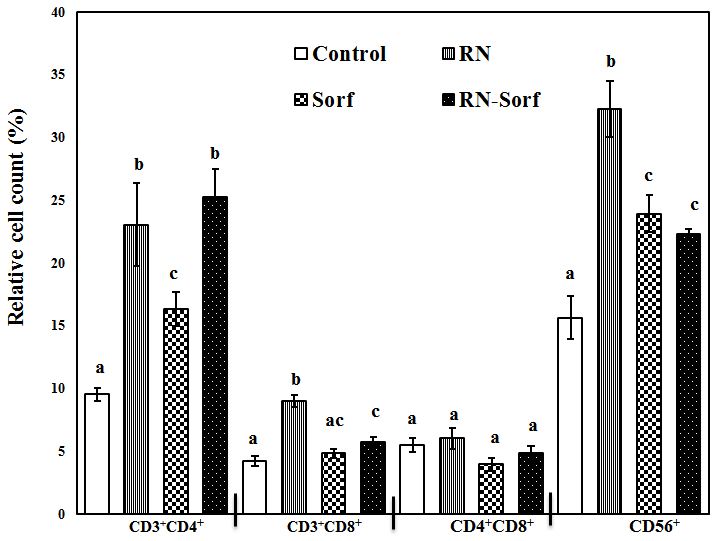
Ribonuclease A treatment of HCC cells induced a significant elevation in the relative count of T-helper lymphocytes (CD3+CD4+) (141.72%; p<0.001), cytotoxic T lymphocytes (CD3+CD8+) (113.78%; p<0.001), as well as NK cells (CD56+) (106.53%; p<0.001), compared to untreated pulsed HCC cells. In addition, sorafenib treatment caused a significant elevation in the T-helper cell marker CD3+CD4+ (71.38%; p<0.05) and NK cells CD56+ (53.17%; p<0.01), compared to untreated pulsed HCC cells. Furthermore, combined treatment of RNase A-treated HCC cells with sorafenib produced significant elevations in the relative count of T-helper lymphocytes (CD3+CD4+) (164.99%; p<0.001), cytotoxic T lymphocytes (CD3+CD8+) (37.05%; p<0.05) and NK cells (CD56+) (42.55%; p<0.01), compared to untreated pulsed HCC cells (Figure 3).
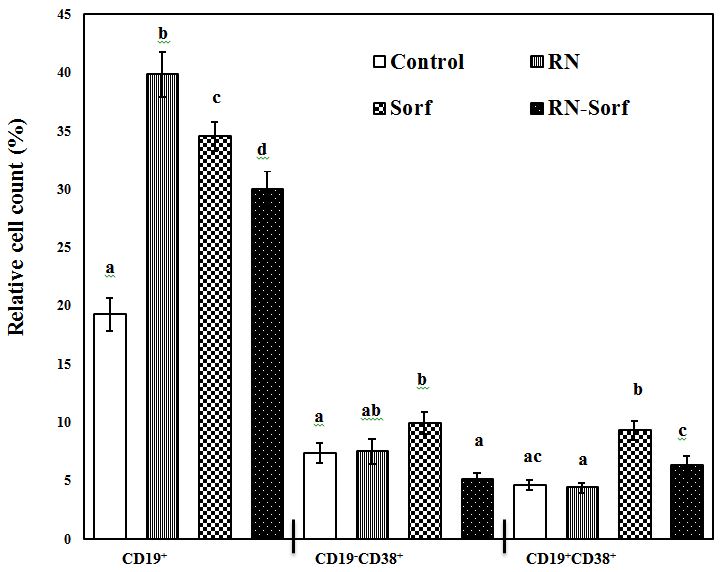
Pulsing immune cells with RNase A-treated HCC cells caused a significant elevation in the relative count of the total B-lymphocytes (CD19+) (106.96%; p<0.001), compared to untreated pulsed HCC cells. On the other hand, sorafenib produced a significant increase in the relative count of the total B-lymphocytes (CD19+) (79.27%; p<0.001), activated T-lymphocytes (CD19-CD38+) (34.78%; p<0.05), as well as activated B-lymphocytes (CD19+CD38+) (102.39%; p<0.001), compared to untreated pulsed HCC cells. Also, combined treatment of RNase A-treated HCC cells with sorafenib produced a significant elevation in the relative count of the total B-lymphocytes (CD19+) (55.69%; p<0.001) (Figure 4).
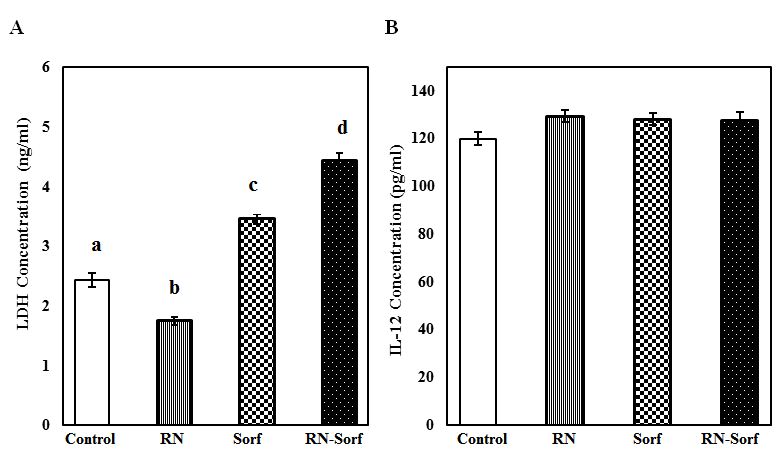
Treatment of HCC cells with RNase A resulted in a significant decrease in LDH concentration (28.29%, p<0.001), and by contrast a significant elevation in LDH level was recorded following treatment of HCC cells with either sorafenib alone (41.80%; p<0.001) or along with RNase A (81.97%; p<0.001), compared to untreated pulsed HCC cells (Figure 5A). On the other hand, a non-significant change was recorded in the IL-12 level in culture media supernatant among different groups (Figure 5).
The results of the current study demonstrated an enhancement of tumor associated antigens (TAAs) presentation by APCs after treatment of HCC cells with RNase A, as revealed by the significant upregulation of LMP-2 and TAP-2 mRNA genes expression, along with a significant increase in DC markers (CD83+, CD86+ and CD209+). On the other hand, the upregulated CD44 mRNA gene expression is an evidence for enhanced T-lymphocytes priming by dendritic cells. In agreement with the enhanced antigen presentation recorded in the present study, a significant increase in the relative counts of T-helper cells, cytotoxic T cells and NK cells was observed.
The general pathway by which ribonucleases mediate cytotoxicity as cancer chemotherapeutic agents appears to consist of cell surface binding/association, internalization, endosomal escape, and cleavage of cytosolic RNA [24]. The pancreatic RNase A has been shown to interact with cell surface heparan sulfate proteoglycans, which mediate its uptake. Cancer cells are known to have altered cell-surface molecules and lipid-bilayer composition. Elevated levels of carboxylate- and sulfate-containing carbohydrates are observed frequently on cancer-cell surfaces, along with increased phosphatidylserine content in the outer leaflet of the plasma membrane. As a result, the surface of cancer cells is often more anionic than that of normal cells. This explains the high specificity of ribonucleases for cancer cells in vitro and in vivo [24,25].
Furthermore, ribonucleases exhibit a wide spectrum of antitumor potentials against cancer cells, including the catalytic cleavage of available RNA (tRNA, rRNA, mRNA, and microRNAs) with the inhibition of gene expression, modulation of the membrane calcium-dependent potassium channels and ras-oncogene functions, and the ability to resist the neutralizing action of the cytosolic RNase inhibitor [26]. On the other hand, Mironova et al. reported that RNase A did not execute direct RNA cleavage inside the cell, as it is tightly bound with the cytosolic ribonuclease inhibitor, and suggested that RNase A alters oncogenic miRNA profiling [27]. From the authors’ point of view, any of the aforementioned possible mechanisms following treatment of HCC cells with RNase A in the present study is not excluded, and the net result is a better presentation of tumor associated antigens by APCs and an exaggerated immune response.
Sorafenib is a multikinase inhibitor that blocks tumor cell proliferation and angiogenesis by inhibiting serine/threonine kinases (c-Raf and b-Raf), as well as the receptor tyrosine kinases VEGFR2, VEGFR3, platelet derived growth factor receptor (PDGFR), FLT3, Ret and c-kit [2]. Other mechanisms of action include generation of reactive oxygen species (ROS), inducing mitochondrial calcium overload and induction of apoptosis [28]. Major histocompatibility complex (MHC) class I-related chain A (MICA) is a ligand for NK group 2 member D (NKG2D) receptors expressed on a variety of immune cells. The engagement of MICA and NKG2D strongly activates NK cells, enhancing their cytolytic activity and cytokine production. In addition to membrane-bound forms, MICA molecules are cleaved proteolytically by disintegrin and metalloproteinase (ADAM) proteins from the cell surface of tumor cells and appear as soluble forms in the sera of HCC patients. Sorafenib was found to increase membrane bound MICA expression on HCC cells by downregulating ADAM9 [29]. Similarly, we assume that treatment of HCC cells with sorafenib in the present study suppressed ADAM levels and enhanced MICA expression on the surface of HCC cells with a subsequent activation of autologous NK cells (CD56+), MHC class II cells (CD3+CD4+) and matured APCs (CD86+ & CD19+), with the ultimate HCC cell death [30]. In addition, sorafenib-induced death of HepG2 cells was previously reported by Chiou et al. that was attributed to mitochondria-dependent oxidative stress mechanisms, cellular ATP depletion and mitochondrial damage [28]. These findings agree with our results, where a significant increase in LDH level was recorded following treatment of HCC cells with sorafenib, either alone or in combination with RNase A, demonstrating the cytotoxic effect of the drug.
In conclusion, treatment of HCC cells with RNase A opens a new avenue for a better presentation of autologous tumor associated antigens. Further studies are recommended to investigate the association between therapeutic efficacies of RNase enzyme systems and the potential alteration of tumor-specific miRNA expression patterns.