A Tentative Plan for the Optimum Valid Physical Fitness of Corporate Warriors - Analysis Based on Physical Fitness Data of New Recruits in a Firefighting Academy
The term “corporate warrior” has been in the Japanese imagination since the nation’s period of high economic growth. The definition of corporate warrior taken up in this study is that of people who are positive, dynamic and mentally and physically healthy, who present a bright and fresh image to those around them, and who have established a sense of personal responsibility. In short, people with greater resolve than the average person. However, there is a question as to whether their physical fitness needs to be similar to that of soldiers or athletes. They are different, however, and there may be an optimal validity physical fitness for corporate warriors. However, no such research findings have been reported. In this study, we first compared the physical composition balance and physical fitness of students and firefighters. Next, we used this to infer the optimal valid physical fitness of the corporate warriors. By examining the health management by T & F theory, we were able to clear the various tasks necessary for establishing the optimum validity physical fitness of the corporate warriors.
Keywords: Health Management; Regression Polynomial; Body Fat; BMI; T&F Theory; Physical Fitness Test; Employee
In Japan, the image of the “corporate warrior” has prevalent image since the nation’s period of economic growth. This term has been interpreted as “a company employee who performs his work with special fervor, contributing to the benefit of the company” “a salaried employee devoted to his work in the period of high growth who works with utmost exertion for the company” and “personnel who are useful to the company” [1-3]. “Corporate warrior” thus includes both the activity of dynamism and devotion and the passivity of selflessness and continuing to work to the detriment of one’s health. In recent years, however, Edington, et al. [4]. reported that the health-related cost to companies from the decline in productivity due to employees who show up to work in poor health while suffering illness or symptoms of disease is greater than that from decreased productivity due to absenteeism or from medical costs. Consequently, company employees who do not look after their own health, like those in the period of high economic growth who worked with utmost exertion for the company, increase the health-related cost for a company and decrease productivity. In addition, damage to a company employee’s health from devotion to the company and excessive mental and physical stress also implies that the individual is failing to look after his own family and household. “Health is a state of complete physical, mental and social well-being and not merely the absence of disease or infirmity” [5]. The corporate warriors we want to look at in this study, therefore, are company employees. They are thought to be people who put emphasis on fully protecting their families, who maintain a sense of ethics, and who are able to cultivate the capacity for human balance in the company. This brings forth the image of someone who is dynamic, seeks health, and tries not to cause trouble for those around them. Cultivating this kind of corporate warrior may ultimately lead to higher productivity for the company.
When thinking about the physical fitness of this kind of corporate warrior, we may ask whether it is necessary to aspire to the highlevels of physical fitness of athletes and soldiers. According to the World Health Organization (WHO), lack of exercise is one of the major risk factors for death worldwide, and moderate physical exercise of at least 150 minutes per week or intense physical exercise of at least 75 minutes per week is recommended for people aged 18 to 64 years [6]. The WHO defines physical exercise as all muscular activity that occurs in daily life, and considers it a sufficient condition for health. In other words, health can be maintained with an active daily life. The Japanese Ministry of Health, Labour and Welfare is promoting “Healthy Japan 21 (2nd term).” Among the goals for physical activity is to raise the percentage of people who exercise regularly [7].
When people desire physical fitness, a pattern of daily living activities suited to the purposes of the individual are needed; the physical fitness of a soldier certainly does not need to be sought.
Therefore, what is physical fitness suited to a pattern of daily living activities corresponding to the individual? In fact, there is little knowledge of physical fitness viewed in this way in Japan. Therefore, Hayakawa, et al. introduced the concept of optimum valid health and physical fitness [8-10]. In other words, it is important to maintain health and physical fitness commensurate with an individual’s pattern of daily living activities. They investigated optimum valid health and physical fitness from the morphological quality balance of body fat percentage versus body mass index (BMI) in science and engineering students and art students. In this study, we took a further step forward and investigated the optimum valid physical fitness of firefighters who were new recruits in a firefighting academy by comparing the physical fitness of male university students and firefighter recruits in order to investigate the optimum health and physical fitness of corporate warriors. Based on these findings, the issues that need to be dealt with in establishing the optimum valid health and physical fitness of corporate warriors are examined from the perspective of health management.
The subjects were male university students (Students) and male firefighters in a firefighting academy (Firefighters). Ito, et al. reported that firefighters have a higher level of physical strength than the average person [11]. The firefighters in the firefighting academy lived communally for six months of the year during which they followed a prescribed pattern of daily living activities. Height, weight, and body fat percentage were measured using a TANITA MS-190 (body composition analyzer: Tanita Corp. in Japan) as measures of physique and body composition. Body mass index (BMI) was calculated by dividing weight (kg) by the square of height (m). Grip strength, sit-ups, sit-and-reach, side steps, 20-m shuttle run, and standing long jump were measured as items of physical fitness (Table 1). The method of measuring physical fitness tests are as follows. Physical strength was measured in accordance with the new physical fitness test of the Ministry of Education, Culture, Sports, Science and Technology [12]. The subjects for analysis were 1,050 Students and 97 Firefighters for whom all data were collected. Measurement was conducted in February 2017 (Table 2).
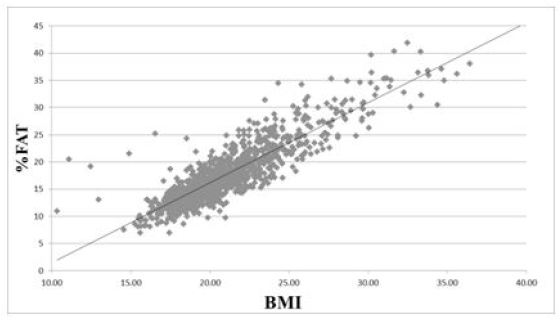
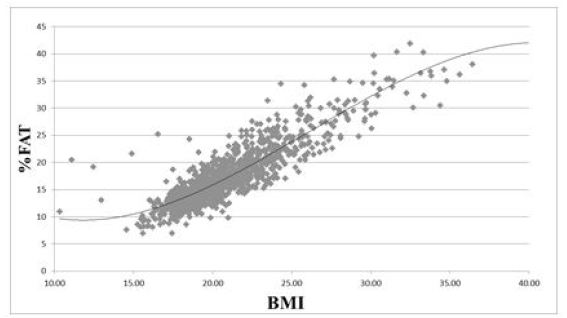
(1) A least squares approximation polynomial for body fat percentage against BMI was used for the Students and 1st to 3rd order regression polynomials were derived. With regression polynomials, a regression line is generally applied by regression analysis with two variables. Matsuura & Kim investigated a method to determine the validity of a least squares approximation polynomial from the residual sum of squares [13]. We then applied first to third order polynomials. That followed the second or third order reported in previous studies by Fujii and Tanaka, et al. [14,15]. In addition, Hayakawa et al. previously investigated physical composition balance with the same method [8-10].
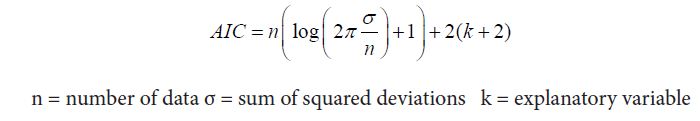
(2) An investigation was then done with the coefficient of determination (R2) and the residual sum of squares (RSS). The validity of the order was judged from the results of the Akaike Information Criterion (AIC). The AIC calculation formula is as follows. Statistical analysis used Microsoft Excel 2016.
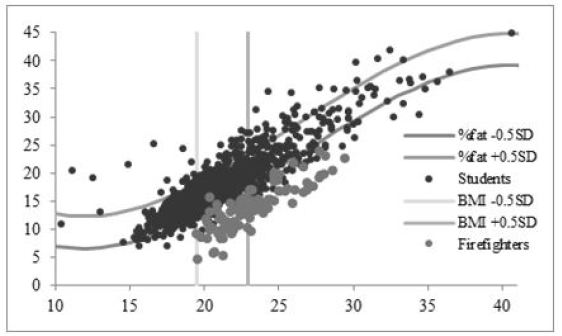
(3) An evaluation chart was constructed using the regression polynomial judged to be valid. The evaluation method took that.
Less than the mean −0.5 SD “underdevelopment of fat”
Mean –0.5 SD to less than mean +0.5 SD “standard development of fat”
Mean +0.5 SD or greater “excessive development of fat”
BMI was also divided into 3 levels based on the mean.
Less than mean −0.5 SD “lean”
Mean –0.5 SD to less than mean +0.5 SD “average”
Mean +0.5 SD or greater “obese”
These classifications were then arranged into 9 groups. For example, the combination of “underdevelopment of fat” and “lean” was taken to be the “lean, underdeveloped fat” group.
(4) Next, the Firefighters’ data were put into the evaluation chart, and the frequency distribution in the 9 groups of Students and Firefighters was investigated. In addition, physical fitness was compared by conducting t-tests with the Students and Firefighters for the physical fitness items. The optimum valid physical fitness of firefighters was investigated by conducting independent t-tests for those in the same groups among the Students and Firefighters. The level of statistical significance in this study was taken to be <5%.
After confirming the validity of the order of the regression polynomials of body fat percentage against BMI in Students, the orders were as follows.
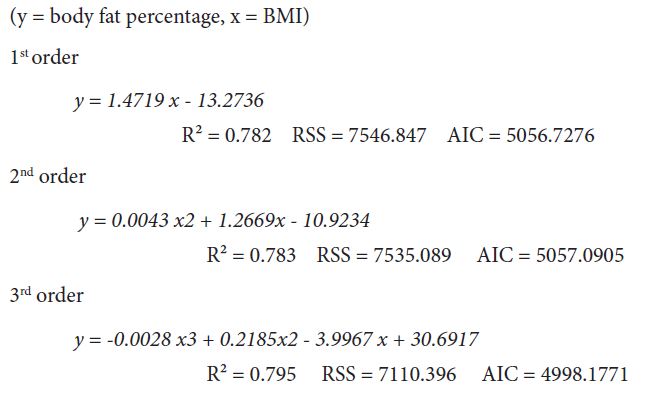
From the above results, the 3rd order was judged to be valid in a comprehensive assessment. Next, an evaluation chart was constructed based on the 3rd order regression polynomial (Figure 1,2,and 3)
Next, the Firefighters’ data were put into the constructed evaluation chart and the frequency distribution was investigated. The results showed that in Students the “average, standard developed fat” group was the largest at 34.5% (362 people), followed by the “lean, standard developed fat” group at 29.1% (306 people).
Moreover “obese, standard of fat” group was 13.8% (145 people). The other groups had rates of 2-5%. For the Firefighters, the “average, underdeveloped fat” group accounted for 49.5% (48 people) and the “obese, underdeveloped fat” group accounted for 47.4%. The “average, standard developed fat” group was 2% (2 people), and “lean, underdeveloped fat” was 1% (1 person). There were none in all other groups (Table 3).
A comparison of physical fitness in the Students and Firefighters revealed significant differences in all measure, with the Firefighters having significantly higher physical fitness values. Especially in the 20-m shuttle run, they were higher than the Students were and in sit-ups they were higher than the Students. In all other measures, they were somewhat higher (Table 4).
Since the “average, underdevelopment of fat” and “obese, underdevelopment of fat” groups included 95% (94 of 97) of Firefighters in the results of the analysis by frequency distribution, a comparison was made between the data for these two groups together and the data for the same two groups of Students together. The results showed that the Firefighters had significantly higher values for sit-ups, 20-m shuttle run, standing long jump, and sit-and-reach. Similar to the overall comparison, the values for the 20-m shuttle run and sit-ups were higher than those for the Students, while the other measures were somewhat higher (Table 5).
This study showed for the first time that the distribution according to the morphological quality balance of Firefighters is shifted to the right compared with Students. This means that the amount of body fat is small and the amount of muscle is large for the physique. Physical fitness in Firefighters also had significantly higher values in all measures. The morphological quality balance of Firefighters consists almost entirely of the “average, underdeveloped body fat” and “obese, underdeveloped body fat” groups, and so a comparison of the two groups combined was made. The results showed that except for grip strength and side steps, the values were significantly higher than in the Students for all measures.
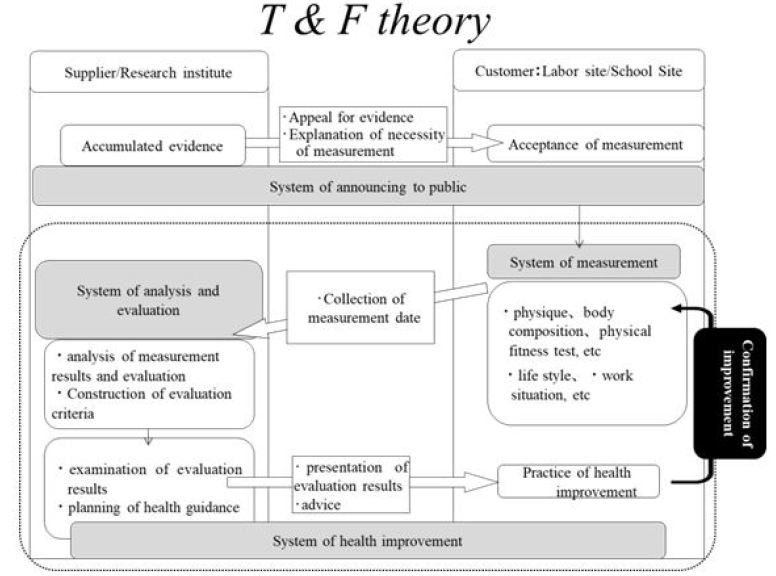
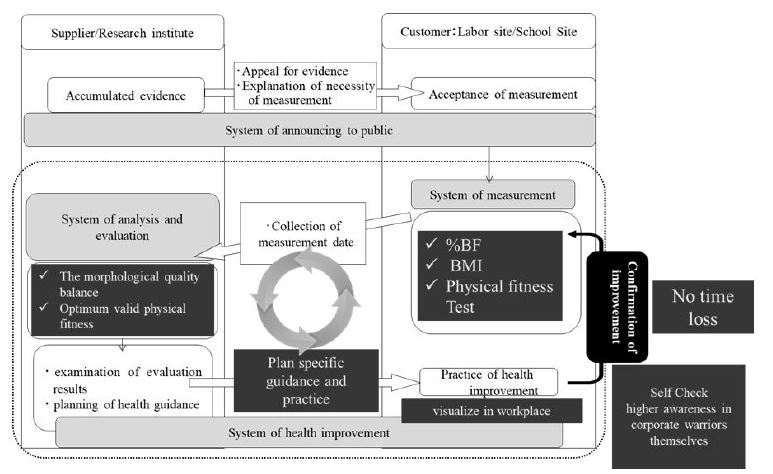
The T & F theory is a feedback system that seeks to maintain and improve effective health for business people and others by making use of the idea aimed at efficiency and optimization of the logistics strategy theory.
The values were higher especially for the 20-m shuttle run, which shows whole-body endurance, and sit-ups, which show muscle endurance. This indicates that the optimum valid physical fitness for Firefighters is characterized by markedly higher whole-body endurance and trunk muscle endurance compared with Students, and somewhat higher levels for all other measures.
However, unlike company employees, firefighters are a group with pattern of daily living activities that requires physical fitness. As mentioned in the introduction, the optimum valid physical fitness for company employees, or corporate warriors, is the physical fitness for active daily living that is necessary for health. Their physical fitness is not as necessary as firefighters. In this study, however, it was shown that groups that require physical fitness have particularly high whole-body endurance and trunk muscle endurance. Whole-body endurance is related to the lifestyle-related diseases, and trunk muscle endurance is related to the maintenance of posture and prevention of low back pain [16,17 ]. The especially high values in these two measures, in addition to the above-mentioned preventive effects, are thought to underly the basic physical fitness for activities in groups with patterns of daily life activities that require physical fitness. The optimum valid physical fitness for corporate warriors, then, may be conjectured to be characterized by greater whole-body endurance and trunk muscle endurance than the general population, and perhaps somewhat higher levels in other measures of physical fitness. Hayakawa, et al. reported that muscle endurance and whole-body endurance in the “average, underdeveloped body fat” and “obese, underdeveloped body fat” groups are higher than in the “average, standard development of body fat” group in the general population, and proposed that “average, underdeveloped body fat” and “average, standard development of body fat” be positioned in lifestyle-related diseases prevention [18]. Considering these findings, when investigating the morphological quality balance in corporate warriors a rightward shift from the general population toward “average, standard development of body fat/average, underdevelopment of body fat/obese, underdevelopment of body fat” may be valid. It is also thought to be necessary for corporate warriors to maintain this morphological quality balance and acquire the optimum valid physical fitness for them.
When making efforts for health management in corporate warriors, it may be that the optimum valid physical fitness can be managed smoothly by applying the T&F theory shown in the following (Figure 5).
The T&F theory is a theory proposed by Tanaka and Fujii [19,20]. The T&F theory is a feedback system that attempts to efficiently maintain and improve health for not only businesspeople but for people in various different fields, applying the thinking at the core of logistics strategy that aims to increase the efficiency of and optimize distribution strategy. Body fat percentage, BMI, and physical strength are used as measures. Next, in the analysis and assessment system, it becomes possible to plan specific guidance in the health improvement system and practice health improvements by taking the morphological quality balance and optimum valid physical fitness for corporate warriors in this study to create assessment criteria (Figure 4).
In the “Policy for health maintenance and promotion of workers in the workplace” which summarizes the principle implementation methods for health maintenance and promotion measures, active implementation in businesses and worker self-help efforts are considered to be necessary [21]. Since it is possible to visualize the morphological quality balance and optimum valid physical fitness in workplaces, the time loss in “confirming improvement” from implementation of a health improvement system to the next measurement system is almost none, and improvements can be checked easily during the day. Methods adopted to raise the health awareness of corporate warriors in offices, as stated by Uchino, are directive, command-like, and high pressure, and in some cases, good relationships cannot be built [22]. However, assessments based on morphological quality balance and optimum valid physical fitness can facilitate corporate warriors themselves in noticing physical changes, and approaches to individuals, such as confirmation and improvement, become powerful. Therefore, such assessments have the advantages of being able to evoke higher awareness in corporate warriors themselves, who tend to overlook their health, and are effective in health management. In this study, we were able to validate for the first time the strategy of corporate warrior’s health management by optimal valid physical fitness.