Age Determination of Barbus Arabicus (Trewavas,1941) in Saudi Arabia Using the Vertebral Bones
Barbus arabicus is an endemic freshwater fish of the Arabian Peninsula. The present study investigated the B. arabicus age using vertebral growth rings as a means of age determination. A total of 305 specimens were collected from the Baish dam reservoir, Jazan region of Saudi Arabia with hooks and lines for one year. The reliability study of the vertebrae showed an annual ring formation where the back-calculated lengths of the vertebral rings showed values that coincided with the annual growth of this fish. The maximum age of B. arabicus in this study was found to be 7 years. The mean values of the back-calculated lengths of ring-I to ring-VII were found in the range between 5.76±0.77 cm and 52.67±2.28 cm, respectively. The predicted equation of bone radii was measured from the fish length and the back-calculated lengths showed a very high Correlation coefficient (r>0.99) which is statistically significant (p<0.001). As a result, the vertebral rings were found to be useful ageing structures for B. arabicus. The results of this study will help in planning for the rational exploitation of B. arabicus and for their management and conservation in Saudi Arabia. However, additional research can offer important benefits if different methods of age determination of B. arabicus are used, especially the use of fin spines because this method will not sacrifice the fish. In addition, these studies will emphasize the present findings.
Keywords: Barbus Arabicus; Age; Growth; Vertebral Bone; Back Calculation
Growth in weight and length of the fish over a period of time have been studied in several species of fishes [1]. The information on age, growth, mortality and exploitation rates is crucial for the fish stock assessment [2]. Several authors have used different hard structures for age determination in different fish species [3-5]. The use of vertebral rings as a means of age determination has been reported in various studies [6-11]. Other studies also demonstrated the use of opercular bones in their investigation [12-15]. Otoliths were used by Jia Y, 2011 and Espino-Barr E, 2013 [16,17].
Environmental changes of freshwater streams in the Arabian peninsula occur as a result of natural draught, damping, pesticides and sanitary wastes. Environmental changes have negative effects on fish species and their existence. Biological studies such as age and growth rate of B. arabicus might be a necessity because they are highly needed for the models of population dynamics that used in the stock assessment for this fish. Fish stock assessments can form the bases of fish conservation studies. Vertebrae and fin spines have been used in determining the age of fish species but different authors have indicated that the use of the spines of the dorsal and anal-fins are more reasonable in terms of the ease of collection and processing [18-26]. Back-calculation methods have been used by a large number of authors, and are used here to confirm or dispute the annularity of the growth rings on the bony structures of this fish species. The back-calculation technique is specificly useful for determining the growth of the fish during each year of life before date of sampling. Back calculations of length at age were estimated in two ways [27-30].
Very little is known about B. arabicus in the southern part of the Arabian Peninsula, and there is lack of information about their biology, age and growth and their economic aspects. It is difficult to study the age of tropical fishes as the ring formation on hard structures do not depend on temperature in the case of temperate water fish, but their ring formation largely depends on other biological and physiological factors such as food availability and breeding seasons [31]. Thus, unless annual nature of these growth rings are established for these fishes, their age study is doubtful [12, 32-34]. So, the objectives of this study was to estimate the age and growth of a freshwater fish (B. arabicus) by counting the growth rings on the vertebrae. In this work, the method of growth rings on the vertebral bones was tried to determin the age of B. arabicus in Baish dam in Saudi Arabia.
A total of 305 B. arabicus fishes were collected from Baish dam reservoir (17˚39′58.00″N 42˚ 39′27.22″E) during January to December in order to represent all seasons of the year. Baish dam is constructed on Baish vally at Jizan region of southwestern Saudi Arabia. It is a gravity dam constructed for flood control, irrigation and groundwater recharge. The highet, length and wedith of the dam are 74, 340 and 79.5 meters respectively. The total capacity of the reservoir is 192,750,000 m3 and surface area is 8km2. The fish species, stock assessment and fish production and exploitation were not yet established Baish dam. In this study we were tried to start the first step of studing the fish of this important freshwater body. All specimens were caught with hook and line. Standard length (SL), Vertebrae radius (VR), and measurements of the total lengths (TL) were taken to the nearest millimeter (mm) and the weights of the fishes were calculated to the nearest gram. The total fish length was correlated with the standard length in order to choose either of the lengths for this study. Three vertebrae from the front part of the fish were removed, cleaned and soaked in a 5% sodium hypochlorite solution. The soaking time ranged from 5 minutes to 1 hour depending on the size of the vertebrae and followed by soaking them in distilled water for 30 to 45 minutes [35-37]. Then, the specimens were stored for 1-2 weeks before being examined under the binocular microscope. Alizarin red has been used to enhance the visibility of growth rings [38-40]. The radius was measured from the focus of the vertebra to its outermost edge along a definite axis. Proportionality between the structure and fish size was verified through relationships between the vertebral radius (cm) and the total length of the fish (cm). In this study, a modified version of back-calculation of a direct proportional formula was used [41,42]. Statistical analysis of linear regression analysis and t-test were used. P values less than 0.05 were considered as statistically significant.
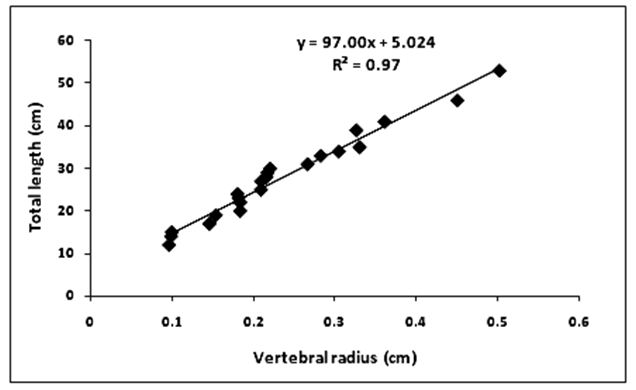
The number of Barbus arabicus that caught from the reservoir of Baish dam and brought to the lab for this study were shown on mothely basis in (Table 1). Standard and total lengths of B. arabicus showed highly significant (p<0.001) correlation coefficient value (r>0.99) when correlated with each other.. This correlation suggests that each of them can be used to study the age of B. arabicus. The relationship between the radius of the vertebral bone and the total length of B. arabicus was described by a the analysis of the linear regression and correlation coefficient was found to be highly significant (p<0.001) (r >0.97), (Figure 1). The back-calculation of mean radii of the vertebral bones with the standard deviation and the coefficient of variation were shown in (Table 2) From this relationship; the equation is written for B. arabicus as follows:
L = 3.6742 + 0.9503Rv. (1)
where L = Total length of the fish; Rv = Radius of the vertebral bone.
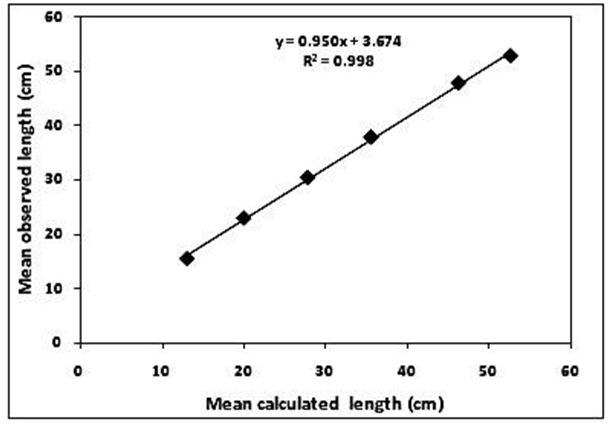
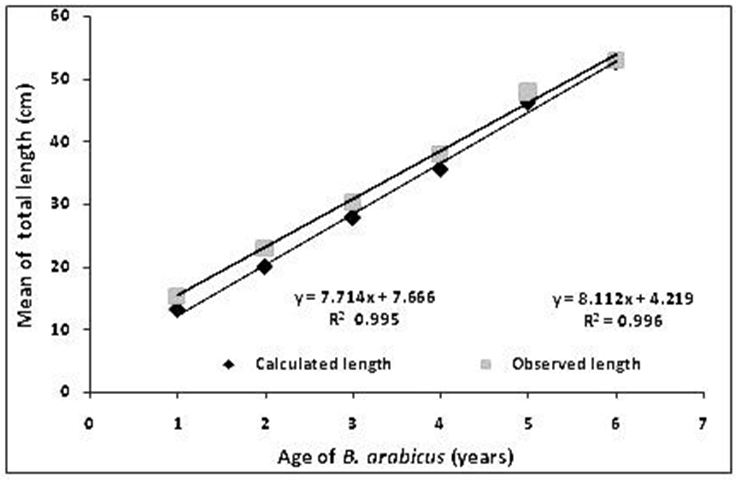
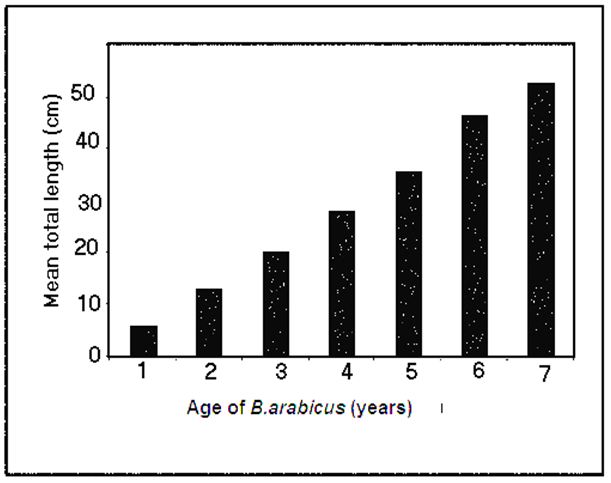
The relationship between mean observed and back-calculated lengths of B. arabicus showed highly significant (p<0.001) correlation coefficient (r=0.99) (Figure 2). The age of B. arabicus with the mean values of total length are shown in a histogram in Fig.3. On the other hand, the observed and back-calculated lengths of B. arabicus showed almost similar values when correlated with the determined age of the fish of (r>0.99) (p<0.01) (Figure 3).
The equation of back-calculation is written as follows:

where Ln: the length of the fish at time of the formation of the annulus n; L: the length of the fish at capture time; a: intercept on length axis from linear regression of length on the vertebral radius; Sn: space from vertebral focus to annulus n; S: vertebral radius.
The back- calculated lengths (mean±sd) for the vertebral bones rings for B. arabicus were between (5.76±0.77 cm and 52.76±2.28 cm), respectively (Figure 4). For all specimens of B. arabicus, the coefficient of variation never exceeded 13.4%.
In this study, attempts were made to use the vertebral bone method for the age determination of B. arabicus. The growth rings of the vertebral bones were used for the first time in Saudi Arabia to estimate the growth rates of B. arabicus. The reliability study of the vertebral bone rings showed that vertebral bones are reliable for ageing B. arabicus dwelling in Baish dam of Saudi Arabia because of their annual formation of growth rings. Although growth rings formed on the hard structures of tropical fishes are not necessarily formed annually, but in this study, the back-calculated lengths of the first vertebral ring and other rings showed values that coincided with the annual growth with a clear annularity of ring formation on the vertebral bones. Ring formation on the vertebrae of B. arabicus may possibly have occurred as a result of breeding of the fish. The result of this study is in agreement with a similar study by where they studied the reliability of vertebral bones as aging structures for two tropical fish species. Studies using hard structures such as vertebrae, otoliths, other bones, thorns and spines, have been tried and often proved appropriate and accurate [43]. These structures are prepared for age determination in ways that enhance the readability of the present growth rings [40]. In this study, reliability of vertebral bones as ageing structures was clearly shown from the high correlation coefficients between observed and back-calculation lengths (r>0.99) and the high coefficient of variation CV as shown in the result.The back-calculation method was used by many authors to compare growth between observed and calculated methods of fish age The results of marginal increment analysis of this study indicated that growth rings for fish of 1 to 7 years of age were laid annually [44-46]. The maximum age of B. arabicus in Baish dam was found to be 7 years in this study. A high correlation coefficient was found between standard and total lengths (r>0.99) and (p<0.01) which indicate that either of the two parameters can be used in the study of age determination of B. arabicus.
Some authors including used size frequency distribution method for age determination of many fishes, but this method can’t be used in this study because we have used the method of hooks and lines for catching the fish [47]. This method is more selective and excluded smaller fishes, due to difficulties of using the nets in the area, because of the presence of rocks and tree branches in the water. The hooks and lines are relatively selective and size-wise which may give biased results. suggested that vertebral and opercular bones may underestimate the fish age after 8 years due to ring overlapping and only otolith could be used at this age because of its validation for many fish species [38]. Findings from this study indicated that vertebral bones are useful as ageing structures of B. arabicus in Saudi Arabia.
It can thus be concluded that the vertebral bones of B. arabicus have been proven to be a suitable ageing structure with high reliability for ageing B. arabicus in Saudi Arabia. Other methods can also be tried for confirmation of the vertebral method.