Ageing Associated Changes in Macromolecule Synthesis in the Endocrine Organs as Revealed by Microscopic Radioautography
The endocrine system of men and experimental animals consists of several endocrine organs. The term “Cell Ageing” initially means how the cells change due to their ageing. It contains 2 meanings, one how a cell changes when it is isolated from original animals or plants such as in vitro cells in cell culture, while the other means how all the cells of an animal or a plant changes in vivo due to the ageing of the individual animal or plant. I have been studying the latter changes from the viewpoint of the cell nutrients, the precursors for the macromolecular synthesis such as DNA, RNA, proteins, glucides and lipids, which are incorporated and synthesized into various cells of individual animals. Therefore, this article deals with only the cell ageing of animal cells in vivo, how the metabolism, i.e., incorporations and syntheses of respective nutrient precursors in various kinds of cells change due to the ageing of individual experimental animals such as mice and rats by means of microscopic radioautography to localize the RI-labeled precursors. The incorporations and syntheses of various precursors for macromolecules such as DNA, RNA, proteins, glucides, lipids and others in various kinds of cells of various organ in endocrine system are reviewed referring many original papers already published from our laboratory during these 50 years since the late 20C to the early 21C.
Keywords: Endocrine Organs; Microscopic Radioautography; Cell Ageing; DNA Synthesis
The endocrine systems of men and experimental animals such as rat and mouse consist of several endocrine organs such as the thyroid, thymus, adrenal, pancreas, testis or ovary. The term “Cell Ageing” initially means how the cells change due to their ageing. It contains 2 meanings, one how a cell changes when it is isolated from in vivo original animals or plants such as in vitro cells in cell culture, while the other means how all the cells of an animal or a plant change in vivo due to the ageing of the individual animal or plant. I had first studied the meaning of cell ageing many years ago (more than 50 years) how a cell changed when it was isolated from original experimental animals such as mice and rats by cell culture [1-3], and then moved to the study on the latter cell ageing, i.e., how all the cells of an experimental animal change in vivo due to the ageing of the individual prenatal and postnatal animal [4-8].
Recently, I have been studying the ageing changes from the viewpoint of the cell nutrients those were incorporated and synthesized into various cells in individual animals during their ageing [9]. Therefore, this article deals with only the cell ageing of animal cells in vivo, how the metabolism, i.e., incorporations and syntheses of respective nutrients, the macromolecular precursors, in various kinds of cells change due to the ageing of individual experimental animals such as mice and rats by means of microscopic radioautography. The incorporations and syntheses of various nutrients such as DNA, RNA, proteins, glucides, lipids and others in various kinds of cells of endocrine systems such as thyroid, thymus, adrenal gland, pancreatic islet cells or reproductive cells should be reviewed referring many original papers already published from our laboratory.
In order to observe the localizations of the incorporations and syntheses of various nutrients synthesizing macromolecules in the bodies such as DNA, RNA, proteins, glucides and lipids in various kinds of cells of various organ in respective organ systems such as skeletal, muscular, circulatory, digestive, respiratory, urinary, reproductive, endocrine, nervous and sensory systems, we employed the specific techniques developed in our laboratory during these 60 years [10]. The technique is designated as radioautography using RI-labeled compounds. To demonstrate the localizations of macromolecular synthesis by using such RI-labeled precursors as 3H-thymidine for DNA, 3H-uridine for RNA, 3H-leucine for protein, 3H-glucosamine or 35SO4 for glucides and 3H-glycerol for lipids are divided into macroscopic radioautography and microscopic radioautography. The techniques employ both the physical techniques using RI-labeled compounds and the histochemical techniques treating tissue sections by coating sections containing RI-labeled precursors with photographic emulsions and processing for exposure and development. Such techniques can demonstrate both the soluble compounds diffusible in the cells and tissues and the insoluble compounds bound to the macromolecules [11]. As the results, specimens prepared for electron microscopic radioautography (EM RAG) consist of specimen sections, radioautographic emulsions and carbon coating, as the results they are very thick and should be observed with high voltage electron microscopes at 1000-2000kV in order to obtain better transmittance and resolution [12-13]. Such radioautographic techniques in details should be referred to other literature [10]. On the other hand, the systematic results obtained by radioautography should be designated as radioauographology, or science of radioautography [14-16]. This article deals with the results dealing with the morphological radioautographic changes those observed in the individual cell in radioautographs by ageing of the individual animals that should be included in radioautographology.
The human bodies as well as the bodies of any experimental animals such as mice and rats consist of various macromolecules. They are classified into nucleic acids (both DNA and RNA), proteins, glucides and lipids, according to their chemical structures. These macromolecules can be demonstrated by specific histochemical staining for respective molecules such as Feulgen reaction [17] those stain all DNA contained in the cells. Each compounds of macromolecules such as DNA, RNA, proteins, glucides, lipids can be demonstrated by respective specific histochemical stainings [18] and such reactions can be quantified by microscpectrophotometry using specific wave-length demonstrating the total amount of respective compounds [19]. To the contrary, radioautography can only demonstrate the newly synthesized macromolecules such as synthetic DNA or RNA or proteins depending upon the RI-labeled precursors incorporated specifically into these macromolecules such as 3H-thymidine into DNA or 3H-uridine into RNA or 3H-amino acids into proteins [10].
Concerning to the newly synthesized macromolecules, the results of recent studies in our laboratory by the present author and co-workers should be reviewed in this article according to the classification of macromolecules as follows.
The DNA (deoxyribonucleic acid) contained in cells can be demonstrated either by morphological histochemical techniques staining tissue sections such as Feulgen reaction or by biochemical techniques homogenizing tissues and cells. To the contrary, the synthetic DNA or newly synthesized DNA but not all the DNA can be demonstrated either by morphological or histochemical techniques or by staining of the tissue sections detected as macromolecular synthesis together with other macromolecules such as RNA or proteins in various organs of experimental animals by either morphological or biochemical procedures employing RI-labeled precursors. We have studied the sites of macromolecular synthesis in almost all the organs of mice during their ageing from prenatal to postnatal development to senescence by means of microscopic radioautography, one of the morphological methods [20-28]. The results should be here described according to the order of organ systems in anatomy or histology.
The endocrine system of mammals consists of the hypophysis, pineal body, thyroid, parathyroid, thymus, adrenal, pancreatic islet and genital glands. Among those organs, we studied macromolecular synthesis in the thyroid, adrenal and steroid secreting cells of both sexes, the Leydig cells of the testis and the ovarian follicular cells in mice. On the other hand, incorporations of mercury chloride into human thyroid tissues as well as the intracellular localization of protein kinase C and keratin and vimentin were also studied [10].
The DNA Synthesis in the Thyroid Gland: We first studied incorporations of mercury chloride into human thyroid tissues of both normal and cancer cells obtained from human patients [21-23,29-32]. The tissues were obtained surgically from human patients of both sexes in various ages suffering from the cancer of thyroids and the both normal and cancer cells were cut into small pieces (3x3 mm) aseptically which were incubated in a medium (Eagle’s MEM) containing RI-mercury chloride (203HgCl2) and fixed either cryo-fixation at -196 OC and freeze-dried or chemically fixed with buffered glutaraldehyde and osmium tetroxide at 20 OC. The former tissue blocks were processed for dry-mounting radioautography, while the latter were processed for conventional wet-mounting radioautography. The results revealed that the silver grains appeared much more in the cancer cells processed for freeze-fixation and dry-mounting radioatuography than the cancer cells processed for chemical fixation and wet-mounting radioatuography, as well as much more in the cancer cells than the normal cells under the same conditions. On the other hand, PCNA/cycline and both keratin kinase C and vimentin were immunostained in connection to DNA synthetic activity. It was found that PCNA/cycline, keratin kinase C and vimentin antibodies were localized around the filaments in the thyroid cancer cells, demonstrating the relation between those antigens and DNA synthetic activity in cell cycle [21,22,33,34].
The DNA Synthesis in the Adrenal Gland: We studied the adrenal tissues of ageing mice, both the adrenal cortex and the medulla, from embryo to postnatal 2 years. Some of the results were already published in several original articles [35-53].
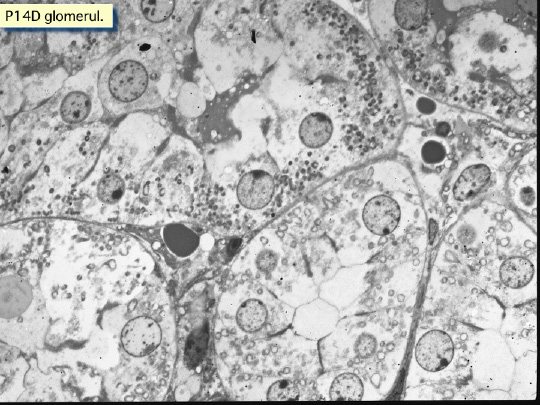
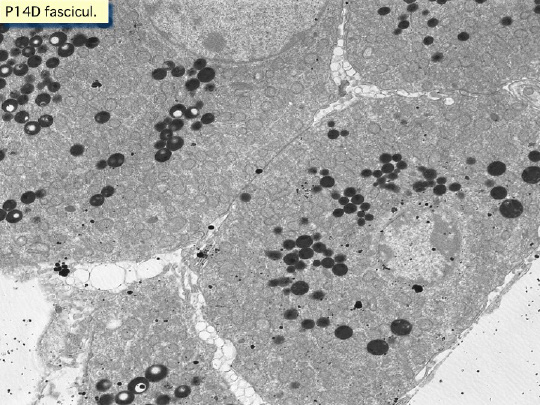
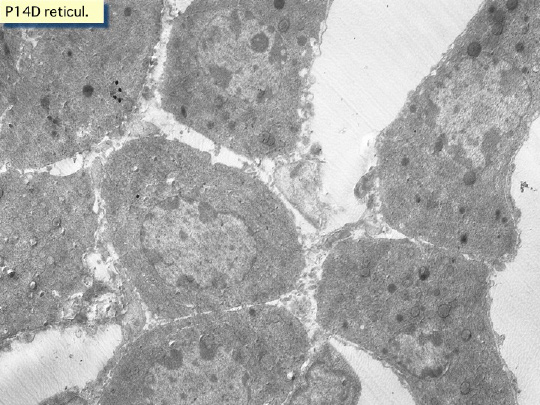
Structure of Ageing Mouse Adreno-Cortical Cells: We studied the adrenal tissues of mice at various ages from embryo to postnatal 2 years [35,36,42-51]. The adrenal tissues obtained from ddY strain mice at various ages from embryo day 19 to postnatal day 30 of both sexes, consisted of the adrenal cortex and the adrenal medulla. The former consisted of 3 layers, zona glomerulosa, zona fasciculata and zona reticularis, developing gradually with ageing as observed by light microscopy (Figure 1 and 2). At embryonic day 19 and postnatal day 1, the 3 layers of the adreno-cortical cells, zona glomerulosa, zona fasciculate and zona reticularis were composed mainly of polygonal cells, while the specific orientation of the 3 layers was not yet well established. At postnatal day 3, orientation of 3 layers, especially the zona glomerulosa became evident. At postnatal day 9 and 14, the specific structure of the 3 layers was completely formed and the arrangements of the cells in respective layers became typical especially at day 14 and month 1 to 24. Observing the ultrastructure of the adreno-cortical cells by electron microscopy, cell organelles including mitochondria were not so well developed at perinatal and early postnatal stages from embryonic day 19 to postnatal day 9. However, these cell organelles, mitochondria, endoplasmic reticulum, Golgi apparatus, appeared well developed similarly to the adult stages at postnatal day 14. The zona glomerulosa is the thinnest layer found at the outer zone, covered by the capsule, consisted of closely packed groups of columnar or pyramidal cells forming arcades of cell columns. The cells contained many spherical mitochondria and well developed smooth surfaced endoplasmic reticulum but a compact Golgi apparatus in day 14 animals. The zona fasciculate was the thickest layer, consisted of polygonal cells that were larger than the glomerulosa cells, arranged in long cords disposed radially to the medulla containing many lipid droplets. The mitochondria were less numerous and were more variable in size and shape than those of the glomerulosa cells, while the smooth surfaced endoplasmic reticulum were more developed and the Golgi apparatus was larger than the glomerulosa. In the zona reticularis, the parallel arrangement of cell cords were anastomosed showing networks continued to the medullar cells. The mitochondria were less numerous and were more variable in size and shape than those of the glomerulosa cells like the fasciculata cells, as well as the smooth surfaced endoplasmic reticulum were developed and the Golgi apparatus was large like the fasciculata cells. However, the structure of the adrenal cortex tissues showed changes due to development and ageing at respective developmental stages.
The DNA Synthesis in the Adreno-Cortical Cells: Both LM and EM RAG were employed for demonstrating DNA synthesis using labeled 3H-thymidine. The silver grains were found over the nuclei of some adreno-cortical cells in S-phase of cell cycle mainly in perinatal stages at embryonic day 19, postnatal day 1 and day 3, while less at day 9 and day 14 to month 1-24 [35,36,42-46]. The labeled cells were found in all the 3 layers the zona glomerulosa the zona fasciculata and the zona reticularis, at respective ageing stages. In labeled adreno-cortical cells in the 3 layers the silver grains were mainly localized over the euchromatin of the nuclei and only a few or several silver grains were found over the mitochondria of these cells as observed by EM RAG (Figure 1). To the contrary, most adreno-cortical cells were not labeled with any silver grains in their nuclei nor cytoplasm, showing no DNA synthesis after labeling with 3H-thymidine. Among many unlabeled adreno-cortical cells, however, most cells in the 3 layers were observed to be labeled with several silver grains over their mitochondria due to the incorporations of 3H-thymidine especially at the perinatal stages from embryonic day 19 to postnatal day 1, day 3, day 9 and 14 (Figure 1). The ultrastructural localizations of silver grains over the mitochondria were mainly on the mitochondrial matrices and some over the cristae or membranes.
Number of Mitochondria of Ageing Mouse Adreno-Cortical Cells: Preliminary quantitative analysis on the number of mitochondria in 10 adreno-cortical cells whose nuclei were labeled with silver grains and other 10 cells whose nuclei were not labeled in each aging group revealed that there was no significant difference between the number of mitochondria and the labeling indices (P<0.01). Thus, the number of mitochondria and the labeling indices were later calculated regardless whether their nuclei were labeled or not [35,36,42-46]. The results obtained from the number of mitochondria in adreno-cortical cells in the 3 layers of respective animals in 10 ageing groups at perinatal stages, prenatal embryo day 19, postnatal day 1, 3, 9 and 14, showed gradual increase from the prenatal day 19 (glomerulosa 12.5, fasciculata 14.9, reticularis 15/2/cell) to postnatal day 14 and month 1 and 2 (glomerulosa 62.2, fasciculata 64.0, reticularis 68.2/cell). The increase from embryo day 19 to postnatal month 2 was stochastically significant (P<0.01). Then, they did not change significantly to month 12 and 24 (Figure 2).
Mitochondrial DNA Synthesis of Ageing Mouse Adreno-Cortical Cells: The results of visual grain counts on the number of mitochondria labeled with silver grains obtained from 10 adreno-cortical cells in the 3 layers of each animal labeled with 3H-thymidine demonstrating DNA synthesis in 10 ageing groups at perinatal stages, prenatal embryo day 19, postnatal day 1, 3, 9 and 14, and month 1, 2, 6, 12 and 24 were reported previously [35,36,42-46]. The results demonstrated that the numbers of labeled mitochondria with 3H-thymidine showing DNA synthesis gradually increased from prenatal embryo day 19 (glomerulosa 0.3, fasciculata 0.5, reticularis 0.4/cell) to postnatal day 14, month 1 and 2 (glomerulosa 5.3, fasciculata 5.0, reticularis 6.2/cell), reaching the maximum, then decreased to month 6, 12 and 24 (Figure 2). The increase and decrease were stochastically significant (P<0.01).
The Labeling Index of DNA Synthesis in Mouse Adreno-Cortical Mitochondria: On the other hand, the labeling indices in respective aging stages were calculated from the number of labeled mitochondria, dividing by the number of total mitochondria per cell which were mentioned previously [35,36,42,43-46,51,54]. The results showed that the labeling indices gradually increased from prenatal day 19 (glomerulosa 2.4, fasciculata 2.7, reticularis 2.6%) to postnatal day 14, month 1 and 2 (glomerulosa 8.5, fasciculata 7.8, reticularis 8.8%), reaching the maximum and decreased to month 6 (glomerulosa 4.1, fasciculata 4.2, reticularis 3.8%), 12 and 24 (Figure 2). The increase and decrease were stochastically significant (P<0.01) (Figure 3).
Structure of Ageing Mouse Adreno-Medullary Cells: We studied the adrenal tissues of mice at various ages from embryo to postnatal 2 years. The adrenal tissues obtained from ddY strain mice at various ages from embryo day 19 to postnatal day 30 of both sexes, consisted of the adrenal cortex and the adrenal medulla [35,36,42-46,48,54-57]. The former consited of 3 layers, zona glomerulosa, zona fasciculata and zona reticularis, developing gradually with aging as observed by light microscopy (Figure 1), while the latter consisted of 2 cell types in one layer when observed by electron microscopy [44-46,54-57]. At embryonic day 19 and postnatal day 1, the 3 layers of the adreno-cortical cells, zona glomerulosa, zona fasciculate and zona reticularis were composed mainly of polygonal cells, while the specific orientation of the 3 layers was not yet well established. However, the orientation of 3 layers became evident at day 3 and completely formed at day 14 and to month 1-24 (Figure 1). On the other hand, the medulla consisted of only one layer containing 2 types of cells, adrenalin cell and noradrenalin cell. The former contains adrenalin granules with low electron density, while the latter contains noradrenalin granules with high electron density.
The DNA Synthesis in the Adreno-Medullary Cells: The adrenal medulla is the deepest layer in the adrenal glands, surrounded by the 3 layers of the adrenal cortex as observed by light and electron microscopy [35,36,42-46,55-57], containing either adrenalin granules or noradrenalin granules. Quantitative analysis revealed that the numbers of mitochondria in both adrenalin and noradrenalin cells at various ages increased from fetal day 19 to postnatal month 1 due to ageing of animals, respectively, but did not decrease to month 24, while the number of labeled mitochondria and the labeling indices of intramitochondrial DNA synthesis changed due to ageing. When they were labeled with 3H-thymidine silver grains appeared over some nuclei of both cell types at perinatal stages, but they appeared almost all the cell bodies containing mitochondria. Quantitative analysis revealed that the numbers of mitochondria in both adrenalin and noradrenalin cells at various ages increased from fetal day 19 to postnatal month 1 due to ageing of animals, respectively, while the number of labeled mitochondria and the labeling indices of intramitochondrial DNA synthesis incorporating 3H-thymidine increased from fetal day 19 to postnatal day 14 (2 weeks), reaching the maxima, and decreased to month 24. It was shown that the activity of intramitochnodrial DNA synthesis in the adrenal medullary cells in ageing mice increased and decreased due to ageing of animals (Figure 3).
The DNA Synthesis in the Islet of Langerhans: When we studied macromolecular synthesis in the exocrine pancreatic cells of ageing mice by LM and EMRAG we also studied the islet cells of Langerhans together with the exocrine cells, using RI labeled precursors such as 3H-thymidine for DNA [58-60], 3H-uridine for RNA [58-61], 3H-leucine for proteins [62,63], 3H-glucosamine for glucides [64], 3H-glycerol for lipids [65,66]. The results showed that the islet cells, A, B and C cells, incorporated those precursors to synthesize DNA, RNA, proteins and glucides. The labeling index of DNA synthesis and the densities of silver grains showing RNA, proteins and glucides syntheses were high at prenatal and earlier postnatal stages from day 1 to day 14, then decreased from 1 month to 1 years due to ageing. However, the labeling index by 3H-thymidine and the grain counts by 3H-uridine and 3H-leucine in the endocrine cells was less than those in the exocrine cells at the same ages.
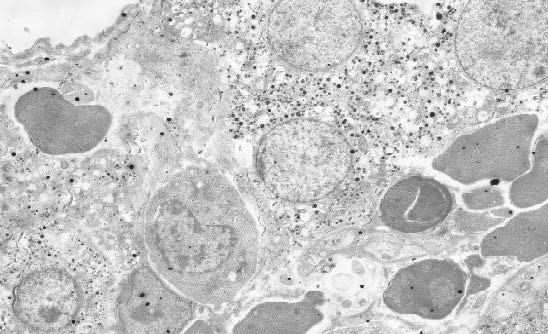
The DNA Synthesis in the Leydig Cells of the Testis: The cells of Leydig can be found in the interstitial tissues between the seminiferous tubules of the testis of mammals [34,53,67-69]. They are identified as spherical, oval, or irregular in shape and their cytoplasm contain lipid droplets. We studied the macromolecular synthesis of the cells in the testis of several groups of litter ddY mice at various ages from fetal day 19 to postnatal ageing stages up to 2 years senescence by LM and EMRAG using 3H-thymidine, 3H-uridine and 3H-leucine incorporations.
The Leydig cells from embryonic stage to senescent stages were labeled with 3H-thymidine as observed by LMRAG (Figure 1). The changes of the numbers of labeled Leydig cells with the 3H-thymidine incorporation into the nuclei showing the DNA synthesis were found in these cells at different ageing stages. Only a few cells were labeled after 3H-thymidine at embryonic day 19. At early postnatal stages, there was a slight increase of the number of labeled cells. The numbers of labeled cells from perinatal stage to postnatal 14 days and 1, 2, 6 months were similar to the values found at prenatal and early postnatal stages. The notable increases in the number of labeled cells of Leydig were found from 9 months to 2 years in senescence. The labeling indices with 3H-thymidine in perinatal stages to postnatal 6 months were low (5-10%) but increased at 9 months and maintained high level (50-60%) to 2 years [34,53,67,68]. The labeling indices at senescent stages still maintained a relatively high level and they were obviously higher than those of young animals. By electron microscopy, typical Leydig cells contained abundant cell organelles such as smooth surfaced endoplasmic reticulum, Golgi apparatus and mitochondria with tubular cristae. The silver grains were mainly localized over the euchromatin of labeled nucleus. Some of the grains were also localized over some of the mitochondria in both the nuclei labeled and unlabeled cells.
The DNA Synthesis in the Ovarian Follicles: The ovarian follicles in the ovaries of mature mice are one of the steroid secreting organs in female animals. We studied the DNA and RNA synthesis of the follicular cells in the developing ddY mice ovaries in several ageing groups at postnatal day 1, 3, 7, 14, 30 and 60 by LM and EMRAG using 3H-thymidine and 3H-uridine [70,71]. From the results it was shown that both DNA and RNA synthesis in the ovarian follicular cells were observed. Quantitative analysis, as expressed with labeling indices and grain counts, revealed that both increased significantly from postnatal day 1 to 3, then decreased from day 7 to 60 (Figure 4). Comparing the results to other female genital cells, a paralleled alteration of both DNA and RNA synthesis was revealed between the ovarian follicular cells and other uterine or oviductal cells (Figure 4). On the other hand, the glycoconjugate synthesis as shown by the uptake of 35SO4 in mouse ovary during the estrus cycle was also demonstrated [72] (Figure 4).
The RNA (ribonucleic acid) contained in cells can be demonstrated either by morphological histochemical techniques staining tissue sections such as methyl green-pyronin staining or by biochemical techniques homogenizing tissues and cells. To the contrary, the synthetic RNA or newly synthesized RNA but not all the RNA in the cells can be detected as macromolecular synthesis together with other macromolecules such as DNA or proteins in various organs of experimental animals by either morphological or biochemical procedures employing RI-labeled precursors. We have studied the sites of macromolecular synthesis in almost all the organs of mice during their aging from prenatal to postnatal development to senescence by means of microscopic radioautography, one of the morphological methods [20,21,24-26,28]. The results obtained from RNA synthesis should be here described according to the order of organ systems in anatomy or histology. In contrast to the results obtained from DNA synthesis of almost all the organs, we have studied only several parts of the organ systems. The skeletal system, the muscular system or the circulatory system were not so much studied.
On the other hand, LM and EMRAG of pancreas of mouse injected with 3H-uridine demonstrated its incorporation into exocrine and then in endocrine cells, and more in pancreatic acinar cells than in ductal or centro-acinar cells [59,61]. Among the acinar cells, the number of silver grains increased after birth to day 14 and then decreased with ageing. Quantification of silver grains in the nucleoli, chromatin, and cell body were carried out by X-ray microanalysis [58,73-75] which verified the results obtained by visual grain counting. In EMRAG obtained from the pancreas of fetal day 19 embryos, newborn day 1 and newborn day 14 mice labeled with 3H-uridine, demonstrating RNA synthesis, the numbers of silver grains in the nucleoli, nuclear chromatin and cytoplasm increased [58,59,73-77]. In order to quantify the silver contents of grains observed over the nucleoli, nuclei and cytoplasm, X-ray spectra were recorded by energy dispersive X-ray microanalysis (JEM-4000EX TN5400), demonstrating Ag-K peaks at higher energies. Thus, P/B ratios expressing relative silver contents were determined and compared between the two age groups. The results obtained by X-ray microanalysis in different cell compartments at postnatal day 1 and day 14 and he results obtained by visual grain counting in different cell compartments in day 1 day and day 14 animals were compared. The number of silver grains was calculated to express the counts per unit area to be compared with the XMA counts. These two results, the silver content analyzed by X-ray microanalysis and the results obtaining from visual grain counting were in good accordance with each other.
We studied the RNA syntheses in ageing mouse testis by LM and EM RAG, demonstrating the incorporations of 3H-uridine into various cells of the seminiferous tubules [10,34,67]. The RNA synthesis of various cells in the seminiferous tubules was studied using 3H-uridine, while the protein synthesis was by 3H-leucine incorporations. Silver grains due to 3H-uridine demonstrating RNA synthesis were observed over the nuclei and cytoplasm of all spermatogonia, spermatocytes, Sertoli’s cells, myoid cells of immature mice at perinatal stages at day 1 and 3, as well as in mature and senescent mice from month 1, 6 to year 1 and 2. The synthetic activities of spermatogonia, Sertoli’s cells and myoid cells as shown by grain counting with 3H-uridine, as expressed by grain counting, were low (2-8 grain counts per 10 µm2 at the embryonic and neonatal stages but increased at adult stages and maintained high levels (10-20 grain counts per 10 µm2) until senescence. These results showed that DNA synthesis in myoid cells and Sertoli’s cells increase at the perinatal stages and decrease from postnatal 2 weeks as described previously, while the RNA synthesis in spermatogonia increase from postnatal 2 weeks together with DNA and protein syntheses to senescence.
In order to detect the changes of RNA synthesis of the developing blastcysts in mouse endometrium during activation of the implantation, ovulations of female BALB/C strain mice were controlled by pregnant mare serum gonadotropin and human chorionic gonadotropin, then pregnant female mice were ovariectomized on the 4th day of pregnancy [78-82]. The delay implantation state was maintained for 48 hrs and after 0 to 18 hrs of estrogen supply, 3H-uridine was injected. The three regions of the endometrium, i. e. the interinplantation site, the antimesometrial and mesometrial sides of implantation site, were taken out and processed for LM and EMRAG. It was well known that the uterus of the rodent becomes receptive to blastcyst implantation only for a restricted period. This is called the implantation window that is intercalated between refractory states of the endometrium whose cycling is regulated by ovarian hormones [82]. We studied the changes of RNA synthesis by 3H-uridine [81] incorporations in the endometrial cells of pregnant-ovariectomized mice after time-lapse effect of nidatory estradiol. As the results, the endometrial cells showed topographical and chronological differences in the nucleic acid synthesis. The cells labeled with 3H-uridine demonstrating RNA synthesis were observed in both epithelial cells and stromal cells. Quantitative analysis revealed that the labeling indices with 3H-thymidine in the stromal cells at antimesometrial and mesometrial side of implantation sites and interimplantation sites increased from 0 hr to 3 (10% in antimesometrial site), 6, 12 and 18 hr, reaching a peak (60% in antimesometrial site) at 18 hrs after estrogen induction, while the number of silver grains as expressed by grain counting per µm2 in both the stromal and epithelial cells on the antimesometrial side due to 3H-uridine increased from 0 hr to 3 and 6 hr, reaching a peak (4 grain count per µm2 in luminal epithelial cells) at 6 hr and decreased from 12 to 18 hr (2 grain count per µm2 in luminal epithelial cells). These results suggested that the presence of the blastocysts in the uterine lumen induced selective changes in the behavior of endometrial cells after nidatory estradiol effect showing the changes of DNA and RNA synthesis. The time coincident peak of RNA synthesis detected in the endometrial cells at the anti-mesometrial side of the implantation site, probably reflected the activation moment of the implantation window.
We studied the RNA synthesis of the adrenal glands and the cells of Leydig in the testis of aging mice among the endocrine organs after the administration of 3H-uridine at various ages.
The RNA Synthesis in the Adrenal Glands: The RNA synthesis in the adrenal glands was studied in both the adrenal cortex and the adrenal medulla after administration of 3H-uridine in aging mice at various ages from perinatal stages to senescence at year 2.
The RNA Synthesis in Aging Mouse Adreno-Cortical Cells: Observing both LM and EM RAG labeled with 3H-uridine, demonstrating RNA synthesis, the silver grains were found over the nuclei and cytoplasm of almost all the adreno-cortical cells from perinatal stages to postnatal month 1-24 [37,38,52,53]. Those labeled cells were found in all the 3 layers, the zona glomerulosa (Figure 1), the zona fasciculata and the zona reticularis, at respective aging stages. In labeled adreno-cortical cells in the 3 layers the silver grains were mainly localized over the euchromatin of the nuclei and several silver grains were found over the endoplasmic reticulum, ribosomes and mitochondria of these cells. The ultrastructural localizations of silver grains over the mitochondria were mainly on the mitochondrial matrices and some over the cristae or membranes.
Mitochondrial RNA Synthesis of Ageing Mouse Adreno-Cortical Cells: The results of visual grain counts on the number of mitochondria labeled with silver grains obtained from 10 adreno-cortical cells in the 3 layers of each animal labeled with 3H-uridine demonstrating RNA synthesis in 10 aging groups at perinatal stages, prenatal embryo day 19, postnatal day 1, 3, 9 and 14, and month 1, 2, 6, 12 and 24 were reported previously [37,38,52,53]. The results demonstrated that the numbers of labeled mitochondria with 3H-uridine showing RNA synthesis gradually increased from prenatal embryo day 19 (glomerulosa 0.3, fasciculata 0.5, reticularis 0.4/cell) to postnatal day 14, month 1 and 2 (glomerulosa 5.3, fasciculata 5.0, reticularis 6.2/cell), reaching the maximum, then decreased to month 6, 12 and 24. The increase and decrease were stochastically significant (P <0.01).
The Labeling Index of RNA Synthesis in Mouse Adreno-Cortical Mitochondria: On the other hand, the labeling indices in respective aging stages were calculated from the number of labeled mitochondria, dividing by the number of total mitochondria per cell that were mentioned previously [37,38,52,53]. The results showed that the labeling indices gradually increased from prenatal day 19 (glomerulosa 10.4, fasciculata 12.1, reticularis 13.1%) to postnatal day 1 (glomerulosa 12.6, fasciculata 11.4, reticularis 11.1%), 3, 9 (glomerulosa 16.6, fasciculata 18.0, reticularis 18.0%), reaching the maximum and decreased to day 14, month 1 (glomerulosa 11.4, fasciculata 11.0, reticularis 10.7%) 2 (glomerulosa 8.5, fasciculata 7.8, reticularis 8.8%), month 6 (glomerulosa 4.1, fasciculata 4.2, reticularis 3.8%), 12 and 24. The increase and decrease were stochastically significant (P<0.01).
RNA Synthesis in Ageing Mouse Adreno-Medullary Cells: The adrenal medulla consists of 2 cell types, the adrenalin cells and noradrenalin cells. When they were labeled with 3H-uridine, an RNA precursor, silver grains appeared over almost all the cells, both nuclei and cytoplasm containing mitochondria [38,53,83]. Quantitative analysis revealed that the numbers of mitochondria in both adrenalin and noradrenalin cells at various ages increased from fetal day 19 to postnatal month 1 due to ageing of animals, respectively, but did not decrease to month 24, while the number of labeled mitochondria and the labeling indices of intramitochondrial RNA synthesis incorporating 3H-uridine increased from fetal day 19 to postnatal month 1, reaching the maxima, but did not decrease to month 24. It was shown that the activity of intramitochnodrial RNA synthesis in the adrenal medullary cells in aging mice increased but did not decrease due to ageing of animals in contrast to DNA synthesis [83].
The Leydig Cells of the Testis: The cells of Leydig can be found in the interstitial tissues between the seminiferous tubules of the testis of mammals [34,53,67,68]. They are identified as spherical, oval, or irregular in shape and their cytoplasms contain lipid droplets. We studied the macromolecular synthesis of the cells in the testis of several groups of litter ddY mice at various ages from fetal day 19 to postnatal aging stages up to 2 years senescence by LM and EMRAG using 3H-thymidine, 3H-uridine and 3H-leucine incorporations.
The incorporation of 3H-uridine into RNA was observed in almost all the Leydig cells in the interstitial tissues of the testis from embryonic day 19 to 2 years after birth. A few silver grains over the nuclei and cytoplasm of the Leydig cells labeled with 3H-uridine were observed at embryonic day 19. The silver grains over those cells slightly decreased at postnatal day 1, 3, 7 and 14. The number of the silver grains over the nuclei increased from postnatal 1 month onwards. The average number of silver grains over the cytoplasm increased gradually and reached the maximum at 12 months after birth. At each stage, the activity of RNA synthesis was specifically localized over the euchromatin in the nucleus and nucleolus as observed by EMRAG. From adult to senescent stages, the activity of RNA synthesis maintained a high level in their nuclei as compared to the cytoplasm. In the cytoplasm of Leydig cells in respective aging groups some of the mitochondria and endoplasmic reticulum were also labeled with silver grains. It is noteworthy that the average grain counts increased prominently in the senescent aging groups at 1 and 2 years after birth.
The proteins found in animal cells are composed of various amino-acids which initially form low molecular polypeptides and finally macromolecular compounds designated as proteins. They are chemically classified into two, simple proteins and conjugated proteins. Therefore, the proteins can be demonstrated by showing specific reactions to respective amino-acids composing any proteins. Thus, the proteins contained in cells can be demonstrated either by morphological histochemical techniques staining tissue sections such as Millon reaction or tetrazonium reaction or otherwise by biochemical techniques homogenizing tissues and cells. To the contrary, the newly synthesized proteins but not all the proteins in the cells can be detected as macromolecular synthesis together with other macromolecules such as DNA or RNA in various organs of experimental animals by either morphological or biochemical procedures employing RI-labeled precursors. We have studied the sites of macromolecular synthesis in almost all the organs of mice during their aging from prenatal to postnatal development to senescence by means of microscopic radioautography [10,20-25,28]. The results obtained from protein synthesis should be described according to the order of organ systems in anatomy or histology. In contrast to the results obtained from DNA synthesis of almost all the organs, we have studied only several parts of the organ systems.
As for the protein synthesis in the pancreas, 3H-leucine incorporation into endoplasmic reticulum, Golgi apparatus and to secretory granules of pancreatic acinar cells was first demonstrated by Jamieson and Palade (1967). We first studied 3H-glycine incorporation into these cell organelles of mouse pancreatic acinar cells in connection with soluble compounds by EM RAG [84,85]. It was demonstrated that soluble 3H-glycine distributed not only in these cell organelles but also in the karyoplasm and cytoplasm diffusely. Then, the quantitative aspects of protein synthesis with regards the ageing from fetal day 19, to postnatal day 1, 3, 7, 14 and 1, 2, 5 and 12 months were also clarified [62,85]. The results showed an increase of silver grain counts labeled with 3H-leucine after birth, reaching a peak from postnatal 2 weeks to 1 month, and decreasing from 2 months to 1 year.
On the other hand, we also studied 3H-leucine incorporations into the pancreatic acinar cells of both normal adult rats and experimentally pancreatitis induced rats with either ethionine or alcohol [86,87]. The results showed that the incorporations as indicated silver grain counts in the pancreatitis rats were less than normal control rats. However, its relation to the ageing was not yet studied.
We studied the macromolecular synthesis of the cells in the testis of several groups of litter ddY mice at various ages from fetal day 19 to postnatal aging stages up to 2 years senescence by LM and EM RAG using 3H-thymidine, 3H-uridine and 3H-leucine incorporations [34,41,67,58]. The incorporation of 3H-leucine into proteins was observed in almost all the Leydig cells in the interstitial tissues of the testis. The silver grains were located over the nuclei and cytoplasm of respective Leydig cells. The ageing change of protein synthesis of Leydig cells among different ageing groups was also found [10,88]. At embryonic day 19, the silver grains of Leydig cells labeled with 3H-leucine was observed in both nucleus and cytoplasm and there was no obvious difference between the number of silver grains on the cytoplasm and the nucleus. The number of silver grains decreased at postnatal day 1 and then increased at day 3 and 7. However, the number of silver grains on both the nucleus and cytoplasm decreased from 1 month to 3 months and increased again from 6 months onwards maintaining a high level from adult to senescent stages. Some of the silver grains were also localized over some of the mitochondria in respective ageing groups as observed by EM RAG. These results indicate that the DNA, RNA and protein syntheses in Leydig cells are maintained at rather high level even at senescent stages at postnatal 1 and 2 years when the animals survived for longer lives.
The glucides found in animal cells and tissues are composed of various low molecular sugars such as glucose or fructose called monosaccharides those form compounds of polysaccharides or complex mucopolysaccharides connecting to sulfated compounds. The former are called simple polysaccharides, while the latter mucopolysubstances. Thus, the glucides are chemically classified into 3 groups, monosaccharides such as glucose or fructose, disaccharides such as sucrose and polysaccharides such as mucosubstances. However, in most animal cells polysaccharides are much more found than monosaccharides or disaccharides. The polysaccharides can be classified into 2, i.e. simple polyscaccharides and mucosubstances. Anyway, they are composed of various low molecular sugars that can be demonstrated by either histochemical reactions or biochemical techniques. To the contrary, the newly synthesized glucides but not all the glucides in the cells and tissues can be detected as macromolecular synthesis together with other macromolecules such as DNA, RNA or proteins in various organs of experimental animals by either morphological or biochemical procedures employing RI-labeled precursors. We have studied the sites of macromolecular synthesis in almost all the organs of mice during their aging from prenatal to postnatal development to senescence by means of microscopic radioautography [10,20-22,24,28,31]. The results obtained from glucides synthesis are described according to the order of organ systems in anatomy or histology. In contrast to the results obtained from DNA synthesis of almost all the organs, we have studied only several parts of the organ systems. The skeletal system, the muscular system and the circulatory system were not yet studied.
The lipids found in animal cells are chemically composed of various low molecular fatty acids. They are esters of high fatty acids and glycerol that can biochemically be classified into simple lipids and compound lipids such as phospholipids, glycolipids or proteolipids. The simple lipids are composed of only fatty acids and glycerol, while the latter composed of lipids and other components such as phosphates, glucides or proteins. In order to demonstrate intracellular localization of total lipids, we can employ either histochemical reactions or biochemical techniques. To the contrary, the newly synthesized lipids but not all of the lipids in the cells can be detected as macromolecular synthesis similarly to the other macromolecules such as DNA, RNA, proteins or glucides in various organs of experimental animals by either morphological or biochemical procedures employing RI-labeled precursors. We have studied the sites of macromolecular synthesis in almost all the organs of mice during their aging from prenatal to postnatal development to senescence by means of microscopic radioautography [10,20,22-24,28,31,32]. However, we have not studied the lipids synthesis so much as compared to other compounds. We have studied only a few organs of the digestive system.
The other substances than macromolecules that can also be demonstrated by radioautography are target tracers not the precursors for the macromolecular synthesis. They are hormones such as 3H-methyl prednisolone [89], neurotransmitters and inhibitors such as 14C-bupranolol, a beta-blocking agent [90] or 3H-befunolol [91,92], vitamins, drugs such as synthetic anti-allergic agent 3H-tranilast [60,93-96], hypolipidemic agent bezafibrate [97-99], calmodulin antagonist [100,101] or anti-hypertensive agent 3H-benidipine hydrochloride [102], toxins, inorganic substances such as mercury[29,30] and others such as laser beam irradiation [103]. The details are referred to the previous publication on the radioautographology [10]. However, their relationships to the cell ageing were not studied.
From the results obtained, it was concluded that almost all the cells in various organs of all the organ systems of experimental animals at various ages from prenatal to postnatal development and senescence during the ageing of cells and individual animals demonstrated to incorporate various macromolecular precursors such as 3H-thymidine, 3H-uridine, 3H-leucine, 3H-glucose or glucosamine, 3H-glycerol and others localizing in the nuclei, cytoplasmic cell organelles showing silver grains due to DNA, RNA, proteins, glucides, lipids and others those which the cells synthesized during the cell ageing. Quantitative analysis carried out on the numbers of silver grains in respective cell organelles demonstrated quantitative changes, increases and decreases, of these macromolecular synthesis in connection to cell ageing of respective organs. In general, DNA synthesis with 3H-thymidine incorporations in most organs showed maxima at perinatal stages and gradually decreased due to ageing. To the contrary, the other synthesis such as RNA, proteins, glucides and lipids increased due to ageing and did not remarkably decrease until senescence. Anyway, these results indicated that macromolecular synthetic activities of respective compounds in various cells were affected from the ageing of the individual animals.
Thus, the results obtained from the various cells of various organs should form a part of special radioautographology that I had formerly proposed [10,15], i.e., application of radioautography to the ageing of cells, as well as a part of special cytochemistry as was formerly reviewed. We expect that such special radioautographology and special cytochemistry should be further developed in all the organs in the future.
This study was supported in part by Grant-in-Aids for Scientific Research from the Ministry of Education, Science and Culture of Japan (No. 02454564) while the author worked at Shinshu University School of Medicine as well as Grants for Promotion of Characteristic Research and Education from the Japan Foundation for Promotion of Private Schools (No. 1997, 1998 1999, 2000) while the author worked at Nagano Women’s Jr. College. The author is also grateful to Grant-in-Aids for Scientific Research from the Japan Society for Promotion of Sciences (No. 18924034, 19924204, 20929003) while the author has been working at Shinshu Institute of Alternative Medicine and Welfare since 2005 up to the present time. The author thanks Dr. Kiyokazu Kametani, Technical Official, Department of Instrumental Analysis, Research Center for Human and Environmental Sciences, Shinshu University, for his technical assistance in electron microscopy during the course of this study.