
Plastic Waste Generation and Source Separation by Tertiary Students: A Case Study on a University Campus in Ghana
The daunting challenge of waste management in Nigeria requires the application of different strategies. This paper seeks to evaluate the strategies employed for waste management in Jalingo metropolis, Taraba State, Nigeria. A cross-sectional field survey was conducted to obtain first-hand information from 400 households and businesses on the strategies and their effectiveness or otherwise employed by government authorities in waste management. Data collected from the field survey was coded into SPSS version 21 and then analysed using SPSS Amos 26. Results showed that enforcing environmental laws and sanctions on defaulters had the greatest (71.9%) contribution toward waste management. The study recommended that legal powers be conferred on authorities responsible for waste management to enforce laws and sanctions.
Keywords:Waste Management; Jalingo; SEM; strategies; EvaluationISSN
Waste management is one of the issues and challenges to environmentalists and governments, especially in Sub-Saharan Africa (Orhorhoro & Oghoghorie, 2019) [9]. The increased human population in the past decade has resulted in increased waste generation (Abd’razack, Yusuf, and Utange, 2013) [1]. Management of this generated waste has proved challenging, especially in Nigeria, as it was rated one of the dirtiest countries in the world (Nnamdi, 2014) [4].
To improve its waste management and secure a friendly environment for its citizens, the government of Nigeria at all levels has established ministries, departments, and agencies saddled with the responsibility of ensuring effective and efficient waste management. Lagos State, for instance, established the Lagos State Waste Disposal Board (Akinwale, 2005) [3], which is now transformed into the Lagos State Waste Management Agency (LAWMA). The agency’s primary objective is to effectively manage the waste of about a 22million residents of Lagos State and to help deliver a clean environment through transportation, management of waste disposal sites, and, much recently, recycling (LAWMA Report, 2016) [6].
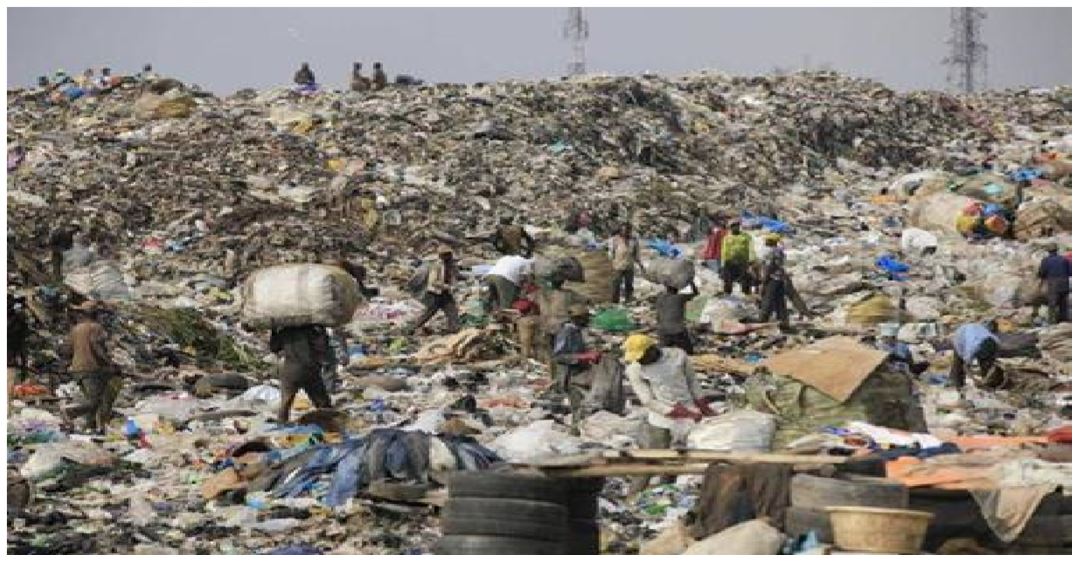
In Taraba State, the environmental protection agency under the Ministry of Environment was established and saddled with the responsibility of waste management in Jalingo and other major towns in the State (Taraba State Ministry of Environment, 2021) [10]. After several years of the agency’s establishment and operation, it has been argued that its aim for its establishment has been defeated since there has been no improvement in waste management in the State (Babanyaya, Oruonye, & Ahmed, 2021) [4]. This lack of improvement in waste management is evident in the heaps of refuse seen in unauthorised sites in the Jalingo metropolis and other major towns in the State, as depicted in figure 1.
Given the preceding, it is imperative to review and evaluate the strategies employed by the agency to identify and recommend the ones with the most significant effect on improved waste management. Evaluation of the strategies would also help the agency’s enhanced decision-making; decisions like channelling more resources to strategies evaluated to yield better results and re-strategising low-performing strategies. Strategy evaluation has been proven to improve organisational performance (Okwemba & Njuguna, 2021) [8]. this paper aims to evaluate the waste management strategies in the Jalingo metropolis using an SEM approach.
A cross-sectional field survey was designed and conducted in the Jalingo metropolis to obtain first-hand information from households and businesses on the strategies and their effectiveness or otherwise employed by government authorities in waste management. Primary data/information was obtained from the households and businesses through a self-administered questionnaire to 400 respondents across the four metropolitan council wards. Data collected from the field survey was coded into SPSS version 21 and then analysed using SPSS Amos 26
Four hundred copies of the questionnaire were self-administered to households and businesses in the four (metropolitan) council wards of the Jalingo Local Government area- Kona, Sintali, Barade and Turaki B. Since the questionnaires were self-administered and completed in the presence of the researcher, all four hundred (400) copies of the questionnaires were duly completed representing a 100% response rate. The descriptive statistics of the coded survey data are presented in Table 1.
Table 2 above is the descriptive statistics of strategies employed for waste management. The mean value of laws and sanctions (L.S.) is 3.869 units, while the minimum and maximum values are 1.000 and 5.000, respectively. The standard deviation of 0.872 implies that the data deviated from the mean value from both sides by 0.872 units. This deviation shows no wide dispersion of the data from the mean value. The L.S. data is negatively skewed or skewed leftward (-1.720), implying that most respondents strongly agreed or agreed that laws and sanctions would be a strategy for waste management.
The mean sensitisation (S.T.) value is 3.752 units, while the minimum and maximum values are 1.000 and 5.000, respectively. The standard deviation of 0.691 implies that the data deviated from the mean value from both sides by 0.691 units. The deviation shows no wide dispersion of the data from the mean value. The S.T. data is negatively skewed or skewed leftward (-1.583), implying that most respondents strongly agreed or agreed that sensitisation would be a strategy for waste management waste.
The mean value of designated waste dump sites (W.S.) is 4.391 units, while the minimum and maximum values are 2.000 and 5.000, respectively. The standard deviation of 0.829 implies that the data deviated from the mean value from both sides by 0.829 units. This shows that there is no wide dispersion of the data from the mean value. The W.S. data is negatively skewed or skewed leftward (-1.896), implying that most respondents strongly agreed or agreed that the designation of waste dump sites would be a strategy for waste management.
The mean value of routine environmental sanitation (E.S.) is 3.907 units, while the minimum and maximum values are 1.000 and 5.000, respectively. The standard deviation of 0.714 implies that the data deviated from the mean value from both sides by 0.714 units. This shows that there is no wide dispersion of the data from the mean value. The E.S. data is negatively skewed or skewed leftward (-0.729), implying that most respondents strongly agreed or agreed that routine environmental sanitation would be a strategy for waste management.
The mean value of waste management (WMG) is 3.680 units, while the minimum and maximum values are 1.000 and 5.000, respectively. The standard deviation of 1.375 implies that the data deviated from the mean value of 3.680 from both sides by 1.375 units. This shows that there is no wide dispersion of the data from the mean value. The WMG data is negatively skewed or skewed leftward (-0.725), implying that most respondents strongly agreed or agreed to the measure adopted for waste management in the Jalingo metropolis.
The reliability test results, as contained in table 4.9, showed the reliability test for both the pilot and final study. The Cronbach alpha coefficients for the pilot study were within the range of 0.796 to 0.879; the range for the final study was 0.761 to 0.891. The Cronbach alpha coefficients imply that all the items which measured waste management measures were found to be reliable since their Cronbach alpha coefficients were greater than 0.7
The proposed measurement model on strategies employed in waste management is presented in figure 2. A modified measurement model arrived after several adjustments guided by factors loading and modification indices. The modified model is presented in figure 3
The Confirmatory Factor Analysis (CFA) was applied in this study to test the convergent validity of the individual constructs in the research questionnaire by assessing the factor loadings, Average Variance Extracted (AVE), and Modification Index (MI). Therefore, Table 4.10 above illustrates the construct’s items’ first and second-order CFAs. Items which did not meet the criteria of MI<15 were deleted from the path diagrams of the CFAs. The AVEs were also calculated; waste management had 4 items at the beginning of the analysis; after the first order CFA, which is similar to Explanatory Factor Analysis (EFA), one item was deleted, leaving 3 items with AVE=0.502. Laws and Sanctions (L.S.) had 4 items; after the first order CFA was conducted, 1 item was deleted, leaving 3 items with AVE=0.518. Sensitisation had 4 items as well; after the first order CFA was conducted, 1 item was deleted, leaving 3 items with AVE=0.535. Similarly, the designation of waste dump sites (W.S.) had 3 items, and after conducting the first-order CFA, 1 item was deleted, leaving 2 items with AVE=0.510. Routine Environmental Sanitation (E.S.) had 2 items which all satisfied the MI criteria value of <15 with AVE=0.527.
A normality test was conducted to check whether the data followed a normal distribution. Results of the test revealed that all the latent constructs and measured variables were <5. Table 4.11 above shows that the respective Kurtosis values for the latent constructs and measured variables range from 1.116 maximum value to -1.330 minimum value, which all fall within the values of <5. Also, the overall multivariate Kurtosis=32.084 implies a normally distributed sample, as Gao, Makhtarian and Johnston (2008) argued that multivariate Kurtosis values, which are not large, are products of normally distributed data.
The measures adopted for waste management are; laws and sanctions, sensitisation, designation of waste dump sites and routine environmental sanitation. Therefore, the structural model in figure 4.6 below consists of four predicting constructs concerning the criteria construct. Hence the proposed hypothesis that examines the validity of the model is expressed as follows; H02: All independent variables (laws and sanctions, sensitisation, designation of waste dump sites and routine environmental sanitation) are significant when regressed against the dependent variable (Waste management)
H02: All independent variables (laws and sanctions, sensitisation, designation of waste dump sites and routine environmental sanitation) are significant when regressed against the dependent variable (Waste management)
The coefficients (Unstandardised and Standardised) of structural equation results for waste management measures are contained in table 4.12. The coefficient of laws and sanctions measures (payment of fines for indiscriminate waste dumping, closure of residential/ business premises) of 0.719 implies that any unit raise in-laws and sanctions measure will cause waste management to increase by 0.719 or about 72 per cent in Jalingo metropolis. The coefficient of sensitisation on proper waste disposal (Radio jingles on proper waste disposal by households and businesses, focused group discussions with residents and business owners on proper waste disposal) of 0.043 implies that if sensitisation on proper waste disposal increases by 1 unit, waste management will increase by 0.043 or 4.3 per cent in Jalingo metropolis. The coefficient of designated waste dump sites (provision of waste dump bins in strategic areas of the town and provision of waste dump bins to every household as well as business premises) of 0.268 implies that if designated waste dump sites increase by 1 unit, waste management will increase by 0.268 or about 27 per cent in Jalingo metropolis on average and all things equal. The coefficient of routine environmental sanitation (weekly cleaning of drainages in front of households and business premises) of 0.384 implies that if routine environmental sanitation increases by 1 unit, waste management will increase by 38.4 per cent. The coefficient of determination (R2) of 0.36 implies that 36 per cent variation in waste management is caused by measures adopted for waste management (laws and sanctions, sensitisation on proper waste disposal, designation of waste dump sites and routine environmental sanitation) in Jalingo metropolis. The results showed that all the waste management strategies (laws and sanctions, sensitisation on proper waste disposal, designation of waste dump sites and routine environmental sanitation) significantly contribute to waste management, as indicated by their probability values of 0.001, 0.000, 0.038 and 0.007 respectively. These values are <0.05 and hence statistically significant.
Several strategies are being employed to manage the waste generated in the Jalingo metropolis. This study found that enforcement of laws and sanctions (payment of fines, warning of the sealing of business premises) to households and businesses that dispose of waste indiscriminately is the strategy that had yielded the more result regarding waste management in the metropolis. This finding is consistent with the practice in Kwara State, Nigeria, where the State environmental sanitation law prohibits indiscriminate dumping of wastes in non-designated places such as along the highways, roads, channels, gorges, and undeveloped lands except at designated refuse disposal sites as approved by the State Environmental Protection Agency (Hakeem, 2013) [6]. The law provided that any person failing to comply with the law shall be guilty of an offence and shall, upon conviction, be liable to the fines ranging between N500.00 (Five hundred naira) and N10000.00 (Ten thousand naira). The finding also correlates with that of Ahmed & Nev (2021) [2], whose study showed ineffective environmental law enforcement and sanctions as one of the major causes of indiscriminate dumping of waste in the Jalingo metropolis.
Sensitisation of households and owners of businesses on proper waste processing and disposal was a strategy to improve waste management after enforcing laws and sanctions. This finding agrees with Ebele & Zakari (2017) [5], who argued that proper waste management at the point of generation (households and businesses) implies the success of waste management at the town or metropolitan level.
Among the strategies employed in waste management in the Jalingo metropolis, enforcement of laws and sanctions significantly contributes to improved waste management in the metropolis. On the other hand, the designation of waste disposal sites/facilities had the lowest impact on improving waste management. This is evident in the non-utilisation or inappropriate utilisation of these sites/facilities due to their distance from households or negligence.
The following recommendations are made to address the problems of waste control and management in the State:
i. Legal backing be given to the State environmental protection agency to enforce sanctions on households and businesses that disposes of waste indiscriminately
ii. A budget line is created for the State environmental protection agency to fund household and media sensitisation activities on appropriate waste processing and disposal.
iii. Improved funding from the Ministry of Environment and the State Environmental Protection Agency would go a long way in assisting them in procuring better and more equipment
for domestic waste collection and disposal.

.JPG)
.JPG)
.JPG)
.JPG)
.JPG)
.JPG)