Assessment of Hospital Liquid Waste Management in Public and Private Hospitals in Tamale Metropolis, Ghana
In developing countries, hospital liquid waste management is an issue of major concern. The main objective of this study was to assess the types and current management practices of hospital liquid waste in public hospitals and private hospitals: one modern teaching hospital, two standard regional hospitals and two most attended private hospitals in the Tamale Metropolis. Quantitative and qualitative approaches were used in the data collection. The data was analysed using Statistical Package for Social Sciences (SPSS). The study revealed that most of the workers (45.5%) had 5 years and above working experience but there was no statistical significance (p > 0.05) between the number of years in service and how often one receives training on hospital liquid waste management. Majority of the respondents (61%) said they had received training on liquid waste management randomly or periodically. There was statistical significance (p < 0.05) between the type of profession and the training received in hospital liquid waste management. Majority of the respondents (57%) indicated their liquid wastes are treated prior to disposal and there was statistical significance (p < 0.05) between the type of hospital and the separation of liquid waste before disposal. The study revealed that the main sources of liquid waste generation from the hospitals are labour wards, laboratories and theatres. There was significant association (p < 0.05) between the type of hospital and the amount of liquid waste produced a day. Two health care facilities treat and properly disposed of their liquid waste into a soak-away pit. The hospitals discharged their liquid waste without any proper treatment directly into drains to be conveyed into the urban drainage system. Some dug-out pits were not well constructed which could result in polluting underground water and posing threat to people of the environs. Only three hospitals had a proper functioning waste management department. This affirmed the claim of majority of the respondents that indicated the non-availability of hospital liquid waste management policy or legislation. There was no statistical significance (p > 0.05) between hospital having liquid waste disposal policy and how often inspection or supervision is done. The study therefore recommends that regulatory bodies should enforce drafted legislations on liquid waste treatment to enhance the efficiency of liquid waste management in hospitals specifically Tamale metropolis.
Keywords: Hospitals; Infectious Waste; Liquid Waste; Personnel Training
Hospital liquid waste refer to infectious, non-hazardous and hazardous liquid waste with sufficient free liquid arising from dental, medical, nursing, pharmaceutical or similar practice, care, investigation, treatment, teaching and or research that requires additional safety packaging to ensure safe transportation, treatment and storage [1]. Worldwide, hospital waste management is a major concern for most healthcare facilities [2]. In most developing countries, there is lack of technology and skills to implement and monitor hospital waste management programs [3]. The risks that have been associated with clinical liquid waste management have not received necessary attention [4]. About 5% are non-infectious but hazardous, around 10% are infectious, and 85% of hospital liquid wastes are actually non-hazardous [5]. However, the reuse of untreated clinical liquid waste can cause diseases such as cholera, plague, tuberculosis, hepatitis B, diphtheria etc [6].
The perception of administrators and health workers can influence the importance they attach to the management of health waste [7]. Improper management of healthcare waste can have direct impact such as the spread of drug-resistant microorganisms from health facilities into the immediate environment [5]. Liquid waste poses a serious threat to human health and the environment due to their ability to pollute ground water, enter watersheds, and drinking water when not properly handled and disposed [6]. It is therefore unethical and illegal to dispose untreated waste as it can extremely dangerous and even fatal in causing diseases like diphtheria, cholera, hepatitis B, tuberculosis, and plague among other and thus is a main problem for healthcare facilities [8]. Currently, poor treatment methods and practices of hospital liquid waste are creating serious environmental problems in local communities and cities, exposing residents and neighbours to air pollutants, contaminated water, foul odours and toxics from nearby healthcare facilities in Ghana [9]. Proper management of hospital liquid waste needs the greatest attention. Hence, any effective hospital liquid waste management programme should be able to provide protection to human health and the environment from hazards posed by the waste. The study was to assess the types and current management practices of hospital liquid waste in some selected hospitals in the Tamale Metropolis.
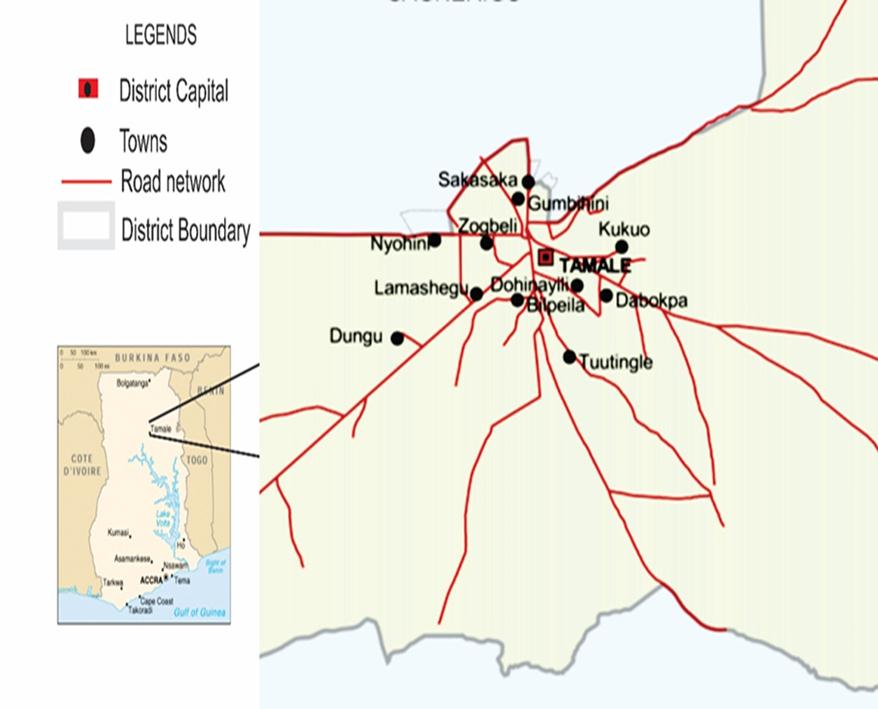
Northern region of Ghana has a population of 2,479,461 representing 10.1% of the total population (GSS, 2012) [10]. Tamale as shown in Figure 1 is the regional capital of Northern Region of Ghana. It is also known as the fastest growing city in West Africa. It lies between latitude 9° 16” - 9° 34” North and longitude 00° 36”- 00° 57” [10]. It has a tropical wet and dry/ savanna climate with a pronounced dry season in the low-sun months, no-cold season and wet season in the high-sun months. The Metropolis has health facilities including Tamale Teaching Hospital, Tamale Central Hospital, and Tamale West Hospital with about 30 other Clinics complementing the works of the hospitals doted around the Metropolis.
Tamale Teaching Hospital is located along the Tamale-Salaga main road. It is the largest hospital in the Metropolis and provides effective health care to a greater population of patients. Kabsad Scientific Hospital located behind the Tamale-Salaga road total filling station. It is along the Nim avenue Street of Tamale Central. It is sited in the middle of the Tamale Central community and is one of the top private health care facilities in the metropolis. God Care‘s Community Hospital located along the Tamale-Tolon road in a community called Kasalgu. It also serves as a rescue point for people around and in Nyankpala community since they are deprived of a well operative hospital in the community. Tamale Central Hospital and Tamale West Hospital are the two regional hospitals which provide healthcare delivery services to patients of the Metropolis and the region at large.
Purposive sampling was used to select hospitals. A semi-structured questionnaire was administered to obtain information from respondents. The preliminary field survey was done by taking a transect walk through and around the various hospitals. It enabled the identification of septic tanks, dug-outs and other storage and disposal methods present in the hospitals. The topography of the lands was also observed to ascertain whether disposed liquid waste can easily join the public drains and nearby water bodies as well.
The questionnaire was administer in each hospital based the number of workers in the facility. In total 94 respondents were given the questionnaire for their responses. In Tamale Teaching Hospital, thirty-one workers (Nurses, Doctors, Waste managers and Administrators) questionnaire was administered. Twenty (20) set of questionnaire was administered to Tamale Central Hospital and sixteen was administered to Tamale West Hospital. One set of questionnaire guide aided in an interview with the waste management department of both facilities to obtain information of their management practices. With Kabsad Scientific Hospital and God Care‘s Community Hospital, fourteen (14) questionnaires each was administered to the general staff.
Another set of questionnaire was designed for the legislative or policy making bodies. Each set was administered to the three policy making bodies which are Environmental Protection Agency, Ministry of Health Regional Directorate and the Tamale Waste Management Department.
The questionnaires were put in three sections. The first part targeted at getting information on the general workers or staff of the health care facilities such as doctors, physician assistant, nurses, midwifes, administrators and labourers. In designing the questionnaire, certain factors were put in place to obtain information from the respondents such as educational background, socio-economic background and their working experience. Information on types of liquid waste generated from the facility, their treatment and disposal, the safety of workers in handling and processing waste, the possible harm untreated waste could cause and the appropriate means of treating and disposing their liquid wastes. The section of the questionnaire was used to gather information on the waste management unit of the facilities.
A questionnaire was also designed for the legislative or policy making bodies to obtain information on their task and responsibility pertaining hospital liquid waste. The appropriate methods and standards set by the hospitals authorities. Data was also obtained from the legislative bodies such as Environmental Protection Agency, Environmental Health and Sanitation Unit and Tamale Waste Management Department. Statistical service unit of the metropolis also gave out some vital information in the accomplishment of this work.
The data was collated and coded for analysis. Statistical Package for Social Science (SPSS) was used in processing the data, and results presented in tables and charts. We also employed Chi-Square statistical test of significance to determine the level of significance of association between variables at 95% confidence level.
Majority of the respondents (59%) from the hospitals were males whilst about 41% of them were females (Table 1). Most of the respondents fell within the youthful age of 30 years and below representing about 40%, age group of 31 to 45 years representing 35% and age group of 46 to 60 years representing 22% and the least age group recorded was 61 years and above representing 3% (Table 1). Majority of the respondents 59% were Muslims and 41% were Christians. The high number of Muslims to Christians could be because Tamale is predominantly Muslim. The percentages of profession of the respondents were evenly dispersed with 18% being professional Nurses followed by 15% each representing Doctors, Pharmacists and Physician Assistants and, the least of all was Physiotherapists representing 4%. Most of the workers had 5 years and above working experience representing 45% (Table 1).
Majority of the respondents (81%) indicated the facilities have personnel designated place for waste management. It is important waste handlers are extensively trained on how to handle all kinds of waste irrespective of their degree of hazard. Majority of the respondents (62%) said they had received training on liquid waste management randomly or periodically (Table 2). The training was conducted in the form of workshops and seminars usually on annual basis. Most of the personnel receive training on how to handle hospital liquid waste in the hospitals. There was no statistical association (p > 0.05) between the number of years in service and training received on liquid waste management. However, there was statistical significance (p < 0.05) between the type of profession and the training received in hospital liquid waste management. This findings is consistent with a similar study in South Africa that revealed that 48% health workers interviewed indicated that had not received any formal training in health care waste management and only 50% indicated that had received in-service training with higher knowledge among nurses [11].
The training condition in the study area are in consonance with Roe (2012) that stated that about 56% of medical waste managers are provided training on how safe they can protect themselves against hazardous environmental conditions [12]. Also, Abdulla, et al. (2008) reported that, about 71% of the hospitals provided training to doctors and other personnel about medical waste management and their potential hazards on site investigation of medical waste management practices in Northern Jordan [13]. A similar survey conducted on hospital waste management in Libya by Sawalem et al. (2009) that showed that 85% of waste management personnel including managers, cleaning staff, and environmental workers, were not trained in hospital waste management and did not have a detailed description of their duties in respect of waste handling, 55% of doctors and nurses were unaware of hospital waste management protocols and showed insufficient knowledge of the potential hazards [14].
Most of the personnel receive in-service training when they are employed to equip them for better delivery of duties. Personal protective equipment used by the medical waste managers was gloves, apron/ overall, boot, and nose mask which weren’t adequate enough. The most effective personal protective equipment in reducing risk of injury is gloves to protect from exposure to blood, other potentially infectious materials and chemicals (WHO 2014) [5].
The study revealed that personnel at KSH had fair knowledge about training of personnel on hospital liquid waste management with a respondent percentage of 79%, which was followed by TWH with a percentage of 69%, TTH with 67% TCH with 55% and GCCH recorded the least in terms of personnel training on hospital liquid waste management with 27% (Table 2). This finding is in agreement with a study in South Africa in 2016 that indicated that there was poor knowledge among healthcare professionals and emphasized the need for regular training for improvement in their knowledge and practice regarding medical waste disposal [15]. The key informant believed there is inadequate training on liquid waste management and provision of modern facilities and PPE to aid in adequate management of the liquid waste generated. This was due to the lack of finances to make those provisions.
Majority of the respondents (57%) alluded to the fact that liquid waste were treated prior to its disposal with 43% denying such claim were aware of waste management. The study revealed that, KSH treated their liquid before disposing it as they recorded a higher percentage of 79%, closely followed by TTH with 70%, TCH 65% and GCCH 55% with TWH been entirely ignorant about treated of liquid waste prior to disposal with a minimal percentage of 6% (Table 3). Majority of the respondents indicated their liquid wastes are treated prior to disposal. There was statistical significance (p < 0.05) between the type of hospital and the separation of liquid waste before disposal. However, there were no significant differences (p > 0.05) between the training of personnel on liquid waste management and the treatment of hospital liquid waste before disposal. Further investigation revealed that treatment was specific to some departments’ whilst others do not practice. This finding is consistent with a study in South Africa that revealed that just over half (54%) of health staff had a good attitude towards disposal of health care waste [11]. Proper management ensures that infectious liquid waste is handled in accordance with established and acceptable procedures from the time of generation through treatment of the waste and its ultimate disposal [14].
About 68% of the respondents also alluded to the fact that separation of the different types of liquid waste was done before disposal. Segregation, minimisation and safe storage of hazardous materials are just as important for liquid wastes as they are for solid wastes (WHO 2014) [5]. Most of the respondents (Table 3) said they segregate the waste into its various components before treating and disposing appropriately. This was contradictory to the findings of Asante et al. (2013) that reported that a higher percentage (83%) of the healthcare centres visited do not segregate their waste in Accra [9]. Also, Athavale and Dhumale (2010) found that there was no segregation of the waste starting from generation to disposal in a study conducted at Pravara Rural Hospital, Loni and Maharashtra [16].
The majority also testified the availability of septic tanks at the hospitals. Most of the respondents agreed that they do not store the different types of liquid waste together after treatment (Table 4). There were no established sewage systems with sewer pipelines connected to these systems to dispose of their liquid waste but rather mere covered dug-outs where the liquid waste runs into.
From the results obtained (Table 3), most of the waste generated were infectious liquid wastes followed by non-hazardous and hazardous liquid waste on a daily basis. Infectious liquid waste is generated in almost all the various departments of the hospital but hazardous liquid waste is generated less because its generation is specific to some departments. It was further confirmed through a key informant interview with the Waste Management Unit of TTH, TCH and TWH that, all the three types of liquid waste were generated. There was significant association (p < 0.05) between the type of hospital and the amount of liquid waste produced a day. Per the five hospitals studied, infectious liquid wastes were generated most with a leading 37.69% followed by non-hazardous liquid wastes of 36.69% and hazardous liquid wastes as 25.61%. Similar study by Khajuria and Kumar (2007) in Agra city, India reported 70-75% is non-infectious wastes; 20-25% is infectious wastes, and 5-10% hazardous waste [17]. Also, Galtier et al. (2002) reported that 15%-20% of healthcare wastes in France to be infectious liquid whilst Gautam et al. (2010) report on “biomedical waste management/incineration” showed that 15% was classified as infectious and hazardous wastes in the United States of America [18,19]. WHO (2014) on “safe management of waste from hospital activities” reported that, 85% of hospital liquid wastes are non-hazardous, around 10% being infectious, and around 5% being hazardous liquid wastes [5].
In a key informant interview with health administrators of the hospitals, revealed there was no policy and legislation for hospital liquid waste. This affirmed the claim of majority of the respondents that indicated the non-availability of hospital liquid waste management policy or legislation (Table 5). There was no statistical significance (p > 0.05) between hospital having liquid waste disposal policy and how often inspection or supervision is done. Ahmed, et al. (2014) study in Sudan on assessment of hospital waste management in Khartoum State Hospital indicated that out of the many, only 25% of the hospitals studied have a documented policy outlining medical waste management [20]. A study by Agenda for a Reformed Cohesion Policy (2009) reported most countries lack elaborated legal policy specifically for health care waste, institutional framework for healthcare waste management in healthcare facilities and proper sanitary landfills [21].
The result indicates that majority of the respondents were not aware of the existence of hospital liquid waste policies (Table 5). Also, about 48% of respondents don‘t know of disposal guide and clearly outlined procedures put in place by the hospitals management concerning hospital liquid waste management (Table 5). In the quest to find out whether inspection or supervision is done in the hospitals concerning liquid waste management, majority (77%) testified that inspection is done randomly by Tamale Waste Management of the Tamale Metropolis and Environmental Protection Agency but daily inspection is done by internal supervision. There was no statistical significance (p > 0.05) between designated persons for liquid waste management and having liquid waste disposal policies or guidelines.
The waste management practice at the hospitals of study is the drainage disposal system for non-hazardous liquid type. Infectious liquid wastes without prior treatment are disposed of in septic tanks available with the hazardous liquid waste washed into the drains which eventually joins other external drains. If infectious stools or bodily fluids are not treated before being disposed of, it can create and extend epidemics, since sewage treatment in Africa is almost non-existent. Since, An, et al. (2000) that contamination of water supply from untreated healthcare waste can also have devastating effects [22].
The types of hospital liquid waste generated in the hospitals of study were basically non-hazardous, hazardous and infectious liquid wastes. Two health care facilities treated and properly disposed of its liquid waste into a soak-away pit whilst three hospitals disposed of liquid wastes into drains. Infectious liquid waste is generated in almost all the various departments of the hospital but hazardous liquid waste is generated less because its generation is specific to some departments. Majority of the respondents indicated their liquid wastes are treated prior to disposal. Inadequate training programmes for waste handlers (odlers) in waste disposal practices as well as the insufficient production of PPE are the major problem hindering the proper waste management practices in Tamale Metropolis. The study revealed that poor practices of liquid waste management in the hospitals could be partly due to inadequate knowledge among health staff about hospital liquid waste management. Hospital liquid waste can be a major pollution source and its improper disposal can cause epidemic diseases and also environmental pollution risks. From the study, the following recommendations were made: The regulatory should enforce drafted legislations on liquid waste treatment to enhance the efficiency of liquid waste management in hospitals specifically Tamale metropolis.
We are grateful to the management and all the staff of the five hospitals in the Metropolis for their permission and assistance in the data collection.
Permission was sorted from selected hospitals. The respondents consent was sorted and they were also informed that they have full right to accept or withdraw at any time during the data collection and, were assured that their responses will be kept confidential and be used only for this study purpose.