Assessment of Physicochemical Properties and Microbial Loading Index of Soil Samples from Mgbuka Market, Anambra State
Petroleum oil spilled soil from mgbuka market, onitsha axis of Anambra state showed some level of toxicological impact on agricultural soil. Contaminated soil showed pH of 4.24 In all, the control experiment maintained a pH of 7.6. Soil conductance (Ω-1cm-1) peaked in the contaminated soil while the control experiment soil conductance was 610. Dissolved minerals of Cl, P, Mg, K, Ca and Mg were analyzed and they showed varying relativity in abundance and concentrations. Heavy metals analysis in the soil samples revealed the presence of the following: Fe, Cd, Pb and Cu. Hg and As were below detectable limits in all the polluted soil while in the control experiment, Pb, Cd, Hg and As were not detected. Total petroleum hydrocarbons (TPH) were increasingly high in the polluted soil compared to the control experiment. Total organic carbon (TOC) and organic matter (TOM) contents correlate with that of the TPH in bioaccumulation. Analyses of soil organisms showed the persistent of strains of Pseudomonas and Klebsiella sp in the polluted soil. Peak heterotrophic counts (CFU/g) of the organisms in all the polluted soil were seen at day 0 of which progressively decreases as the incubation days decreases from 0-21. The study has provided empirical the health related indices of contaminated soil with petroleum hydrocarbons.
Keywords: Petroleum oil; Physicochemical; Microbial; Heterotrophic Counts; Toxicology
Environmental pollution accruing from petroleum and other petroleum derivatives such as allied petrochemicals are recognized as one of the most serious problems in developing countries due to their growing population [1]. Environmental pollution from oil and other oil recalcitrant related compounds have made a huge impact in all spheres of life including human health risk, damage to the ecosystem, disruption of lives and means of livelihood, health hazards to aquatic/terrestrial inhabitants, risk to food security and poverty [2, 3].
Over the years, anthropogenic activities of man towards industrialization, mechanizations etc in Nigeria have generated a myriad of pollutants in the form of gaseous emissions, oil spills, effluents and solid wastes [4] that have contaminated the environment beyond sustainability. Heightened navigational activities in inland and non-coastal regions of the country are among the anthropogenic sources of refined and spent petroleum pollution to the environment [5]. An investigation of the Polycyclic Aromatic Hydrocarbon (PAHs) concentrations in some south east region’s sediment carried out by [6] revealed an elevated level of these pollutants in the sediments studied. These activities on several human mechanizations, trading and other artisinic craftmanship generate solid waste and sludge composed of organic, inorganic compounds with chelated heavy metals. Effluents released by these industries are characterized by the presence of a large quantity of polycyclic aromatic hydrocarbons (PAHs), phenols, metal derivatives, surface active substances (surfactants), sulphides, naphthylenic acids and other chemicals [7, 8, 9].
With the increasing population pressure in Nigeria which resulted in increase in agricultural practices, very little attention has been paid to the agricultural soil quality in terms of fertility. Agriculture and its surrounding activities remain the foremost fulcrum of our nation’s developmental strides and productivity to meet its exponential population demand [10].
With intensified farming activities around the southern/eastern coastline, agricultural soil fertility remains the force of breakthrough to every farmer in all cadre within these areas and the nation at large.
Ecological impact assessment and other toxicological studies are efforts by environmentalists to bring to the fore the eco-dynamic nature of the environment to certain biotic and abiotic factors with accompanying data [11]. Several non-scientific speculations have been made on the impact of petroleum products on soil fertility with none seeming answerable to the problem. Mostly, annual and bi-annual crops are greatly affected by these petroleum products as reported by [11]. Mgbuka market has an expanse geographical locus on location with a very renowned reputation on automobile (in varieties) parts.
Huge anthropogenic activities are very common within the market with ecological implications on the receiving earth. The present study stands to fill the gap with the provision of empirical on the impact of petroleum effluents on certain soil physicochemical indices.
All chemicals/reagents and equipments used in the present were of analytical grade and products of the following companies: BDH chemical limited (England), Merck (Germany), May and Baker limited (England), Riedel-DeHaenHannaves (Germany), Hopkins and Williams Essex (England), Fluka chemical company (Germany), Kermel chemicals (China) and Lab. Tech Chemicals, Avighkar (India).
Soil sample was collected from the popular auto spare-part market colloquially known as Mgbuka, Anambra state, Nigeria. The soil was collected at four (4) stratified distance of 9m apart from each point of initial collection. An impression of 3cm is made through the soil at each designated collection point [9, 12]. The control experiment was sited at a distance of 1.04km from the test sample site.
Determination of Soil Physicochemical Properties
The following physicochemical properties of the polluted soil was determined in the presence of the non-polluted soil (control) as described by the journal of [13], they include:
• Soil pH Test
• Soil conductivity Test
• Determination of Macro and Micro Contents of the Soil
Mineral contents like soil electrolytes: K, Cl, Ca and Mg ions were determined
Potassium concentration of the soil was determined using spectrophotometer method; assay was carried out at wavelength of 610 nm [13].
Concentration of chloride ion in both mixtures is deduced from the formlar:
A-B X M X 70900÷Vol. (ml).
Where: A = titre volume of the blank
B = titre volume of the test sample
M = Molarity, Vol. of the waste pippetted.
CaCO3 content (mg/Kg) = Vx E(CaCO3) x 100/50
Calcium metal (mg/kg) = Tx 400.5 x 1.05/50
T= titre value.
Magnesium hardness can be calculated from the determined total hardness and Calcium hardness
Formula;
Magnesium (as mg/l) = (T–C) x 0.243
Where; T= total hardness mg/l (as CaCO3)
C= Calcium hardness mg/l (as CaCO3)
TOC (mg)= Vb - Vs X 16,000 ÷ vol. of sample used.
Total organic matter content (TOM) = 1.23 X TOC (EPA, 2010).
Soil Digestion for Heavy Metal Analysis
10 ml from the dissolved soil solution was digested in 250 ml conical flask by adding 30 ml of aqua regia (HNO3, HCl and HF in the ratio 3:2:1). It was further heated on a hot plate until volume remains about 7-12 ml. The digest was filtered using no 1 what-man filter paper and the volume was made up to the mark in a 50ml volumetric flask, and was then stored in a plastic container for atomic absorption spectra (AAS) analysis. Heavy metal standards were prepared accordingly as described by [14].
Total hydrocarbon (TPH) of the polluted soil was determined as described by ASTDR (2009).
Microbial ecology of the polluted soil was determined according to the method described by [15].
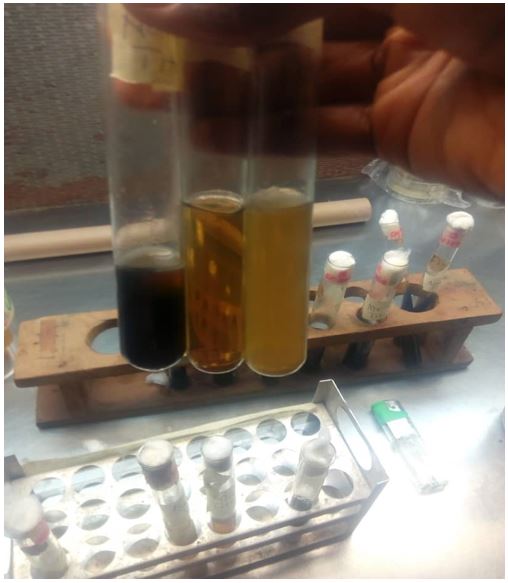
For the isolation process, 20g of soil sample were weighed into 40ml of distilled water in a clean conical flask and was shaken vigorously (stock solution). From the stock solution prepared, ten folds serial dilution were carried out and the 10-4 to 10-6 dilutions were plated out in a media plate.
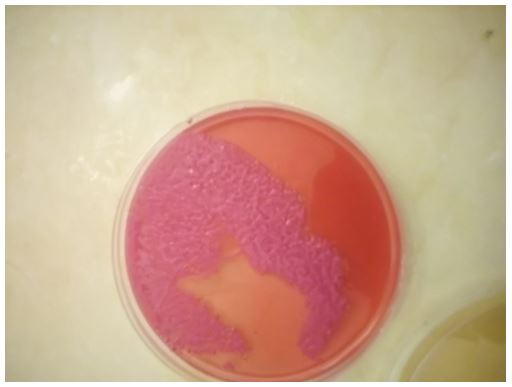
Three day old pure cultures were examined both under the microscope and by physical examinations. The colour, texture, spores and growth patterns were also to be observed.
The three days old pure cultures were used in preparing microscopic slides described by [15]. Prior to the microscopic examinations of the microbial isolates, gram staining was carried out on the colonies to distinguish the gram positive bacteria from the gram negative ones.
After the gram staining, an alqoute of the culture suspensions was dropped on the slide and a drop of safranine red was added to it. A cover slip was placed over it and examination was performed under the light microscope at X100 magnification. Microbial isolates identification was carried out by relating the microbial features and images of the micrographs to “Atlas of Bacteriology” by Barnett and Hunters (1972).
Biochemical test of each of the organisms were carried out as described by [15, 16,] Mamta et al. (2010) as follows:
• Catalase Test
• Citrate Utilization Test
• Indole Test
• Methy red-Voges Proskauer (MRVP) test
• Motility and Hydrogen sulphide production
• Sugar Fermentation Test
Total heterotrophic colonies (CFU/g) from both the nutrient, Mackonkey and the differential media were counted from the grown media plate as described as follow:
Three day old pure cultures were examined both under the microscope and by physical examinations. The colour, texture, spores and growth patterns were also to be observed.
TCFU/ml= microbiol colonies observed X innoculum dilution factor X innoculum volume pippetted
Where TFCU/ml is total coliform unit per volume of the innoculum in mililitres.
The results of the physicochemical properties of soil samples from the mgbuka market located at Anambra state, Nigeria shows varying level of attributes which are significantly in variation from the control experiments. This variation owes to the fact on the impact of petroleum hydrocarbon in the soil of study.
Table 1 show the physicochemical properties of the soil sample from Mgbuka market located at Anambra state contaminated with petroleum oil.
Oil pollution has been recognized as the most significant contamination problem (Allaiges et al., 2006). These oil spills can cause severe damage to the land, sea and shoreline organisms (Pradecpt et al., 2011). Most responsible for the contamination are service stations, garages, scrap yards, waste treatment plants, sawmills and wood impregnation plants (Pradecpt et al., 2011). This study looked at assessing the impact of effluent from an automobile mechanic jetty site in Nigeria on the physicochemical properties of agricultural soil and related soil microorganisms. Soil samples were sampled and investigated. Physicochemical analysis of the soil showed pH of 4.24, in the presence of the control experiment which maintained a pH of 7.6 throughout the experiment. This can be attributed to the nature of the contaminant in the soil such as oil and other acidic compounds (oleic, benzoic acids) as stated in the proceedings of the ASTDR, 2009. Soil conductivity showed a progressive increase of soil conductivity Dissolved mineral contents were found in the following order: Cl>Ca>Cu>Fe>Mg>K>PO3 > Pb while heavy metals of Hg, As and Cd were found at below detectable limit range (BDL) in both the contaminated and non-contaminated soil. The concentration of Cl, Ca, Mg, K, PO3 and Pb increases. Fe showed an upward decrease in concentration. Petroleum effluents as stated by [9] contain numerous minerals which impound in any receiving body and increase the physicochemical properties of the body. The progressive decrease in the concentration of Fe can be attributed by the availability of masking elements such as oxygen, sulphur and other ligands which competitively bind to iron and diminishes their bioavailability.
Total organic matter (TOM) and total organic carbon (TOC) contents were found at 196.73 and 78.64. [17] in their study at the Eleme petrochemical jetting port site reported a similar correlation of ions concentrations in the contaminated Eleme port soil. They revealed a higher concentration of the mineral ions in the following order 2.28, 1.84, 5.22 and 1789.22 mg/g respectively for K, nitrate, magnesium and chloride ions.
Khalid et al.(2017) in their assessment study on soil pollution and Lead (Pb) accumulation revealed higher quotients of heavy metals like Fe, Pb and Cu in the soil while heavy metals of Hg, As, Cd were found below detectable limits in the soil.
The total petroleum hydrocarbon which depicts the entirety of petroleum hydrocarbons of poly aliphatic and polycyclic aromatic hydrocarbons (PAHs) contents are the major contents of crude oil spills implications [17]. Total petroleum hydrocarbon (TPH) of the contaminated soil was 1014.93 mg/g respectively. This showed a strong significant different from the control experiments in all the tested samples [18-20].
Soil organisms are responsible for many biogeochemical and metabolic activities in the soil, it is noteworthy to recall that organisms are like vessels carrying proteins known as enzymes. They are significant indicators in the soil against influx and out way of minerals in the soil. [21-25] Analysis of soil micorganism in the experimented soil samples contaminated with petroleum effluent showed a significant reduction of the soil organism as the effluent increases. However, there was a noticeable increase in the proliferation of the organisms contaminated with petroleum effluent incubated from day 0-7 but a decrease from 14 – 21 days of incubation.
Biochemical observation of bacteria isolates as depicted in table 3 shows much organismal presence of strains of Bacillus, Lactobacillus sp in both the polluted soil from Mgbuka and the control experiment respectively. However, there were recorded high proliferation of Pseudomonas and Klebsiella from the spent engine polluted soil. [25-28] It will be recalled that Adieze et al (2010) stated that strains of Pseudomonas sp and Klebsiella sp are rugged hydrocarbonolistic bacteria that survive in a crude oil polluted soil. They utilized the carbons of the petroleum compounds as their sole carbon source(s). As stated by [15], Adieze et al. (2010) soil physicochemical components including those of soil structures, texture affect the inhabitant organisms domicile in the soil and such influences their proliferation and doubling.
The present research has shown with analysed empirical the presence of certain recalcitrants in petroleum oil implicated contamination of soil from mgbuka market, Anambra state, Nigeria on agricultural soil. Petroleum hydrocarbon compounds of polycyclic aromatic hydrocarbons were estimated in the respective soil samples and at; The afore with data will provide the health and risk assessment of inhabitants of concerned community moreso the present study has shown the level of pollution of the community agricultural soil.
The present research on Mgbuka soil in Anambra state was fostered courtesy of funds from Tertiary Education Trust fund (TET fund) through institution based research grant (IBR) intervention funds. Ref: (TETF/DR&D/CE/UNIV/AWKA/IBR/2020/VOL II).
Ezenwelu Chijioke O (PhD) (co.ezenwelu@unizik.edu.ng): Conceived and designed the experiments, performed the experiment and processed the data, analyzed the data and wrote the manuscript.
Aribodo O (og.aribodo@unizik.edu.ng): Revised the manuscript and performed the experiment
Ezeonyejiaku C (cd.ezeonyejiaku@unizik.edu.ng): Guided the experimental design and processed the data.
Okafor, S (si.okafor@stu.unizik.edu.ng): Performed the experiment and the guide experimental design
Oparaji Emeka H: Processed the data and wrote the manuscript.
Authors declared no ethical issues that may arise after the publication of this manuscript.
The authors appreciate the staff and management of tertiary education trust fund (TETFUND) and Applied Biochemistry, Nnamdi Azikiwe University Awka Anambra state for providing the enabling laboratory where the analysis and further experimentations were carried out