Awareness - A Missing Link in Treatment of Hepatitis B
Introduction: Hepatitis B has become significant health problem globally leading to substantial morbidity and mortality, thus causing enormous burden on the health care system. Once, these infections progress to chronic phase then further complication arise like cirrhosis and hepatocellular carcinoma (H.C.C)
Aim: The aim of study was to assess the awareness of Hepatitis B in patients suffering from it and reporting for treatment at Model treatment Centre (MTC), PGIMS, Rohtak.
Material and Methods: This was a prospective study conducted over a period of five years i.e. 01.01.2017 to 01.01.2022 at MTC, PGIMS, Rohtak. Four thousand eight hundred and twentyeight patients of Hepatitis B who were confirmed on ELISA (Enzyme linked immunosorbent assay) and HBV DNA Quantitative test were enrolled in the study after proper consent. A multiple choice structured questionnaires about Hepatitis B was put to the patients and their responses were recorded by the team at MTC which included Gastroenterologist. The team assessed knowledge and awareness about hepatitis B infection, transmission, screening and vaccination against hepatitis B was the tool of data collection.
Results: Most of the HBV patients were unaware about existence of hepatitis B infection, modes of transmission, treatment and vaccination of hepatitis B. A direct positive correlation was found between education level and awareness, which reveals that patients with better knowledge and information had better attitudes toward the infection and prevention of hepatitis transmission.
Conclusion: There is urgent and strong need for increasing the level of awareness about HBV infection not only in patients suffering from them but also among their family members and general society.
Keywords:Hepatitis B, Awareness, Hepatitis B Vaccination, Screening, Vertical transmission
Hepatitis B has reached position of becoming significant health problems globally leading to substantial morbidity and mortality, thus causing enormous burden on the health care system. Once, these infections reach chronic phase then further complication arise like cirrhosis and hepatocellular carcinoma (H.C.C) [1]. As per WHO 2016 report, Chronic hepatitis B infection occurs in about 350 million people with more than 6 lakhs deaths each year and about 3% of the world population has been infected with HCV worldwide with more than 170 million chronic carriers and 3.5 lakhs deaths every year [2]. According to the WHO, India is having intermediate prevalence of Hepatitis B i.e. approximately 4%. It is always said that prevention is better than cure, hence awareness about various aspects about hepatitis B including route of transmission, spread, impact on human body, treatment and vaccination in general public is a major challenge pan globally, especially in developing countries like India and should form the basis of health care policies. In India, maximum number of patients of Hepatitis B are illiterate, belong to rural background with poor socio-economic status and minimal health care facilities exist at that level. Thus, due to above explained limitations, there is minimal awareness about hepatitis B even among the patients who are themselves suffering from these deadly diseases. The obstacle of illiteracy and poor health care facility at rural level can be overcome by initial determination of awareness about hepatitis B followed by spread of awareness in these patients, their family members and general society. Therefore, it is very important to assess the awareness, knowledge and attitude about these diseases in public in India for future health policy planning as well as its implementation.
The aim of study was to assess the Awareness of Hepatitis B in patients suffering from it and reporting for treatment at MTC, PGIMS, Rohtak.
This was a prospective study conducted over a period of five years i.e. 01.01.2017 to 01.01.2022 at MTC, PGIMS, Rohtak. Four thousand eight hundred and twenty eight patients of Hepatitis B who were confirmed on ELISA (Enzyme linked immunosorbent assay) and HBV DNA Quantitative test were enrolled in the study after proper consent. A multiple choice structured question- naires about Hepatitis B was put to patients and their responses were recorded by the team at MTC which included Gastroenter- ologist. The team assessed knowledge and awareness about hepatitis B infection, mode of transmission, screening, treatment and vaccination against hepatitis B.
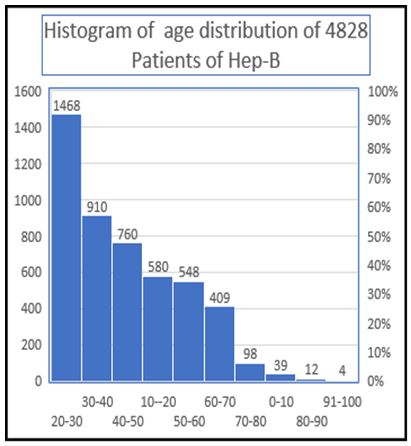
In our study, 4828 patients of hepatitis B were enrolled and data pertaining to them was analyzed. The age distribution was from 1-100 yrs of age and maximum number of patients were between 20-50 yrs of age group (65%) with minimal representation from extremes of ages (See Figure 1 and Table 1). When sex distribution was analyzed then strikingly 3224 patients (67%) were males and only 1604 patients (33%) were females (See Table 3). On analysis of socio-economic background, 3380 patients (70%) were from rural background with poor socio-economic status and rest 1448 patients (30%) belonged to urban population with proper standard of living (See Table 3). In our study, 40% (1931) patients gave history of Parenteral injections, dental or any other surgical interventions & tattooing. Around 148 patients (3.06% ) were detected during blood donation and out of total pool of 4828 pa- tients, 70 pregnant females were found positive for HbsAg. On analysis of clinical stages of diseases, out of total 4828 ,maximum number of hepatitis B patients were chronic hepatitis B but in inactive carrier state i.e. 3646 patients (76%) and did not require any treatment (See Table 2). In total 700 patients (14%) of chronic hepatitis B were found to be in active phase and were started on treatment. In total pool of 4828 patients, only 1.47% were found to be cirrhotic and on analyzing in treatment group, then out of total 700 patients who required treatment, the contribution of these 71 patients is around 10.14% only. The acute hepatitis B state was seen in 482 patients i.e. 10% of total patients of hepatitis B. In our study group, majority of patients belonged to younger age group, were males, residing in rural background, with poor socio-economic status and 79.43% were illiterate The Knowledge of correct mode of transmission i.e. through blood contamination and sexual route was seen in only 320 patients (6.62% (See Table 4). The availability of effective treatment was known to only 1022 (21.66%). In our study group, only 5% of patients knew about vertical transmission from pregnant mother to new born. Out of these 5%, only 3% were aware about availability of hepatitis B treatment during pregnancy, need of hepatitis B immunoglobulin to new born and importance of hospital based delivery. Out of total pool of 4828 patients, only 402 (8.32%) were aware about hepatitis B vaccination.
HBV infection remains a serious threat to the general public in our country although vaccine is available against it. This study was a patient-based questionnaire survey determining the knowledge, awareness, and practices in regard to HBV infection at ter- tiary care centre of Northeren India. There are studies in literature about awareness of HBV infection in health care workers and general society but there is paucity of such awareness data in HBV patients. Hence, the need of conducting this study. The results revealed a negative association of low educational level and poor health care facility and good HBV knowledge. The vaccination for HBV in the past and the willingness for further investigations, screening and vaccination on HBV were independently associ- ated with good knowledge. In our study group, majority of patients belonged to younger age group, were males, residing in rural background, with poor socio-economic status and 79.43% were illiterate. Out of total pool of 4828 patients, only, 966 ( 20% ) had heard about hepatitis B in past. This is in contrast to the study reported by Misra et al in coastal Eastern India and by Taylor et al among Cambodian Americans, in which 78% had heard about the disease earlier [3,4]. Our observations are in concordance with the above two studies which stated that those who were highly educated were more aware of HBV infection, its transmission and prevention. The Knowledge of correct mode of transmission i.e. through blood contamination and sexual route was seen in only 320 patients (6.62%) but in rest majority of 4508 patients (93.38%), they thought that infected water and food is route of transmission for Hepatitis B. They even thought that even sharing utensils and toilets cal lead to spread of hepatitis B infection. The low percentage of patients in our study group having knowledge of sexual route of transmission is in contrast with a study in France where about 70% of the French respondents reported that hepatitis B could be transmitted sexually. Similar findings were observed in other European studies: 63% and 78%, respectively, in Germany and the Netherlands [5]. In our study group, only 5% of patients knew about vertical transmission from pregnant mother to new born. Out of these 5%, only 3% were aware about availability of hepatitis B treatment during pregnancy, need of hepatitis B immunoglobulin to new born and importance of hospital based delivery. Majority of patients thought that breast feeding should not be given to avoid transmission of infection to the child. Out of total pool of 4828 patients, only 402 (8.32%) were aware about hepatitis B vaccination and even in those, half of them thought that vaccination can be given to infected patients for decreasing ill effects of hepatitis B infection on various parts of body. Our study is in concordance with other studies done in past emphasizing unawareness, ignorance and inaccessibility of these vaccines in rural or peripheral urban areas [6,7]. The availability of effective treatment was known to only 1022 (21.66%) patients and rest majority of patients thought that there is no treatment available for controlling hepatitis B infection and its im- pact on liver. One thing prominently noted that majority of patients related hepatitis B infection to Jaundice. Thus, acute hepatitis B patients believed easily that they are infected with this virus but in majority of inactive carrier patients who were asymptomatic, took time to accept that how they can be having hepatitis B without having any symptoms including jaundice. The positive cor- relations between knowledge and practice in this study reaffirm the relationship between knowledge and practice with infection control measures. Thus adequate knowledge can lead to good practices. At Indian & Haryana Government level, seeing the dismal situation of awareness about the parental illness in the patients of hepatitis B, many steps have been taken for improving the same by means of distribution of pamphlets, placement of hoardings, calendars & bill boards in various government hospitals & public places, regular publication of articles in print media and distribution of drugs in carry bags having information about hepatitis B and availability of free treatment at Government hospitals. The Government has even started toll free helpline from which anybody can gather information round the clock. At our department, we generate awareness in all the hepatitis B patients and their relatives on first visit and as a policy enquire about knowledge retained on subsequent visits. Majority of patients remember about awareness aspects and only minimal percentage who are illiterate have to be reinforced about various aspects of hepatitis B.
Our study concludes that there is poor knowledge and awareness among hepatitis B patients about their illness, complications, mode of transmission, prevention and availability of vaccine for hepatitis B. As prevention is always better than cure, thus onus lies on the state and treating physicians for taking urgent meaningful steps for increasing awareness about this deadly infection, so as to break the transmission chain. Moreover, there should be strict compliance of hepatitis B vaccination in high risk groups including health care workers. The goal should not be limited to just treatment of the confirmed patients but should be extended for stoppage of transmission from them to others. The knowledge about hepatitis B can be increased with help of mass media, internet, health education programme and regular conduction of workshops. The majority of patients are inactive carrier and asymptomatic, thus testing for HBV infection in high risk groups and hotspot areas, is the gateway for access to both prevention and treatment services and is an essential component of controlling hepatitis B epidemic. Testing provides an opportunity to link people to interventions to reduce transmission, through counselling on risk behaviors and Vaccination.