Biomonitoring of Heavy Metals Genotoxicity in Tunisian Costal Using the Comet Assay in the European Clam Ruditapes Decussatus
Heavy metal pollution of coastal water is a growing concern in most parts of the world. This paper aims to investigate the potential genotoxic effects due to heavy metals contamination of Tunisian coastal seawater using the European clam Ruditapes decussatus. Clams were exposed in situ to Monastir lagoon, Hergla and Chebba (reference site) waters for 24 and 48h. Chemical analysis by atomic absorption showed that Ruditapes decussatus have accumulated significant levels of heavy metals, especially of; zinc [Zn], copper [Cu], mercury [Hg] and lead [Pb]. The detected concentrations were proportional to the duration of exposure.
The induction of DNA damage in clam cells after exposition to different regions water (Hergla, Monastir lagoon and Chebba) for 48 h was assessed through the alkaline Comet assay. Results showed a significant increase of the total DNA damage, in clam’s cells exposed to Hergla and Monastir lagoon waters compared to negative control (Chebba) (118 ± 0.3 and 136 ± 12 Vs 83 ± 0.5, respectively). The percentage of genotoxicity was significantly higher in animals collected from Monastir lagoon (than those collected from Hergla water (63.85% vs. 42.16%, respectively).
Our results indicate that comet assay in the European clam Ruditapes decussatus can be a useful biomarker to assess the genotoxic risk of heavy metals coastal water contamination in Tunisia.
Keywords:Coastal Waters; Comet Assay; Genotoxicity; Heavy Metals; Ruditapes Decussatus
Estuaries are highly productive ecosystems that were frequently exposed to domestic waste, industrial effluents and many other pollutants that have a negative effect on both human health and the aquatic ecosystem. The ever increasing number of xenobiotic and the effects of physicochemical parameters on their availability to marine organisms greatly complicate monitoring based on chemical analyses.
Some of the chemicals, especially heavy metals, may be genotoxic to the sentinel species and/or to non-target species, causing deleterious effects in somatic or germ cells. Techniques that help in hazard prediction and risk assessment are important to assess the genotoxic potential effect of chemicals before their release into the environment or commercial use as well as DNA damage in flora and fauna affected by contaminated habitats. In the recent years, the comet assay has been widely accepted as a simple, sensitive, and rapid tool for assessing DNA damage and repair in eukaryotic individual as well as in some prokaryotic cells, and has increasingly found application in diverse fields ranging from genetic toxicology to human epidemiology [1,2].
Shellfish are usually used as metal pollution indicators because they are considered as excellent accumulators. Often, it is possible to detect metal pollutants in shellfish even if their concentrations in water are very low or very variable. However it is difficult to determine this contamination levels reliably by routine chemical analysis [3].
The genotoxicity assessment in marine and freshwater invertebrates using the comet assay has been reviewed [4-8]. Cells from hemolymph, embryos, gills, digestive glands, and coelomocytes from mussels (Mytilus edulis); [9], zebra mussel (Dreissena polymorpha), clams (Myaarenaria), and polychaetes (Nereisvirens) have been used for eco-genotoxicity studies using the comet assay.
The Comet assay has been employed to assess the extent of DNA damage at polluted sites compared to reference sites in the environment, and in the laboratory, it has been widely used as a mechanistic tool to determine pollutant effects and mechanisms of DNA damage [10].
Hergla and Monastir are two sites that are very concerned by the pollution in Tunisia and their ecosystems seem to be seriously affected due to industrialization and urbanization occurring during the past few decades. The contaminants in the coastal water are increasing day by day, thereby causing genotoxicity in the aquatic organisms and adversely affecting their diversity; hence, they are of significance. Keeping view of the facts, the present study was conducted with the aim to investigate the DNA damage due to heavy metals contamination of Tunisian coastal seawater using the comet assay in European clam Ruditapes decussatus following in situ exposure to polluted waters of two sites in Tunisian coast.
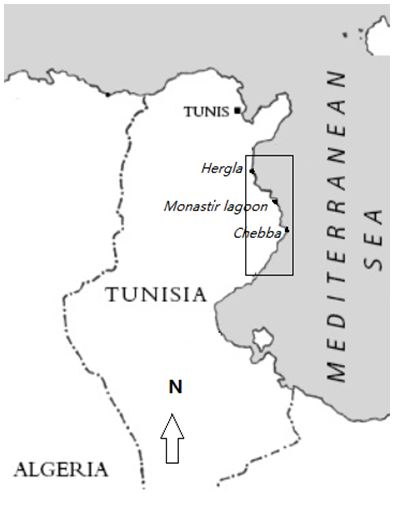
Three sites in mid-Tunisia were chosen in this study (Figure 1); two contaminated sites (Hergla and Monastir lagoon) and a clean reference site (Chebba). Monastir lagoon seems to be relatively polluted with the textile industry as a principal contamination source, however the Chebba site seems to be relatively unpolluted since no contamination source is present [11,12].
For chemical analysis, water was sampled in 250ml polypropylene flasks and stored at 4 °C. All flasks used were previously already washed with ultrapure acids. The hydrographic conditions (temperature, salinity, pH and dissolved oxygen) were analyzed in situ by means of Orion and Hanna electrodes.
European clams, Ruditapes decussatus, of known history (3 years age) were obtained from a commercial hatchery on the center of Tunisia. The animals were transported to the laboratory and acclimated in aerated seawater (30 ± 2%) for 48 h prior to in situ exposure. The mean shell length and weight of the animals at the start of this study was (30 ± 5 mm) and (8 ± 2g), respectively. Clams were selected and placed in a plastic net bag (20 clams/bag) for in situ exposure in each site. The experiment is conducted in triplicate (Three net bags per site).
After freezing, a pooled out of five clams tissues per net bag (n = 15) were lyophilized and homogenized using a ball mill made of agate. The total element analyses were performed with 0.2g of freeze-dried tissue sample digested at 180 °C for 20min, using high pressure Teflon reactors and 6ml concentrated nitric acid (HNO3) in microwave (Millestone, type Ethos) oven system. After digestion, samples were transferred to 50ml flasks and the volume was adjusted to 50ml using Milli-Q water.
After filtration, the metal samples were extracted by using ammonium pyrrolidine dithio carbamate (APDC) and methyl isobutyl ketone (MIBK) and the heavy metals in the clams chair were estimated according to the method of Tewari, et al. [13]. The samples were examined for Cu, Pb and Zn using an air-acetylene flame atomic absorption spectrophotometer (AAS; Spectra AA-10 Varian). Mercury was analyzed by automated cold vapor AAS, according to Weltz and Schubert-Jacobs [14]. To avoid contamination, all glassware and equipment used were acid-washed. To check for contamination, procedural blanks were analyzed once for every five samples.
The analytical and quality assurance was performed by analyzing certified reference materials of shellfish tissue (International Atomic Energy Agency (IAEA 407)) duplicate samples and individual blanks. The analytical results indicated correlation with the certified values and the recovery of metals near quantitative (95%) for most of analyses. All metal concentrations are reported in μg/g of dry weight of sample. Values represent the mean of three independent extractions from the tissue samples.
The limit of detection (LOD), expressed in μg/g dry weight, was 0.003 for Cu, 0.004 for Hg, 0.02 for Pb and 0.02 for Zn.
The comet assay with cells of fresh clam chair was used to detect DNA damage. Before each experiment, frosted microscope slides were pre-coated with 2 layers (10μl) of normal agarose (1% in milli-Q water) and left at room temperature to allow agarose to dry. The cells of fresh chair from the clam Ruditapes decussatus were isolated carefully and then minced in phosphate-buffered saline (PBS) with forceps. 5μl of cell dilution was mixed with 120μl of low-melting-point agarose (1.2% in PBS). The agarose cell suspension (125μl) was spread onto each pre-coated slide and covered with a cover slip. After 10 min on ice, the cover slip was gently removed, and the slides were placed in a tank filled with the lysis buffer (2.5 M NaCl, 100 mM/l EDTA, 10 mM/l Tris–HCl, 1% sodium sarcosinate pH 10, 1% of Triton X-100, and 10% DMSO). They were immersed for 1 h in this buffer (4 °C, in the dark). The slides were then transferred into the electrophoresis buffer (NaOH 10 N, EDTA 200 mmol/l, pH 13 in deionized water) during 20min at room temperature in the dark. Electrophoresis was carried out for 15 min at 25V, 300mA [15]. Finally, the slides were gently rinsed with neutralization solution (0.4 M Tris–HCl, pH 7.5) 3 times for 5min each time. Staining of DNA was accomplished using 50μl of ethidium bromide solution at 20μg/ml in PBS per slide [16]. The slides were examined using an epifluorescence microscope (Zeiss Axioskop 20; Carl Zeiss, Microscope Division, Oberkochen, Germany).
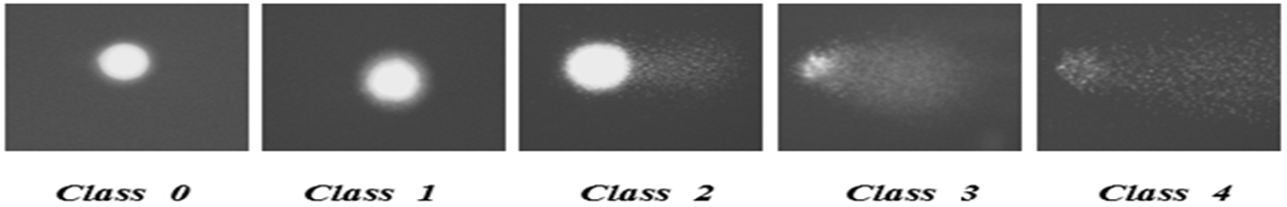
A total of 100 comets on each scored slide were visually scored according to the relative intensity of fluorescence in the tail and classified as belonging to one of five classes. We use three slides for each site, and the experiments were repeated three times. Each comet class was given a value of 0, 1, 2, 3, or 4 (from undamaged, 0 to maximally damaged, 4) as described previously by Collins, et al. [17]. The total score of DNA damage was determined by the following equation:
Total DNA Damage (TDD) = Percentage of cells in class 0×0 + Percentage of cells in class 1×1 + Percentage of cells in class 2×2 + Percentage of cells in class 3×3 + Percentage of cells in class 4×4. (Equation 1)
The percentage of Tail DNA (%) was calculated by the following formula:
The percentage of Tail DNA = [(TDD of exposed cells in zone of Hergla or Monastir lagoon −TDD of exposed cells to water of Chebba sea (negative control)) / (TDD of negative control)] × 100. (Equation 2) [18].
DNA damage was expressed as Tail Moment (TM), which was determined as the product of the tail length and the fraction of DNA in the tail and measured using the imaging analysis. The data were statistically analyzed using a non-parametric ANOVA test followed by Bonferroni’s multiple comparisons test. Differences were considered significant when p ≤ 0.05.
Heavy metals concentrations in the clam tissue were shown in the Table 1 and Table 2. After 24 and 48 h of in situ exposure, four heavy metals (Zn, Pb, Cu and Hg) were detected in the clam tissue. Results showed that heavy metals concentrations were significantly (Anova, p < 0.05) higher in the Monastir lagoon. In the both sites, the copper showed the highest concentrations (4.77μg/g and 11μg/g) for Hergla and Monastir lagoon, respectively).
The induction of DNA damage in clam cells after exposition to different water regions (Hergla, Monastir lagoon and Chebba) for 48 H was assessed through the alkaline Comet assay. The results showed a significant higher total DNA damage in both cells of clams exposed to Hergla (118 ± 03) and Monastir lagoon (136 ±12) waters (Anova, p < 0.05) compared to negative control (Chebba) (83 ± 05, value indicating no significant damage observed) Table 3.
It is noteworthy that genotoxic potential is more obvious in clam cells exposed to Monastir lagoon water with a tail DNA damage of 63.85% which is higher than the results from Hergla water (42.16%). In the case of Monastir lagoon, we observed a prevalence of cells belonging to classes 3 and 4 in the intoxicated clam cells which explains the high level of genotoxic potential (Figure 2).
Pollution in estuarine and marine environments is considered a critical environmental issue due to anthropogenic pollution and to the high variation in several abiotic factors that impose severe restrictions to organisms living in these areas [19,20]. The present work is aimed to assess the pollution of two sites belonging to the Tunisian coasts using a genotoxicity assay (Comet assay) after in situ exposure of the clam Ruditapes decussatus to the waters of the chosen sites.
The concentrations of heavy metals bio accumulated in the clam soft tissue noted in this work confirmed the pollution status of the studied sites. In fact, the important trace metal concentrations recorded in Monastir lagoon were likely due to the high concentration of textile industries in this region. In fact, the Tunisian textile industries consume a large quantity of water (up to 150L of water to dye 1kg of cotton) and produce effluents (≈200 106 m3/year) that contain high quantities of trace metals (Zn, Cu, Pb, Fe) [21]. In addition, the heavy metal pollution in the Monastir lagoon was shown previously by Fathallah, et al. [22,11,12]. Concering Hergla site, it was characterized by lower heavy metals concentrations; this can be explained by the fact that the only source of heavy metals was domestic discharges and agriculture activity.
Recently, increasing concern about genotoxicity due to pollution in land and water has led to development of many mutagenesis test systems especially in marine organisms including bivalves that are reported to be suitable organisms for Eco toxicological studies and the detection of genotoxic agents [23-28] this is due to their important bioaccumulation capacity, respond to mutagens at low concentration such as environmental pollutants. In situ investigation of the effects of mutagenic pollution in terms of environmental bio-monitoring has been reported by many researchers [29-31].
In this study, the genotoxicity of heavy metal pollution was assessed in the clam Ruditapes decussates after a 48 h in situ exposure to waters of a polluted sites (Monastir lagoon and Hergla) and a ‘‘clean’’ reference site (Chebba). The comet assay was used to detect DNA damage in cells isolated from the soft tissue of the clam. This assay has been, previously, used to investigate levels of DNA damage in marine and fresh water bivalves exposed to water-borne pollutants [32,33,28].
Coughlan, et al. [34] showed that the comet assay could be used as a tool for the detection of DNA damage in clams (Tapes semidecussatus) as bio monitor organisms for sediments. Significant DNA strand breaks were observed in cells isolated from haemolymph, gill, and digestive gland from clams exposed to polluted sediment [34,35]. Comet assay was used for the assessment of sperm DNA quality of cryopreserved semen in Pacific oyster (Crassostreagigas), as it is widely used for artificial fertilization [36]. Gielazyn, et al. [37] demonstrated the use of lesion-specific DNA repair enzyme formamidopyrimidine glycosylase (Fpg) to enhance the usefulness and sensitivity of the Comet assay in studying oxidative DNA damage in isolated hemocytes from oyster (Crassostreavirginica) and clam (Mercenariamercenaria).
A decrease of DNA integrity was observed both in clams caged in Monastir lagoon and Hegla site with a percentage of genotoxicity of 63.85 and 42.16%, respectively. A significant positive correlation was observed between chemical analyses of the clam soft tissue (bioaccumulation) and the DNA damage percentages (Comet assay).
The heavy metals have a tendency to bind to phosphates and a wide variety of organic molecules, including base residues of DNA, which can lead to mutations by altering primary and secondary structures of the DNA [38]. Exposure to such anthropogenic chemicals can have mutagenic and carcinogenic effects, often inducing cancerous diseases [39].
The DNA damage resulting from contaminant exposure is a key factor when assessing the general health of an organism, the fact that in this study genetic damage was identified in clams exposed to water with relatively low pollution levels (Hergla), suggests that higher levels of pollution are likely to affect the population and distribution of clams in more polluted estuarine ecosystems.
In this study we revealed that the coastal water in Monastir lagoon and Hergla sites in Tunisia is being contaminated with heavy metals which probably result from industrial and domestic activities; with a potential genotoxic effect. We also demonstrated that the Comet assay can be adapted to assess DNA damage in clams following chronic in situ exposure to polluted waters and we conclude that the clam Ruditapes decussatus has a higher sensitivity to genotoxic pollutant even after a short time of exposure. Thus, we suggest its application as a biological marker of genotoxicity for bio-monitoring of water bodies and for early detection of aquatic environmental problems. Our result further requires immediate measures are needed to reduce the inflow of pollutants in the coastal water.