CT Gently: Personalizing CT and CBCT Imaging for the Children
Medical imaging procedures such as computed tomography (CT) and cone-beam computed tomography (CBCT) have been widely used in the diagnosis, detection and treatments of cancers worldwide. The achieved efficiency in the clinical workflow and improved patient care come at a price of radiation doses that pose potential cancer risks to the patients, especially the children who are more susceptible to the radiation damage than the adults. To address this concern, we have newly developed an iPhone app termed CT Gently that can be used to estimate the organ doses and associated cancer risk from CT and CBCT scans based on individual anatomy and scan mode. Furthermore, the CT Gently app can generate optimized mAs and kVp settings for personalized low-dose CT and CBCT scans, essential to the children undergoing these imaging procedures. The increasing radiation exposure to the large population including millions of children necessitates the applications of personalized CT and CBCT imaging for the children as well as the adults.
Keywords: Computed tomography; Cone-beam computed tomography; Radiation dose; Cancer risk; Personalized imaging
In the past decade, computed tomography (CT) has been widely used in many kinds of diagnostic procedures both in the United States and other countries [1]. It is estimated that more than 76 million CT scans were performed in the United States alone in 2013, as compared to about 3 million CT scans in 1980 [2]. This dramatic increase has been largely driven by the advancements in CT technology which make CT imaging highly accessible and streamlined, for both the clinicians and the patients. The very past decade has also seen the dramatic increase in the applications of cone-beam computed tomography (CBCT) in the radiotherapeutic management of cancers [3]. Both technologies involve the use of kilo-voltage x-rays to reconstruct 3D images of the anatomy. Although implemented differently in the clinic, the radiation dose from both CT and CBCT scans has been a great concern among the clinicians and the general public, particularly to the children, who are far more susceptible than the adults to the radiation-induced late effects such as growth retardation and second malignancies [1,4].
Due to some historical reasons and clinical practicality, modern CT and CBCT manufacturers do not provide the absorbed radiation doses to the organs directly. Rather, a quality control metric called CT Dose Index (CTDI) has been widely used in categorizing radiation doses from various CT and CBCT scanners, which unfortunately does not reflect the actual dose received by a particular patient [5]. On the other hand, it becomes more and more necessary to register a patient’s organ dose information with a specific imaging procedure so that informed decisions on subsequent imaging procedures and radiation treatments can be made based on detailed knowledge of cumulative doses from various imaging modalities to various organs of individual patient. To fill in this void, we have recently developed an easy-to-use iPhone app called CT Gently that can be used to estimate the organ dose directly from an imaging procedure given the scan settings and one’s anthropometric information.
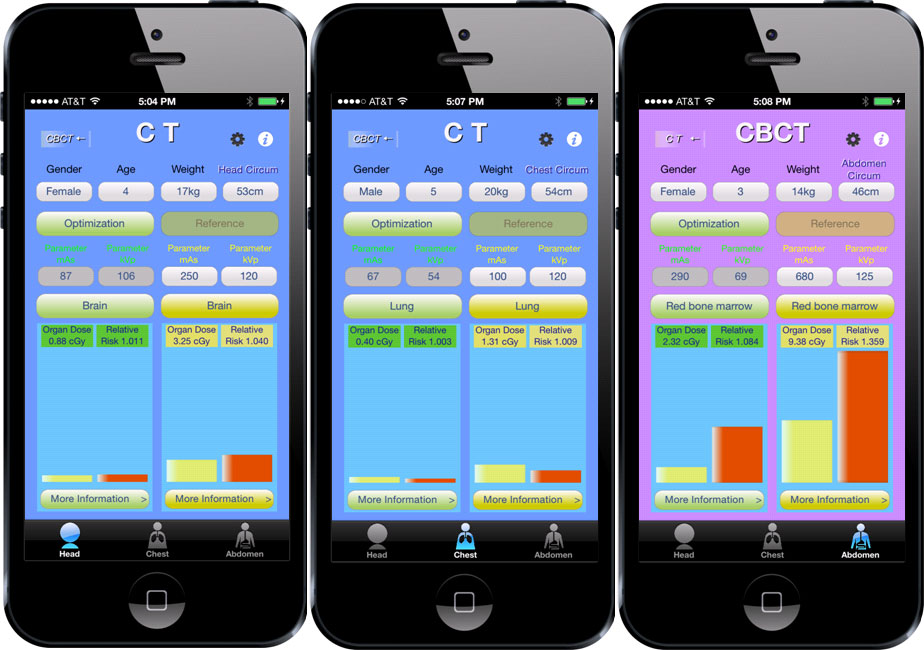
As shown in Figure 1, CT Gently currently runs on an Apple iPhone platform. The graphical user interface (GUI) is designed in such a way to maintain simplicity and efficiency. To start with, the user first dials in gender, age, weight, the corresponding circumference at three anatomic sites (i.e., head, chest and abdomen). Given mAs and kVp values, CT Gently can then generate comparative results both quantitatively and graphically on the organ doses and the associated cancer risks between the reference and the optimized settings for a CT or CBCT scan. Although the scanner-specific features such as filtration design and inherent x-ray tube output may play an important role in determining the organ dose, we intentionally limit the user’s choices to mAs and kVp settings to make this app simple and easy to use. As the Apple iPhone is highly popular around the world, an iPhone app designed for such a purpose would be ideal to maximize its accessibility to the general public as well as medical practitioners.
As there are numerous CT and CBCT scanner models available in the market, it is important to realize that the results reported in this app are scanner-dependent. That is, for CT scans, the results are based on a Siemens Somatom Sensation 16 scanner while a Varian On-board Imager system has been used as a base model for CBCT scans. If the user’s model is different from the base model, a normalization factor (CTDIvol, base / CTDIvol, user) will be required to convert the organ dose reported for the base model in the app to the user’s model.
Based on Monte Carlo modeling of the CT and CBCT scans and particle transport simulation in human anatomy of various dimensions, the radiation doses to the various organs-at-risk (OARs) at the head, the chest and the abdomen regions can be obtained for a specific scan of given mAs and kVp values [6-13]. In addition, personalized estimation of organ dose has been made possible based on previous cohort studies investigating the correlations between the organ dose and the weight, circumference, and scan settings such as mAs and kVp [10-13]. Finally, correlations between the organ dose and the scan settings as well as anthropometric parameters have been formulated and implemented in CT Gently to facilitate patient-specific organ dose estimation.
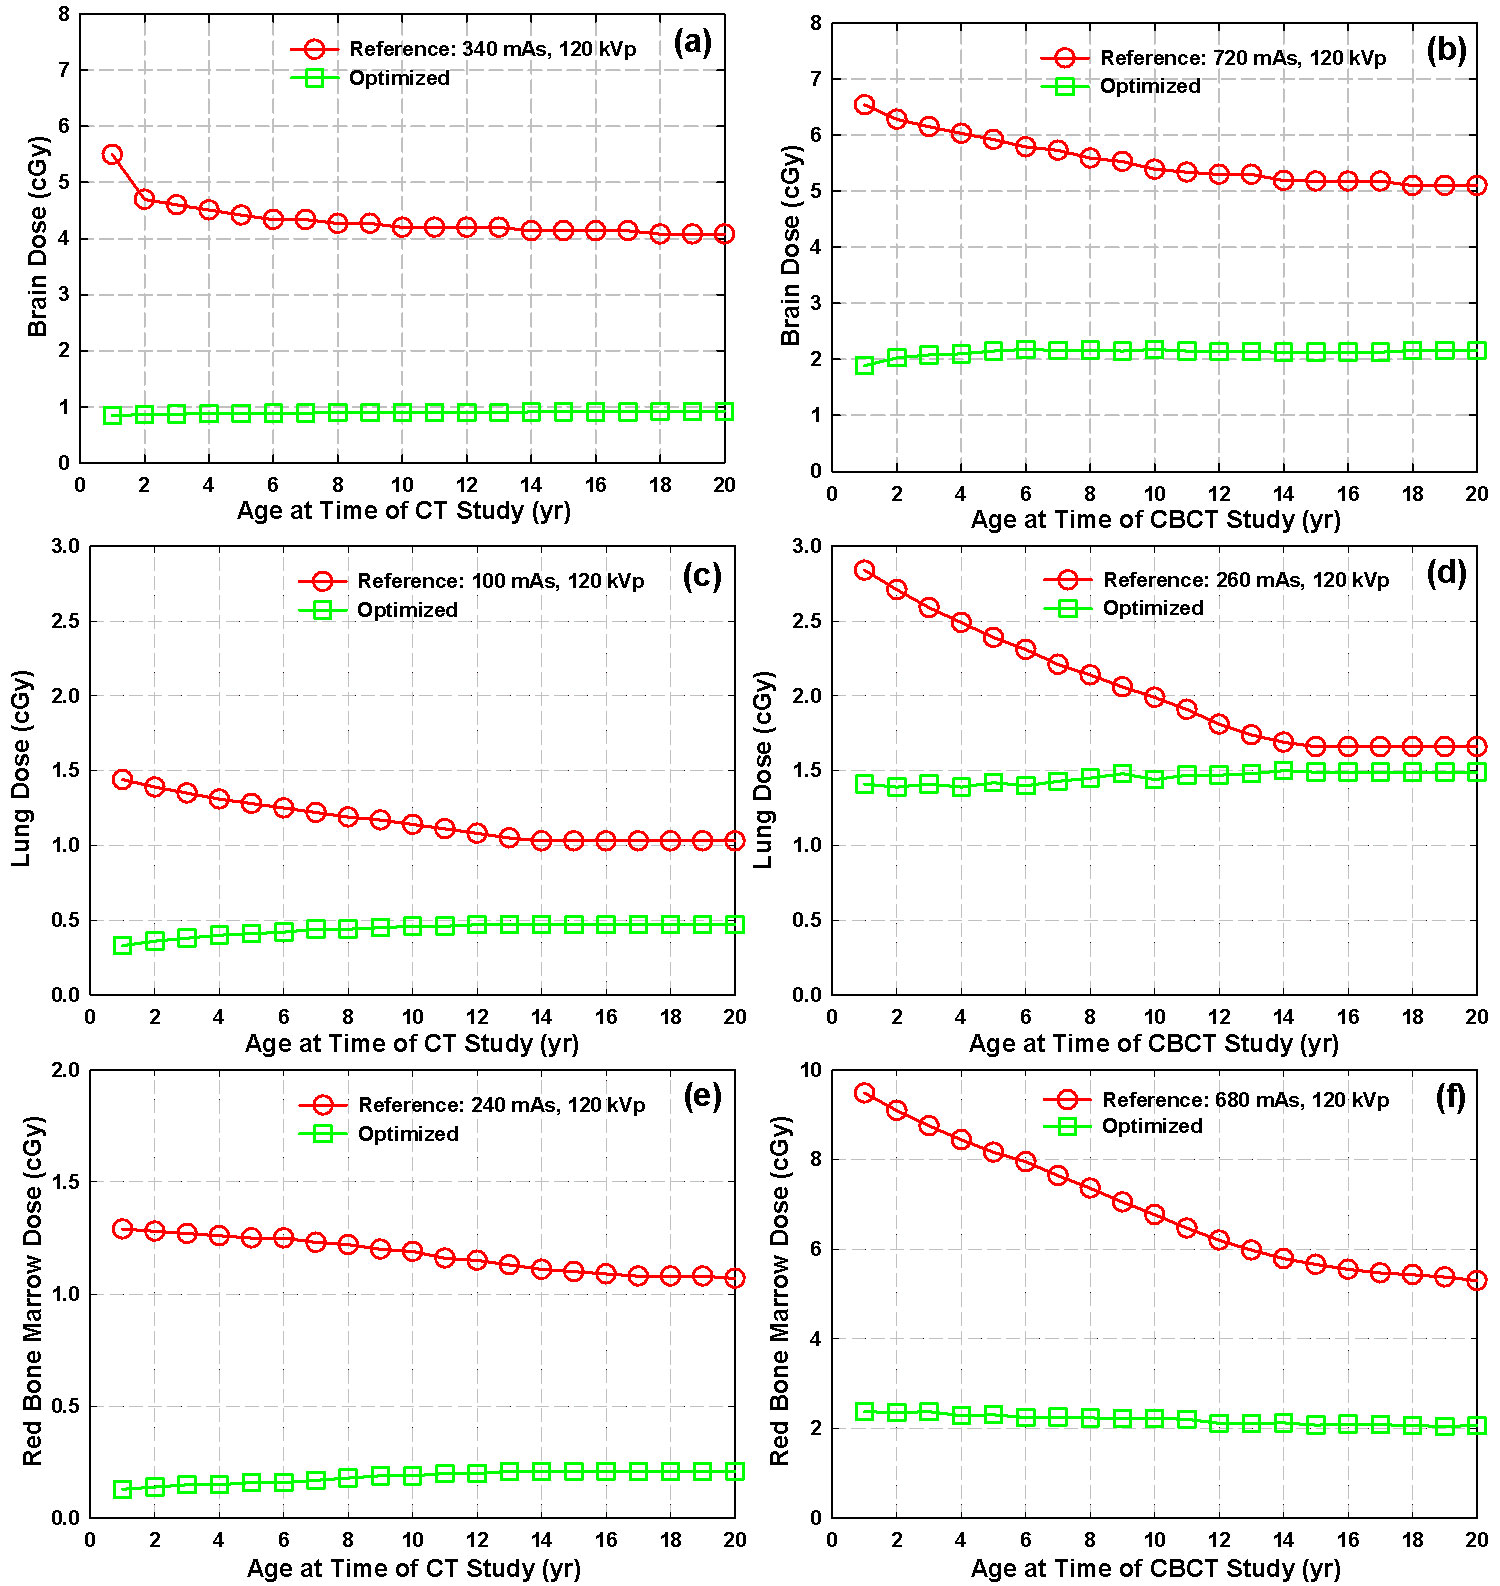
As shown in Figure 2, the mean doses to the brain, the lungs and the red bone marrow from a typical CT scan (reference settings) would be 4.4 cGy, 1.3 cGy and 1.3 cGy, respectively to a 5-year old girl. On the other hand, a typical CBCT scan would deposit 5.9, 2.4 and 8.2 cGy to the brain, the lungs and the red bone marrow of the same child, respectively. On average, a typical CBCT scan would deposit 28% more doses to the brain, 76% more doses to the lungs and 480% more doses to the red bone morrow of the children, respectively, as compared to a typical CT scan. The larger organ doses from CBCT scans are caused by the higher mAs settings used in the clinic.
Besides the reference settings which are the pre-defined settings from a scan protocol or a manufacturer, or a scan setting indicated by the user, a scan optimizer has been implemented in the CT Gently app to generate the optimized mAs and kVp settings for low-dose CT and CBCT scans based on the user’s input. The optimizer works in such a way that almost constant low dose will be maintained for the specific organ-at-risk with uniform noise property, irrespective of one’s physical dimension. In general, the optimized settings would reduce the doses to the OARs by 30-85% in comparison to the reference settings, as indicated in Figure 2.
The National Research Council of the United States issues a series of publications concerning radiation health effects under the title of Biologic Effects of Ionizing Radiation (BEIR). BEIR VII is the most up-to-date and comprehensive risk estimates for cancer and other health effects from exposure to low-level ionizing radiation [14]. It is among the first reports of its kind to include detailed estimates for cancer incidence in addition to cancer mortality.
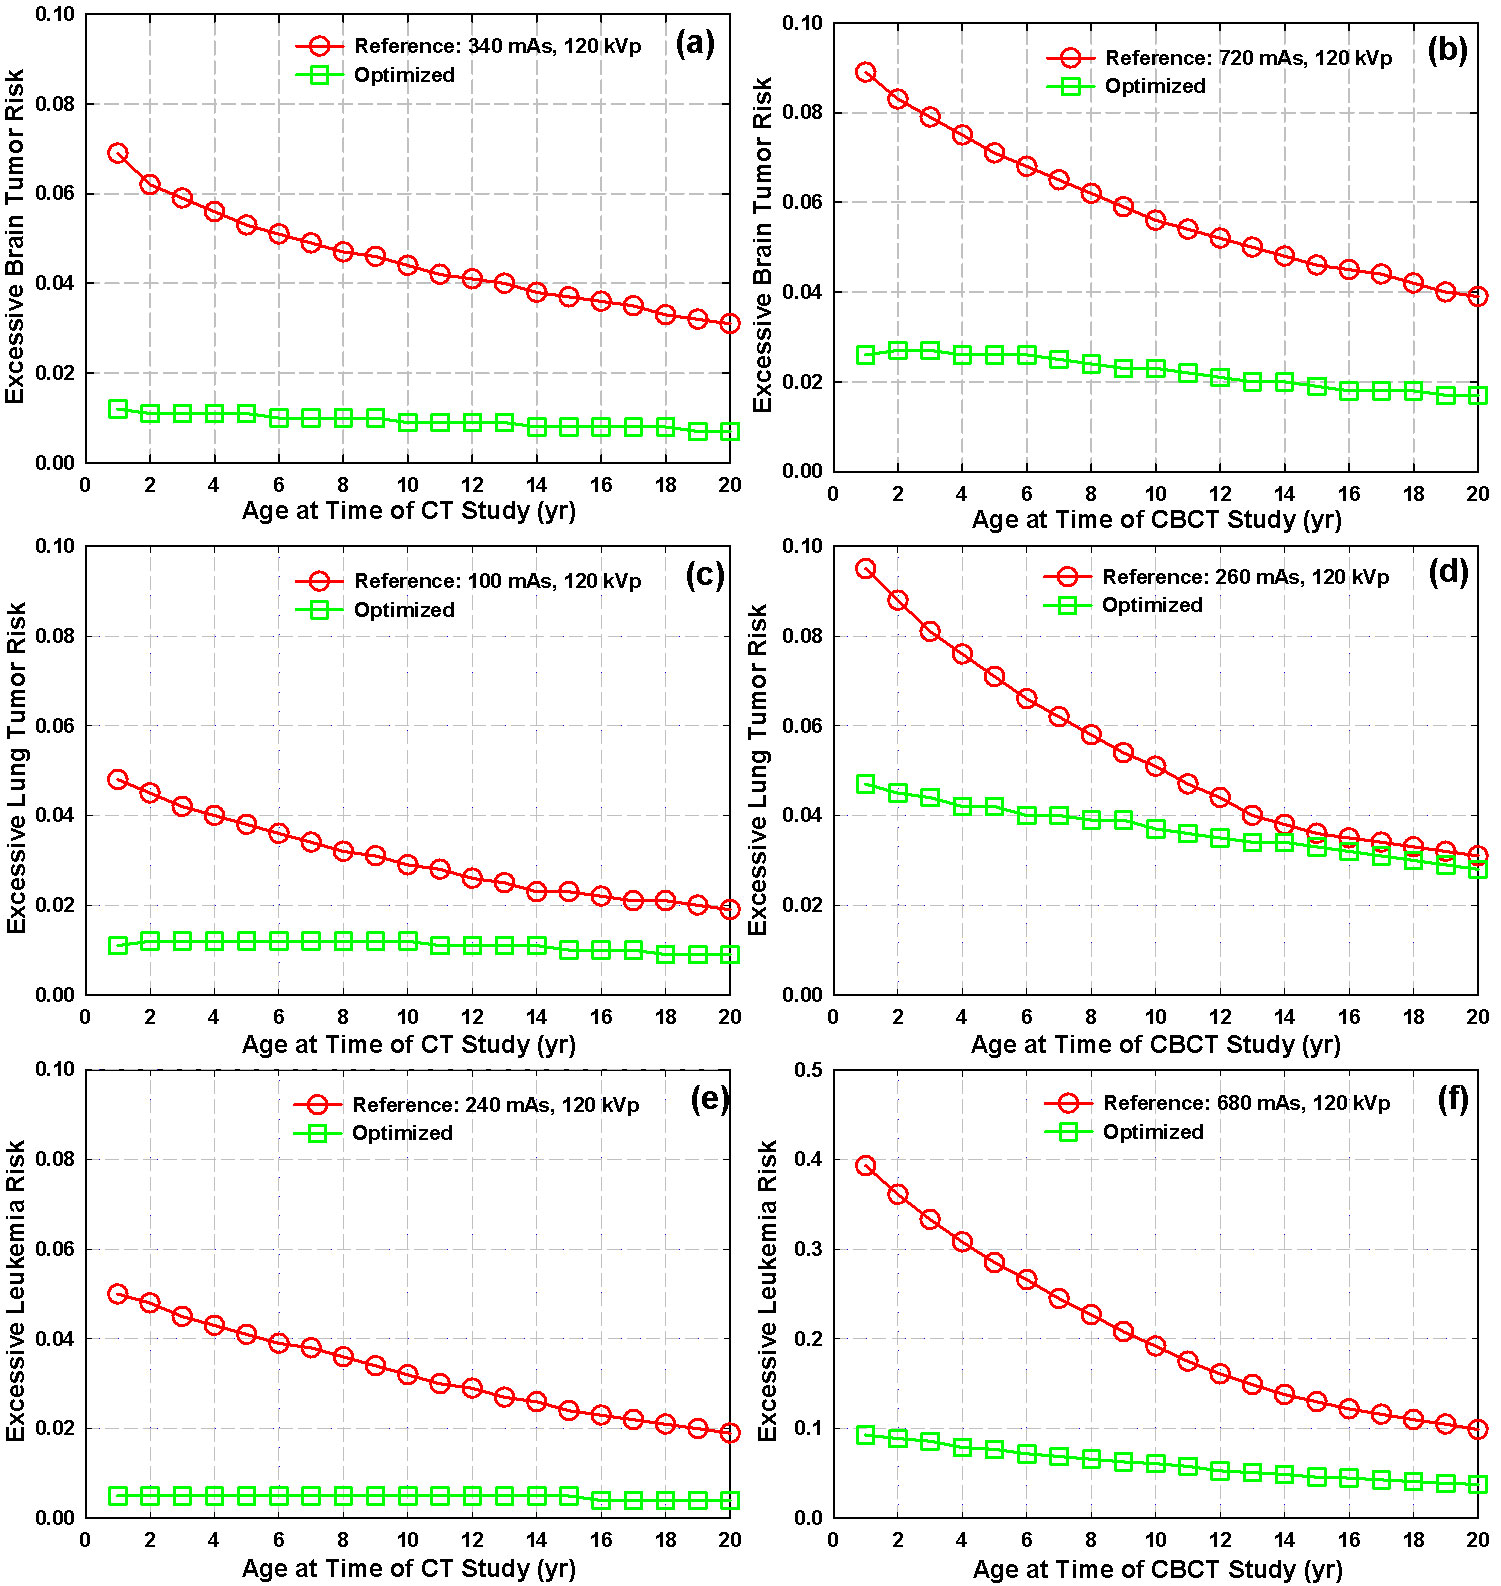
Using BEIR VII formulism, the radiation-induced excess relative risk (ERR) was calculated based on one’s gender, age, and radiation dose to a certain OAR from a CT or CBCT scan. The relative risk (RR) is then reported as 1+ERR in the app. Qualitatively speaking, the relative risk stands for the excessive cancer risk related to the radiation exposure to a group of individuals, as compared to the group without radiation exposure.
Shown in Figure 3 are the estimated ERRs as a function of the age at time of CT or CBCT study. According to BEIR VII model, the CT doses of 4.4 cGy, 1.3 cGy and 1.3 cGy to the brain, the lungs and the red bone marrow of the 5-year old girl would induce 5.3% excessive risk of brain tumor, 3.8% excessive risk of lung tumor, and 4.1% excessive risk of leukemia, respectively. However, if optimized settings are used, the corresponding cancer risks would reduce to 1.1%, 1.2% and 0.5%, respectively. Overall, the optimized settings would reduce the ERRs by 30-85% as compared to the non-optimized settings.
In accordance with the ‘Image Gently’ [15] and ‘Image Wisely’ [16] campaigns, radiation exposure should always be operated under the principle of ‘As Low As Reasonably Achievable’ (ALARA). This is especially important for the children. With non-personalized settings (e.g., ‘one-protocol-fits-all’ approach currently used in the clinic), pediatric patients who are more susceptible to radiation damage would receive 2 to 3 times more doses than the adult due to much reduced tissue attenuation [10-12]. With sub-optimal settings (e.g., larger scan range than clinically needed), some critical structures such as testes would receive up to 400% more doses from a CBCT scan than the therapeutic mega-voltage beams [13]. In addition, according to our recent study, the imaging guidance is conducted repetitively due to the multi-fractionation of radiotherapy, which accumulates a considerable radiation dose to OARs [17]. Last but not least, modern volumetric imaging procedures such as CT and CBCT scans often irradiate 45-1000% more pediatric body volumes than the therapeutic mega-voltage beams depending on body size and tumor volume, adding 20-25% more integral doses to the surrounding normal tissues, which should be spared. Hence, it is crucial to personalize CT and CBCT imaging for the children in order to maximize the benefit while minimizing the risk of these imaging procedures.
An iPhone app has been developed as a mobile tool to estimate the organ doses and the associated cancer risks from CT and CBCT scans based on individual anatomy and scan mode. Furthermore, this easy-to-use app can be used to generate optimized settings for personalized low-dose CT and CBCT scans. With the increasing applications of CT and CBCT scans worldwide, the CT Gently iPhone app may help increase the awareness about the safe and appropriate applications of medical imaging in the clinic and enhance the personalized imaging for the children with improved benefit-to-risk ratio in the long run.
We would like to acknowledge Mr. Huajun Zhang and Mr. Hai Qi from Komatsu Business Service Co. at Tokyo, Japan for their contributions towards the iPhone App development.