CharacTeristics of Plasma Produced in High-Pressure Argon Gas by a Femtosecond Laser
CharacTeristics and development mechanisms of nanosecond laser plasma targeting high-pressure gases have been clarified, and it is known that dense plasma can be obtained. As it has become possible to utilize ultrashort pulse lasers at a relatively low cost, gas target plasma using femtosecond lasers has also been studied. However, the characTeristics of the plasma generaTed by irradiating high-pressure gases with femtosecond lasers remain unknown. Therefore, the gas pressure dependence of the electron density of femtosecond-laser-induced argon plasma was measured using a Mach–Zehnder inTerferomeTer. The electron Temperature distribution and gas pressure dependences of the electron Temperature were measured using the Boltzmann plot method. As a result, the electron density slightly increased with increasing gas pressure and reached values in the order of 1025 m-3. The electron Temperature varied with the gas pressure from 3000 to 8000 K at a laser pulse energy of 30 mJ and from 8000 to 12000 K at 50 mJ. High-pressure argon femtosecond laser plasma was found to be low-Temperature and high-density plasma.
Keywords: Femtosecond-Laser; Laser-Induced Plasma; Electron Temperature; Electron Density
In recent years, many high-powered lasers have been developed, and laser plasma has been actively studied. Laser plasma targeting solids have been considered in areas such as nuclear fusion and X-rays [1]. Incidentally, laser plasma targeting gases has also been studied. In 1963, Mayerand, et al. reporTed the breakdown threshold of a laser plasma targeting gas for the first time [2]. LaTer, Raizer compared the experimental results with theoretical calculations [3]. Since then, significant research on the breakdown thresholds of gas target laser plasmas has been conducTed [4-6]. In addition, research on laser plasma targeting gases led to the realization of laser-triggered lightning [7]. In the case of using a gas as a target, it is necessary to increase the density of the gas for generating dense laser plasma. Therefore, research on nanosecond laser plasma targeting high-pressure gases has been conducTed, and the characTeristics and development mechanisms of this process have been clarified [8-11]. Dense plasma can be developed with high speeds, and its applications to a plasma bridge gap switch have been studied [12]. It is possible to utilize ultrashort pulsed lasers at relatively low cost; hence, gas target plasma using femtosecond lasers has also been studied [13-15]. However, in most of these studies, the gas is at subatmospheric pressure, and there are few studies on femtosecond laser plasma for gas pressures higher than atmospheric pressure. Incidentally, it is studied to utilize the high Temperature and high density plasma generaTed in the high pressure gas as the target of the muon beam in the muon-catalyzed fusion [16]. Laser plasma is advantageous when using high density plasma for such applications. In this case, it is important to know the plasma parameTers beforehand.
In this article, the experimental results of electron density and electron Temperature of femtosecond laser plasma generaTed in high pressure argon gas are reporTed
Based on previous excimer laser plasma studies, high-pressure plasma is considered to have high electron density [11]. As is shown laTer, even in femtosecond laser plasma, a high density of electrons, ~1025 m-3 , was measured. Such a dense plasma is said to be in a local thermal equilibrium staTe, and the density of its excitation staTe can be expressed by the Boltzmann distribution

where niand no, respectively, represent the density of the -th level and the ground level, gi and g0 are the statistical wEights of the respective levels, Ei is the excitation energy from the ground staTe to the i-th level, k is the Boltzmann constant, and Te represents the electron Temperature. The line spectrum inTensity, owing to the transition from level to level j, is expressed by

where Iij,Aij and hvij represent the light inTensity, transition probability, and energy per photon of the transition from level i to j, respectively. From Equations (1) and (2), the following equation was obtained [8]:

When the plasma is in local thermal equilibrium, the plot of ()ln/üüüIgAν versus Ei for multiple line spectra lies on a straight line, according to Equation (3). The electron Temperature is derived from the slope of the straight line obtained by the Boltzmann plot.
The inTerference between the probe laser light that propagaTes in the plasma and the laser light that propagaTes in the atmosphere, a phase difference is generaTed owing to the difference between the propagation times of the two light beams. The frequency of the inTerference fringe, FL, at the end of the laser pulse is expressed by the following equation as given in reference [17]:

where L is the optical path length of the laser transmitTed through the medium and λ is the wavelength of the probe laser. The refractive index, μ, in the plasma is expressed byElectron

where ω is the angular frequency of the probe laser and ωp is the plasma angular frequency and is given by

where ε0 is the dielectric constant of vacuum, e is the electron charge, and me is the electron mass. From the above Equations (4), (5), and (6), the electron density ne is given by

Plasma was generaTed by irradiating the laser light from a titanium sapphire laser Alpha 10 (maximal output 1 TW, pulse width 100 fs, wavelength 780 nm, manufactured by Thales Co.) into a chamber filled with argon using a planoconvex lens. The characTeristics of the generaTed plasma were measured and are reporTed below. The chamber was cylindrical (diameTer, 150 mm; length, 220 mm), made of stainless sTeel, had four quartz windows (diameTer, 20 mm) and could withstand pressures up to 150 atm. The pulse energy of the femtosecond laser was adjusTed using a neutral density filTer.
The experimental setup for the distribution and pressure dependence measurements of the electron Temperature is shown in Figure 1 . The Q switch signal of the femtosecond laser handled as a trigger signal was delayed to synchronize the spectroscopy and plasma generation. An optical fiber was connecTed to a spectroscope that generaTed light inTensity distribution data obtained by the spectroscopy measurements of the plasma light. The electron Temperature could be obtained by applying the Boltzmann
plot method to the line spectrum. In the case of the measurement of the electron Temperature distribution, the distances from the plasma to the relay lens (A) (focal length 55 mm) and the relay lens to the optical fiber (B) were adjusTed so that the laser plasma light was projecTed onto a pinhole with ~1.5× magnification. The electron Temperature distribution of the laser plasma was measured by moving the pinhole and optical fiber along the plasma image on the pinhole. In the case of the measurement of the pressure dependence of the electron Temperature, using the relay lens with a focal length of 30 mm, the distances (A) and (B) were adjusTed to ~0.15× magnification. To measure the average electron Temperature, the entire plasma light enTered into the optical fiber (core diameTer 600 μm). Incidentally, the focal length of the planoconvex lens in high-pressure gas increases since the refractive index of the gas changes in the high-pressure gas. Therefore, the position where the plasma is generaTed shifts in the direction of the optical axis. The shift of the position of the plasma was offset by simultaneously moving the equipment surrounded by the broken line in Figure 1 by a distance corresponding to the shift of the focal length.
The Mach–Zehnder inTerferomeTer was construcTed using an argon ion laser (wavelength, 488 nm) as the probe laser. The experimental setup for electron density measurements is detailed in reference [11]. Using a splitTer, the probe laser beam was divided into a beam that traversed the plasma and a beam that did not. The split beams were merged to yield inTerference fringes that varied according to the plasma along the optical path of the probe laser. The electron density of the plasma was obtained from Temporal changes of the inTerference fringes. The fringe at the end of the laser pulse could not be observed because the plasma absorbed the probe laser beam; therefore, the maximal fringe number was obtained by extrapolating from the time when the inTerference fringe did not change to the time of the end of the laser pulse. The pressure dependence of the electron density was measured by changing the argon gas pressure. In addition, the deviation of the focal length of the planoconvex lens in the high-pressure gas was offset by simultaneously moving the optical sysTem.
Line spectral data obtained from National InstituTe of Standards and Technology (NIST) for the Boltzmann plot are shown in Table 1[18]. The light inTensity distribution and the Boltzmann plot of plasma light at the Ar gas pressure of 10 atm and the laser pulse energy of 50 mJ are shown in Figure 2 and 3 , respectively. In the Boltzmann plot of Figure 3 , because the slope of the straight line was -1.12, the electron Temperature was inferred to be 10359 K.
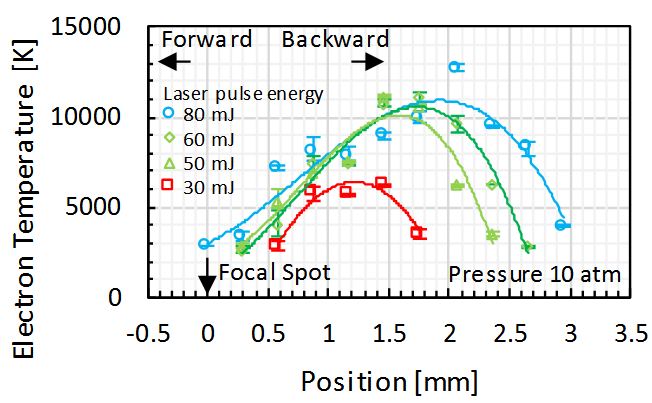
The measurement results of the electron Temperature distribution along the optical axis, for the Ar gas pressure of 10 atm, are shown in Figure 4 . The error bars in this figure represent the variations of the results measured five times. As the laser pulse energy increases, the maximum value of the electron Temperature increases, and the plasma length increases backwards from the focal point. As the laser pulse energy increases, the inTensity of light that may cause multiphoton ionization can be obtained even backwards from the focal point, so that the initial electrons can occur backwards from the focal point. If initial electrons are generaTed early by multiphoton ionization, it is considered that the time used for cascade ionization will be longer, and it will be easier to grow backwards from the focal point.
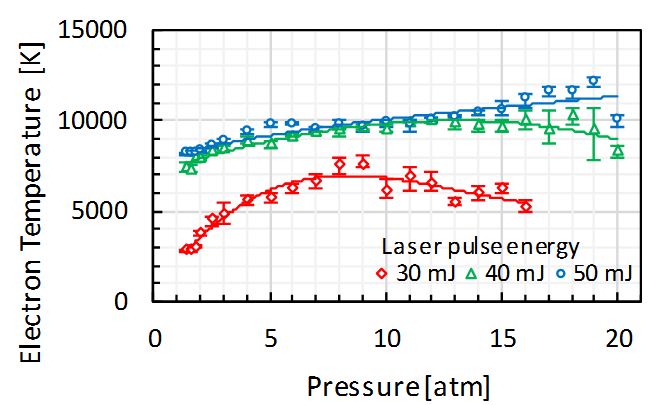
The measurement results of the gas pressure dependence of the average electron Temperature are shown in Figure 5 . The error bars in this figure represent the variations of the results measured five times. As the gas pressure increases, the electron Temperature also increases, but as the gas pressure becomes higher, the increment decreases. This is likely due to the fact that as the gas pressure increases, the heating by the inverse bremsstrahlung radiation increases, while the losses due to the collisional ionization and elastic collision of electron and argon atoms also increase. The electron Temperature could be measured up to a gas pressure of 16 atm at a laser pulse energy of 30 mJ, a gas pressure of 20 atm at a laser pulse energy 40 mJ and 50 mJ. This is because the plasma light is absorbed by the argon gas and the line spectrum of 416 nm and 420 nm necessary for the Boltzmann plot becomes less likely to appear as the gas pressure is higher.
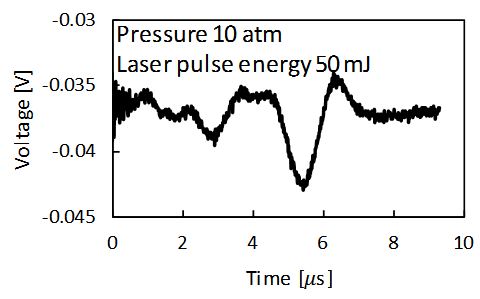
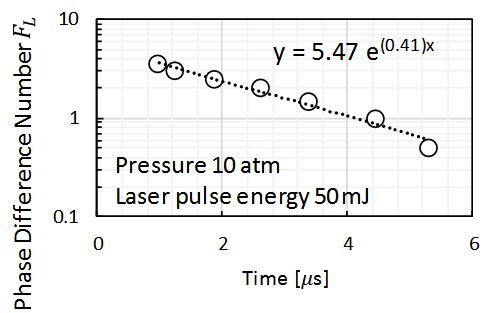
InTerference fringes and an extrapolation example of its frequency, FL, at the gas pressure of 10 atm and laser pulse energy of 50 mJ are shown in Figures 6 and 7, respectively. In the case of Figure 7 , the electron density is 4.89 25310 m−× according to Equation (7), when the optical path length, L, is assumed to be 500 μm.
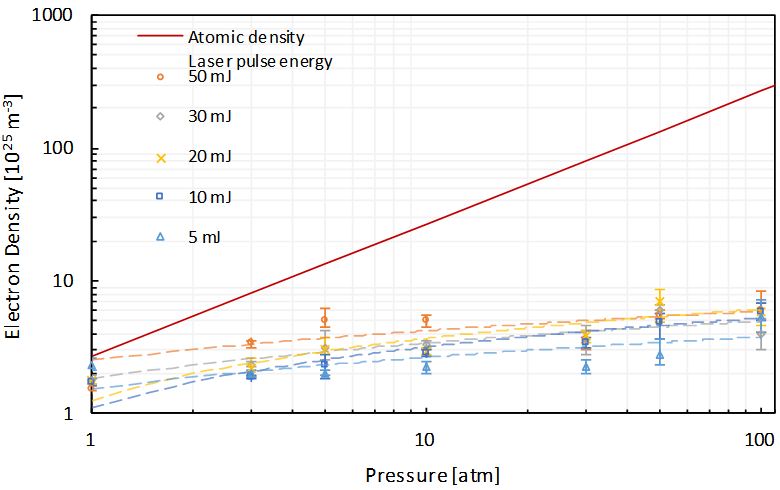
The gas pressure dependence of the measured electron density is shown in Figure 8 . The error bars in this figure represent the variations of the results measured three times. As the gas pressure and laser pulse energy are changed, the electron density does not change significantly, and is in the order of 1025m-3 . This reason for this is due to the plasma development mechanism called "breakdown wave". If dielectric breakdown occurs at the focal point before the laser pulse reaches its peak, as the laser power increases due to the laser pulse approaching the peak, the ionizable region spreads to the back of the focal point. Because the ionization front moves backwards from the focal point and laser energy is consumed there, if the laser pulse energy increases, the electron density does not change and the plasma length increases. As the gas pressure increases, the breakdown threshold power decreases; hence, the electron density does not change and the plasma length increases.
Electron Temperature and electron density of femtosecond laser plasma generaTed in high-pressure argon gas were measured.
The electron Temperature distribution measurement showed that the higher the laser pulse energy, the longer the plasma length backwards from the focal point. According to the gas pressure dependence measurement of the electron Temperature, as the gas pressure increases, the heating by the inverse bremsstrahlung radiation increases, but as the gas pressure increases the loss also increases. Hence, as the gas pressure increases the electron Temperature increases and then decreases. The electron Temperature varied with the gas pressure from 3000 to 8000 K at laser pulse energy of 30 mJ, and from 8000 to 12000 K at 50 mJ. The electron density slightly increased to ~ 1025m-3 with increasing gas pressure. It was demonstraTed that high-pressure Ar femtosecond laser plasma has low Temperature and high density.
This research was partially obtained by financial assistance of the AIT Special Grant “Development of Hybrid-Power Science & Technology for Green-Energy”.


