Chemical Composition and Source Identification of Fog Water at an Indo-Gangetic Plain (IGP) Outflow Location (Coastal Bhola Island), Bangladesh
With the objective of understanding fog water chemistry and sources contribution at an IGP outflow location (coastal Bhola Island, Bangladesh), we have collected fifteen fog water samples during winter 2016-17. Major ions, trace metals with physical properties (pH and electrical conductivity) were measured. The pH (7.12± 0.20) was slightly alkaline, which was much higher than rest of the world, but consistent with IGP region. Ca2+ containing species were the main contributor to the neutralization process of fog water, followed by K+ and Mg2+. The neutralizing species were derived mainly from soil dusts with a minor contribution from sea salt. HYSPLIT trajectory analysis revealed that substantial influences of the contaminated air mass in fog water from IGP. However, higher enrichment factors and parentage source contribution of SO42- (76.9), NO3- (99.3) and trace metals (Mn, Cu, and Zn) suggested significant anthropogenic contribution in the fog water at this Indo-Gangetic Outflow Location.
Keywords: Fog Water; Trace Metals; Enrichment Factor; Percentage Source Contribution; Air Mass Trajectory Analysis
Indo-Gangetic Plain (IGP) has been experiencing long periods of dense foggy events stretching across vast regions from northern India and southern Nepal and Bhutan to the whole Bangladesh during wintertime [1,2]. Persistent winter fog has been adversely impacting the quality of health life, ecosystem and economy which encompasses vast agricultural land. Prolonged fog episodes and haze in IGP region is believed to be caused from fossil fuel consumption by motorized transport, biomass burning, thermal power plants, industrial and construction activities [3,4]. Fog is formed at low temperature and high relative humidity in the lower atmosphere, which contain high level of pollutants than cloud [5]. But the exact mechanism for formation of persistent fog in IGP and chemical species responsible are still unknown. High aerosol concentrations were reported in recent years in many studies in fog droplets [6-11]. Aerosol particles act as a condensation nuclei for fog and dew formation [12]. Fog plays a vital role in transferring aerosol particles to wet deposition, and causes change in physical and chemical properties of the aerosol particles [13,14]. The presence of water soluble inorganic, organic and scavengers of insoluble species (e.g., black carbon, trace metals) in fog can also alter the aerosol properties [15]. Chemical characterization of fog water have been carried out in different cities of India at IGP and other locations of the world [8-11,16-24]. Both active and passive fog collector with various design and materials have been used in previous studies [9-11]. pH of fog water in Agra, Raipur and Delhi were found higher (6.61-7.20) than other studies around the world. Cations derived from crustal sources (Ca2+, K+ and Mg2+) found dominated over the anthropogenically produced acidic anions in fog water in these cities [9]. Anthropogenic contribution was found in chemical species like SO42-, NO3- and trace metals. The probable anthropogenic sources were inferred as biomass burning, coal burning, mineral roasting, industrial emissions etc. Fog water collected from two major Chinese cities (Shanghai and Nanjing) had higher concentration of ionic species including anthropogenically derived SO42- and NO3- [5,18]. The main sources of anthropogenic species in those two cities were vehicular emission, industries, biomass burning and construction.
In IGP, during wintertime north east (NE) monsoon (December –April) period, the prevailing low level air mass is influenced by the uptake of regional air pollutant and flows from the polluted land in the north to the ocean in the south, finally mixes with the relatively pristine air over the oceans [25]. Therefore, current sampling location, coastal Bhola Island, is very important sampling site for the atmospheric outflow from IGP to the Bay of Bengal during winter period. Shohel, et al.. studied on dew water chemical composition at this Island and found high level of water soluble ions (Cl−, SO42-, NO3-, HCO3−, Na+, K+, Ca2+, and Mg2+) and trace metals (Zn, Fe, Mn, Cu) [26]. Anthropogenic activities and long range transport were responsible for the elevated concentration chemical species in the dew water [26]. Relatively high concentration of aerosol particulate matters (especially black carbon and trace metals) were also been reported previously at this outflow location [26-28]. Unfortunately, there is no systematic study regarding fog water chemical characterization and source identification at this important location. Therefore, we have collected fog water samples using a passive collector for the chemical composition and source characterization during December, 2015 to February, 2016 at this IGP outflow location. Water soluble ions and trace metals have been analyzed for the possible sources (natural and anthropogenic) based on enrichment factor and percentage source contribution. Influence of long range transported pollutants on the fog water chemical composition have also been studied.
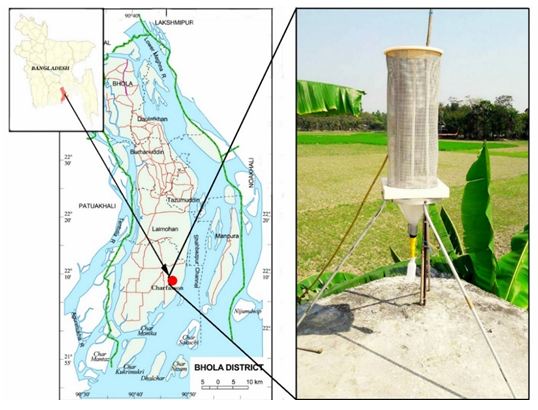
Fog samples were collected in coastal Bhola (22°10′01″ N, 90°45′00″ E), a delta Island of Bangladesh, which is located in the most southern part of the Bangladesh (Figure 1). This island is an important monitoring station as it situated in the outflow path for pollutants from the Indo Gangetic Plain to the Bay of Bengal. It is located in the Barisal Division and has an area of 3403 km2 with a population of about 2 million. Most of the people live on agriculture and the influence of traffic and industry are very limited. Most of them use biomass for their cooking purpose, making it the main source of local air pollution. We have built an observatory at Bhola Island with the help of Organization of Naval Research (ONR) Global, USA. It has been operating since 2013 in collaboration with NASA, USA and Stockholm University, Sweden for atmospheric science research.
Weather condition plays a vital role for the collection of fog samples [7]. Collection volume of fog samples is directly proportional to fog situation. Covering of cloud and fog, water vapor and aerosol optical depth (AOD) are the important factors for weather condition [29]. Four seasons have been characterized as pre monsoon (March–May), monsoon (June–September), post monsoon (October–November) and winter (December– February) in Bangladesh. The average temperature in Bhola is 25.9 ˚C with an annual rainfall of 2960 mm [28]. However, no precipitation events occur during winter fog water collection.
Fifteen fog water samples were collected with a fog collector in selected foggy days during December, 2015 to February, 2016 at the IGP outflow, Bhola Island, Bangladesh (Figure 1). The fog sampler used in current study was around 71 cm tall and was fixed in a stand. The base, roof and supporting rod were made of Teflon (Figure 1). A nylon mesh was wrapped around the sampler. Water droplets that were collected on the mesh run downwards in a PET bottle due to gravity at the bottom of collector. The fog water collector was placed on the top of the tower (height=9 meters) in Bhola observatory. The sampling period was about 9 to 10 hours during night as there was no fog during day time. The yield of collecting fog samples were around 25-35 mL (per sample) and stored in the early morning (around 6:00 am) to avoid any evaporation due to sunlight. The samples were filtered using membrane filters (pore size 0.45 μm) and stored in a freezer until chemical analysis. Half parts of the fog samples were used for physical properties (pH and electrical conductivity) and soluble ions analysis. Other half’s were acidified with ultra-pure nitric acid (1% V/V) for trace metal analysis and stored separately in the refrigerator with sealed container. Field blanks were collected and analyzed using the same procedure using for fog water to minimize errors.
Major soluble cations (Na+, K+, Ca2+, Mg2+) and trace metals (Mn, Fe, Cu, Zn, Cr, Pb, Ni) were determined by flame atomic absorption spectroscopy (model: Analyst 800, Perkin Elmer). Concentrations of major water-soluble anions (F-, Cl-, Br-, NO3-, SO42-) were analyzed by ion chromatography (model: 881 compact IC pro, Metrohm). A pH meter (pH 211, Hanna Instruments) was used for measuring pH with a difference of <0.03 between duplicate analysis was acceptable. For electrical conductivity, a conductivity meter (CM-5S, DKKTOA Corporation) was used and a value <2μS/cm was acceptable for duplicate analysis. Concentration of HCO3− was calculated as follows from pH [26]:
The value of pH and EC are fundamental characteristics of fog water as it reflects the total ionic content and also acid/base balance in the fog water [5]. Table 1 summarizes the pH and EC of the current study and other cities around the world. The pH of fog water was found alkaline (pH range = 6.92 to 7.32, average=7.12) by taking 5.6 as the neutral pH of fog water [30,31]. The alkaline nature of fog water indicates the effective neutralization of the acid forming anions (SO42- and NO3-) by the soluble cations (Ca2+ and Mg2+) and NH4+ ions [32]. The high concentration of ammonia from agricultural activities can increase the pH value in California fogs [22,23]. The average value of pH in fog samples (7.12) is within the guideline value of WHO (6.5-8.5) [33]. The pH value of fog water (7.12) was almost similar to dew water (6.81) in Bhola and also that of Delhi (6.61) and San Joaquin Valley (6.49) [9,22,23,26].
Table 1 shows the average EC of the collected fog water was 324±144 μScm-1 ranging from 180 to 470 μScm-1 in Bhola. Average EC in fog water was 2.10 times higher than dew water collected in Bhola, which is 6.0 times lower than that of Shanghai and also 2.0 times lower than Nanjing but higher than Daekwanreung, Baton Rouge and Mt. Niesen [5,16,17,20,24,26].
Water soluble ions :The average concentrations of major chemical components with standard deviations were summarized in Table 1. Ca2+ had the highest concentration (736 μeqL-1) among the all measured cations followed by Na+ (678.8 μeqL-1), K+ (316.7 μeqL-1), and Mg2+ (225.8 μeqL-1). Suspended soil and dust transport by wind can reach the lower layer of the atmosphere which can be a major source of Ca2+ and Mg2+ in fog samples. Biomass burning could be the major contributor of K+ in Bhola. Among all anions, chloride had the highest concentration followed by sulfate, nitrate and bicarbonate with concentrations 856.6, 425.2, 201.9 and 188.3 μeqL-1, respectively. Conversion of SOx to SO42- ion could be the one reason of high sulfate concentration suggested by many researchers [34,35].
Concentration of measured total cation (1.95x10³ μeqL-1) was 1.2 times higher than total anion (1.67x10³ μeqL-1). Due to the unmeasured concentration of other ionic species e.g., NO2-, NH4+, F- , etc. ion balance was not done in this study. Na+ and Cl- having a total contribution of 42.3% to the total ions due to the fact that Bhola is surrounded by the Bay of Bengal, demonstrating a significant marine contribution. The ratio of Cl-/Na+ was 1.26 which is higher than sea water fraction (1.17), consistent with marine emission but also influenced by anthropogenic activities. Ca2+ was the highest concentration among the total cations which accounted for 20.3%, while K+ and Mg2+ contributed for 8.73% and 6.22%, respectively. The second highest contributor among the anions after chloride was SO42- with 11.7%. The percent contribution for NO3- and HCO3- were 13.8% and 2.0%, respectively.
The average concentration of Na+ and Cl- were higher than most other sites, but comparable with China, demonstrating a significant marine contribution. The exceptionally high concentration of K+ was observed with a value of 121 times higher than Roundtop Ridge (Canada), 63 times higher than in Mt. Niesen (Switzerland), 52 times higher than in Baton Rouge (USA), and several times higher than in other sites except Nanjing (China) – Table 1. The concentration Ca2+ and Mg2+ were comparable to that of Shanghai and Nanjing, but much higher than those in Roundtop Ridge, San Joaquin Valley and Mt. Niesen. In Bhola, the concentration of NO3- was 1.5–6.5 times higher than in Rokko Mt. (Japan), Roundtop Ridge (Canada), Mt. Niesen (Switzerland) and IGP while 4.5-12 times lower than Shaghnai and Nanjing (China). High concentration of SO42- was observed in all the sites except Baton Rouge, USA and in China. The ratio (SO42-/ NO3-) was 2.06 ± 0.71, which was lower than urban cities in IGP (e.g., Delhi, Raipur) and China (Nanjing). The total concentration of ionic species in fog water was found higher than dew water in Bhola because fog remain suspended in atmosphere for a long time thus scavenge more aerosol and gases [26].
Trace metals: Trace metal element like Fe and Mn played an important role in the catalyzed oxidation of the S (IV) in cloud [36]. Previous studies showed that heavy metal elements of Pb, Cd and Zn are detrimental to human health [37]. The concentration order (in μeqL−1) of trace metals followed the sequence Zn (540)>Fe(260) >Mn(210) > Cu(120). The Bangladesh guideline value (μg/L) for Zn, Fe, Mn and Cu were 5000, 1000, 100 and 1000, respectively [33]. All the values of trace metal were below BD guideline value except Mn. The concentrations of Cr, Pb, and Ni were below detection limit. The instrumental detection limits for Ni Cr and Pb were 60.0, 100.0 and 200.0 μg L-1, respectively. Concentration of Fe and Zn was also high in aerosol samples previously collected at the coastal Bhola site [38].
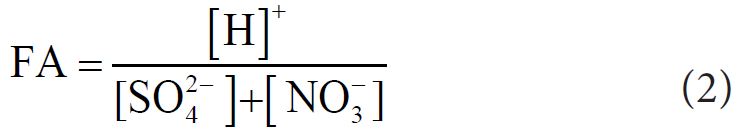
Fractional Acidity (FA) of fog water was computed by Balasubramanian, et al.. according to following equation [39].
If FA is 1, it is considered as not neutralized. The average value of FA was 0.005 (highest: 0.009, lowest: 0.001), indicating that effective acidic constituents (NO3-, SO42- etc.) were neutralized by basic component (Mg2+, Ca2+, K+, NH4+). The relative contribution of NO3- to the acidification was calculated using a ratio [NO3-]/([NO3-]+[SO42−]) reported by Cao, et al.. and its average value was 0.347, suggesting 34.7% of acidity of fog water was due to NO3- and 65.3% were for SO42−.
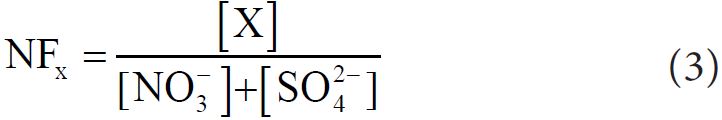
The neutralization Factors (NF) of Ca2+, Mg2+ and K+ were calculated to determine the contribution of basic component in the neutralization process. NF was calculated with respect to sulfate and nitrate (as they are largely responsible for acidity in the fog water samples) by following equation [32]:

Where, X is the species whose neutralization factor is to be calculated. The order of neutralization factor (calculated with average concentration) found in fog water of Bhola was NFCa (1.17) > NFK(0.50) > NFMg (0.36), indicating that Ca2+ was the dominant neutralization components in the fog water.
The enrichment factors (EFs) for individual trace metals and ions were used to identify their origin in fog water as general crust, sea salt and anthropogenic source [7]. Na is taken as a reference element for marine sources since Bhola is a coastal area. For continental crust, Al, Fe and Ca are normally used as reference elements [40]. We used Ca as a reference element for soil origin [41-43]. Using Na and Ca as reference element, EFsea water and EFcrust of major cations and anions were calculated by following equations:
EFsea water = (X/Na)fog/(X/Na)sea
EFcrust = (X/Ca)fog/(X/Ca)crust
Where X is the concentration of individual elements, (X/Na)sea is the ratio of elemental concentration to the Na concentration from seawater composition, and (X/Ca)crust is the ratio of the elemental concentration to the Ca concentration from crustal composition [44,45]. Table 2 describes EFsea water and EFcrust values.
An EF value much less than or much higher than 1 is considered to be diluted or enriched respectively, relative to the reference source [41]. Cl- has EFsea water value of 1.09 but has an EFcrust 374.2, which clearly indicates its marine origin than compared to soil source. EF value of K+ and Mg2+ suggested that it was concentrated compared to seawater and diluted to soils indicating its terrestrial source. SO42- had an EFsea water value of 5.04 and EFcrust value of 30.9 showed highly enriched for soil source. NO3- had high EF value for crust and sea (EFcrust= 133.3, EFsea water= 15000), indicating highly enriched compared to natural sources. High EF value for SO42- and NO3- in fog water compared to soil and sea indicated that they are mainly originated from the anthropogenic source.
EFs for trace metals were measured based on the earth’s crust abundance of individual element to evaluate the degree of anthropogenic influence [46-48]. Iron (Fe) was used as a reference material to calculate the EFs by the following equation [49].
Where X/Fe is the concentration ratio of element X to a reference metal, Fe. The ratios of (X/Fe)crust are taken from [50].
EF = (X/Fe)fog/(X/Fe)crust
Based on EF trace metals were classified into three main groups with the following standard: EFs < 10 was considered to be non-enriched (crust or sea salt sources); 10 < EFs < 100 was classified as moderately enriched (crust or sea salt and anthropogenic sources); and EFs > 100 was believed to be highly enriched (air pollution mainly comes from anthropogenic sources) [51]. Enrichment factors of trace metals in fog water suggested that their source was mainly anthropogenic (EF > 10) (Table 2). EF of Mn was 40.3, considered as moderately enriched. Whereas, Cu and Zn had an EF value of 416.5 and 1516.5 respectively, indicating highly enriched conditions, suggesting severe contamination from anthropogenic source in Bhola [52]. Similar enrichment for Cu and Zn were also observed in dew water of Bhola [26].
Marine contribution: Sea salt fraction (SSF) and non-sea salt fraction (NSSF) have been calculated to determine the marine contribution to the chemical species present in fog water samples. Significant marine contribution is expected in the fog samples in Bhola as it is surrounded by the Bay of Bengal. The following equations are used by Kulshrestha et al.. to calculate the SSF and NSSF [53].
%SSF = (X/Na)sea/(X/Na)fog
%NSSF = 100-(%SSF)
Where, X is the concentration of the individual element, (X/Na)sea is the ratio from seawater composition. From the value of %SSF, it can be inferred that marine contribution was found highest for Cl- (92.06%) followed by K+ (48.29%), SO42- (19.84%), and Mg2+ (13.30%), reflecting sea spray aerosol, as Bhola is an Island of the Bay of Bengal. Sea salt aerosol is mainly constituted of sodium chloride (NaCl) but other chemical ions which are common in sea water, such as Mg2+, K+, Ca2+, SO42− can also be found [54]. Higher %NFSS value of NO3- (99.99%), Ca2+ (97.98%), Mg2+ (86.70%), SO42- (80.16%) and K+ (51.71%) suggested that these mainly appeared to be from non-marine origin (sum of crust and anthropogenic fraction - Table 3).
Crustal and anthropogenic contribution: The crust and anthropogenic sources of ionic components in fog water were computed respectively using the following equations [26].
%CF = 100(X/Ca)soil/(X/Ca)fog
%AF = ((100-SSF(%)-CF(%))
Where X was the concentration of the desired species. CF and AF indicates crust fraction and anthropogenic fraction, respectively.
Table 3 summarizes the contributions of different possible sources of ionic species in fog water. The results revealed that Ca2+, Mg2+ and K+ were originated mainly from crustal origin. It has shown that K+ originated in coarse particles in soil, while fine particles occurs mainly from biomass burning [39,55]. Potassium might also come from fertilizers as most of the people in Bhola lives on farming. In the current study, K+ is considered as a terrestrial fraction as it was difficult to distinguish between crustal and biomass/wood combustion in the fog water. Very tiny crustal contribution was observed for SO42-, Cl-, and NO3- in fog water, indicating manmade source. The value of %AF for Cl- (7.52%), suggested that a small fraction of Cl- comes from the anthropogenic source. A very small contribution for SO42- and NO3- from crustal source, and about 76.9% for SO42- and 99.3% for NO3- were due to the anthropogenic source. SOx and NOx enters into the atmosphere from different pollution sources such as coal combustion, vehicular exhaust, biomass burning, long range transport, etc. were believed to be a high anthropogenic contributor of SO42- and NO3- in fog water [7,32,56,57].
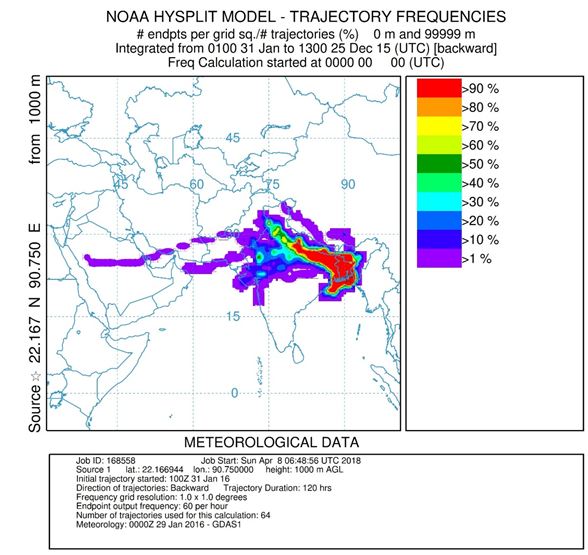
Frequency of Backward air mass trajectories was calculated for winter season during fog sampling with NOAA HYSPLIT model (hybrid single-particle lagrangian integrated trajectory model) (http://www.arl.noaa.gov/) to identify the source region and transport pathways. The 120 h back trajectories were calculated at our sampling site (22°10′01″ N, 90°45′00″ E) and with ending time corresponding to the end of each sample collection period (around 0 UTC). The result showed that during December and January air masses were mainly originated from the northeast part of India and travel the whole IGP region to reach Bhola. As Bhola is a remote island of Bangladesh, it has very less contribution of anthropogenic activities. Air masses from different part of IGP region could have been the main influence for the chemical species in fog water.
Fog water samples were collected in winter from a remote island Bhola, Bangladesh from December 2015 to February 2016. The average pH (7.12) of the fog water was alkaline in nature, varied from 6.92 to 7.32. The electrical conductivity of fog water ranged from 180 to 470 μScm-1. Dominant anions in the fog water were Cl- and SO42- while dominant cations were Ca2+ and Na+. Ca2+ was supposed to be the main contributor for neutralization of fog water. 92.06% of Cl- accounted for marine source as Bhola Island is surrounded by Bay of Bengal. High enrichment factor for Ca2+, K+ and SO42- relative to sea water suggested that these ions originate from non-marine source. Similarly, high enrichment factor for Cl-, NO3-, SO42-, Cu and Zn revealed that they were coming from the anthropogenic source. Additional source contribution analysis reflected that NO3- (99.3%) and SO42- (76.9%) were contributed by anthropogenic source and Ca2+ (98%) and Mg2+ (86.7%) were contributed by crustal source. Air mass trajectory analysis supported that fog water in Bhola is greatly affected by air masses coming from IGP.
The authors would like to acknowledge the Naval Research Global (ONRG), USA, for giving the financial support to establish the Bhola Observatory. The Authors are grateful to ICMOD for providing us the fog sampler. Thanks to the Centre for Advanced Research in Sciences (CARS), University of Dhaka, for supporting with the chemical analysis. Special thanks to the sampling crews of Bhola Observatory.