Chronotherapeutic Drug Delivery of Pectin Vs. Guar Gum, Xanthan Gum Controlled Release Colon Targeted Directly Compressed Propranolol Hcl Matrix Tablets
The study has been designed to develop a delayed release matrix tablets by using various natural polymers. The polsaccharide Pectin was used in the formulation Vs. Xanthan gum and Guar gum. The performance of Pectin Vs. other conventional polysaccharides was demonstrated in this work. A model drug Propranolol HCl was incorporated in the formulation design in order to access the drug release profile from the developed matrix system. The polysaccharide based formulation are known for stability issues and manufacturing difficulties. The research was focused on developing industrially relevant direct compression techniques. The polymers were used in different concentration ratios to optimize the best formulation design. The matrix system was evaluated for various quality control parameters. The Carbopol 940 was used as an auxiliary polymer to modify the drug release and to improve the compression characteristics in high speed tablet compression machines. The in vitro studies were performed in developed matrix system in 0.1 N HCl for 1.5- 2h and in pH 6.8 phosphate buffer for 2h and after that pH 7.4 buffer until the maximum amount of drug release. The in vitro drug release profile was analysed various pharmacokinetic models such as zero order, first order, Higuchi, Hixson Crowell, Korsmeyer Peppas model.
Keywords: Colon targeting; Pectin; Guar gum; Xantan Gum, Propranolol HCl; Colonic delivery
In current biomedical research Chronotherapeutics and Chronopharmacokinetics are gaining great importance. Chronopharmacology and Chronopharmacokinetics are linked with blood pressure, heart rate, stroke volume and cardiac output. It is a well known fact that blood flow of the body depends on circadian rhythm. The capillary resistance, fibrinolytic activity, vascular reactivity, platelet aggregation involved the mechanism of circadian rhythm [1]. Modern cardiac therapy recommended that modification of circadian rhythm by using pharmacological agents may give some beneficial effect in cardiac treatment. The rise in blood pressure during early morning and lowest during the sleeping period confirmed that the circadian rhythm mechanism in the body. The hypertensive patients also have surge in morning blood pressure as normotensive persons, though hypertensive patients have the upper shift in the blood pressure profile confirmed the influence of circadian rhythm in BP [2].
A study described that considering the Chronobiology was worthy in the management of hypertension [3]. The study revealed that the patients who have surge of blood pressure are also at risk of other cardio vascular risks [4]. The anti hypertensive therapy, which provides 24h longer efficacy or drug concentration in blood were recommended in their treatment patterns. There is an increased risk of heart attack during the early hours of the day so it is recommended to check the blood pressure in the early morning to give maximum cardiovascular protection. Those patients who have a significant degree of morning surge in systolic pressure compared with other subjects. Overall outcome of the researches recommended the effective and long acting hypertensive therapy. Besides heavy physical reactivity in the early morning can be avoided [4]. This research work focuses on developing long acting Propranolol HCl matrix system for better BP Management. The matrix systems were developed with natural polymers specifically polysaccharides, which is generally regarded as safe (GRAS) than the synthetic polymers.
In this study Propranolol HCl is a non selective β- adrenergic blocker is used as a model drug. This drug is commonly used in the treatment of a variety of cardiovascular disorders such as angina, tachycardia, hypertension [5]. And it is also used in the prophylaxis of migraine [6,7]. Propranolol HCl is highly lipophilic in nature and undergoes elevated first pass metabolism. Due to this only above 25% reaches the systemic circulation and 90% of circulating Propranolol bound to plasma proteins. The half life of Propranolol HCl is 3-4h which justifies a rationale behind the development of Propranolol HCl Chronotherapeutic delayed released system. To achieve a optimum effect, Propranolol HCl has to be administered several times a day (Usually 40-160mg/day in 3-4 divided doses). There are most metabolites appearing in the urine confirmed that Propranolol is extensively metabolized. Peak plasma concentrations occur approximately 1 to 4h after an oral dose. The t1/2 of Propranolol is 3–4h [8]. Thus, Propranolol has a relatively short half-life. Generally, for an optimum effect, the administration of Propranolol hydrochloride as conventional tablets must be carried out several times a day leads to unwanted side effects. In this work the drug is fabricated as matrix systems with delayed release mechanism minimizes the dose frequency to one or two tablets per day.
The colon drug delivery system (CDDS) are the systems systems which protect the drug in the upper GI tract and release the relatively high amount of drug in the colon [9] . The bioactive agent should be released at the dissolution site. Longer transit time, relatively low proteolytic enzyme activity and a much greater responsiveness to absorption enhancer [9] are the few advantages of colon. These criteria favor this distal part of the gastrointestinal tract (GIT) as a site for the delivery of various drug molecules, including proteins and peptides [10]. Study reports revealed that colon offers less enzymatic activity on the drug molecule since the distal part of the GIT is exposed to less enzymatic activity as compared to the upper GIT. The enzymatic activity is the main cause of first pass metabolism of the drug. The lesser exposure to the high enzymatic zone some extent prevents the serious cause of first metabolism for those drug under goes extensive first pass metabolism. There are drug molecule needs to be administered to treat some diseses though they under goes severe first pass metabolism since no substituted molecules available or by the physicians choice due to some or other reasons. Delayed release dosage forms are prevented from high pancreatic activity by which enzymatic metabolism of the drug can be prevented. Different types of polymers from natural (poly saccharides) and synthetic origin (Eudragits) can be utilized to develop colon drug delivery system. Delivery of drugs via colon offers many therapeutic Advantages. The drugs destroyed by the stomach acid and metabolized by pancreatic enzymes, are protected by colon. Sustained release of drugs into colon can be useful in the treatment of certain diseases. The colonic delivery is also useful for the systemic absorption of drugs like nifedipine, isosorbide, and theophylline. The colon is the most suitable site for absorption of peptides and protein drugs due to the less degradation by digestive enzymes, proteolytic activity of colon mucosa which is less than that observed in small intestine, thus CDDS protect peptide and protein drugs from hydrolysis, and enzymatic degradation in the duodenum and jejunum, and releases the drug into the ileum or colon which produces greater systemic bioavailability. A matrix system can be better defined as a well mixed system comprising of one or more drugs with gelling agent such as hydrophilic polymer [11]. However, Natural polysaccharides are coming under the category of “GRAS” (Generally recognized as safe) [12] thus resolving the general problems associated with safety [13]. The present study has been undertaken to investigate the targeting and release controlling properties of polymer of natural gums such as Pectin, Guar gum, Xanthan gum. Natural polymers are more superior to the synthetic polymer with respect to their highly organized macroscopic and molecular structure, this provides the strength and biocompatibility [14]. Thus, the present investigation is aimed at using the inexpensive, naturally occurring and abundantly available polysaccharides for colon drug delivery system. The colon targeted drug delivery system based on the pH sensitive polymers needs the threshold pH to release the drug. Which may not be available due to various reasons such as IBD , food, individual variations etc., where natural polysaccharides serve better than the synthetic system, thus in this work novel natural polymers are explored in designing colon drug delivery system.
In this study the chonobiolgical time dependent drug release devices were prepared by using the various natural macromolecules. The formulations were studied in vitro for their time dependent drug release pattern. The release pattern and kinetics of the drug release was analyzed statistically. The polysaccharide Pectin is used as a novel prime polymer since it has flexibility in handling and possess lots of advantages over other polymers. The famous conventional natural polysaccharides such as Xanthan gum and Guar gum and Pectin also used in the formulation design to prove the superiority of the Pectin over the other naturally occurring polymers which was known for their extensive research report but poor industrial applicability.
Propranolol HCl (Micro labs Bangalore, India), Guar gum, Xanthan gum, Pectin, Carbopol (Loba Chemie Pvt. Ltd, Mumbai, India). Di calcium phosphate (Finar Chemicals Ltd). Magnesium stearate (S.D Fine – Chem. Ltd, Mumbai, India).
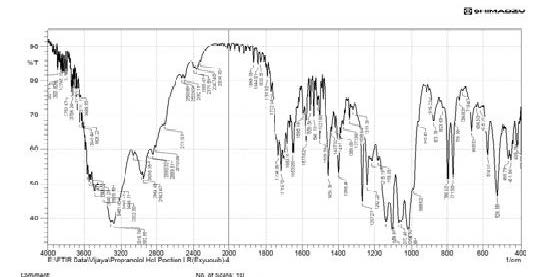
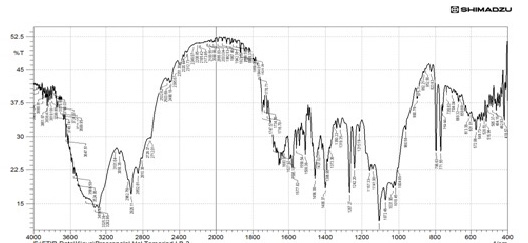
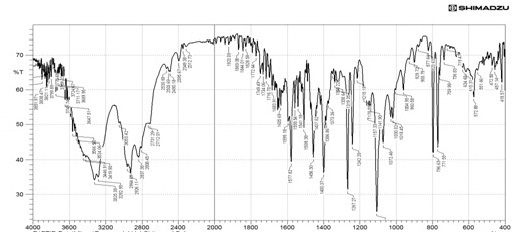
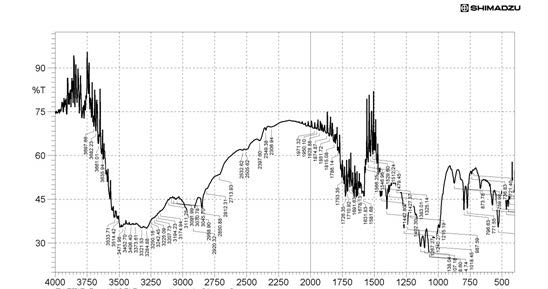
The drug polymer interactions were analyzed by FTIR spectrophotometer (Figure 1) (Perken-Elmer- spectrum-100 Japan). Two percent w/w of the sample, with respect to potassium bromide (KBr-SD Fine Chem. Ltd, Mumbai, India) was mixed with dry KBr. The mixture was ground into a fine powder using an agate mortar and then compressed into a KBr disc in a hydraulic press at a pressure of 10000 Psi. Each KBr disc was scanned 16 times at 2mm/size at a resolution of 4cm-1 using Carson apodization. The characteristic peaks were recorded.
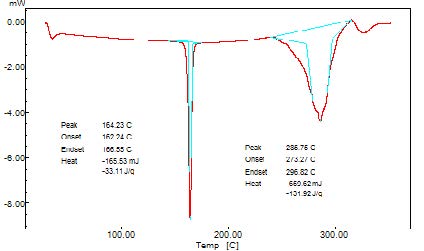
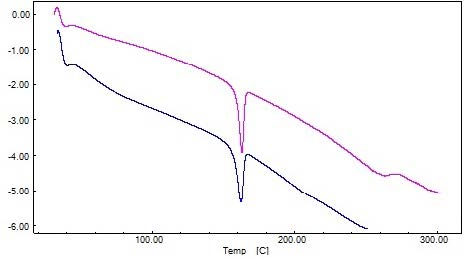
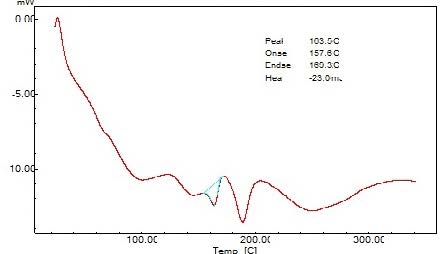
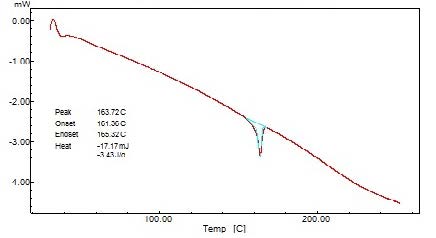
The DSC thermogram was obtained using an automatic thermal analyzer system. Temperature calibration was performed using indium as the criterion. Samples were crimped in a standard aluminum pan and heated from 50 – 300 0C at a heating rate of 10 0C/min under constant purging of nitrogen at 30ml/min. An empty pan sealed in the same manner was used as a reference (Figure 2).
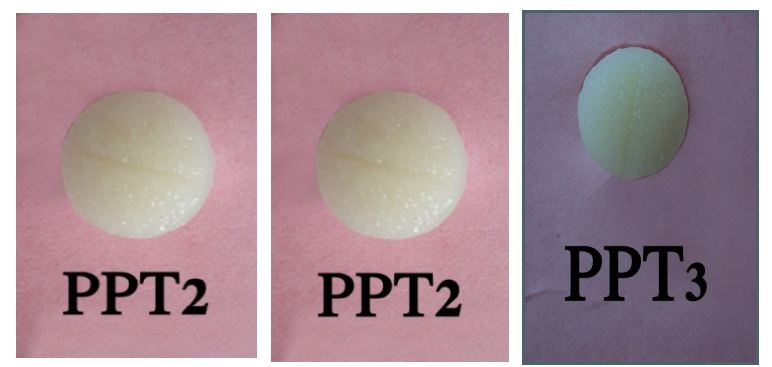
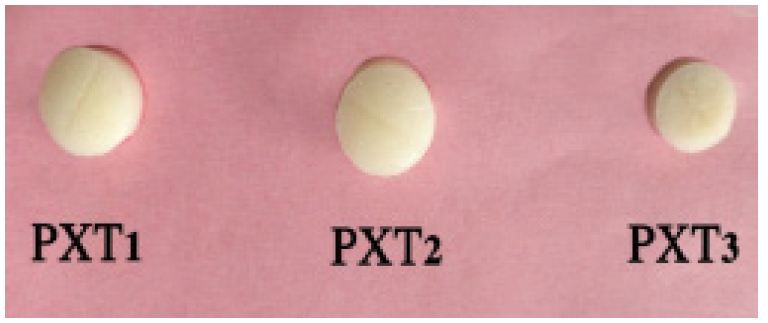
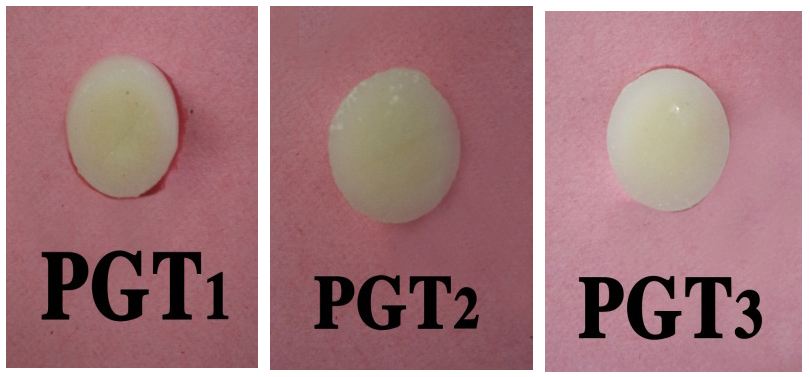
The Propranolol HCl matrix tablets were prepared by using various concentrations of natural polymers such as Pectin, Guar gum and Xanthan gum. The ratio Drug polymer blend was 0.5:1 for 250mg tablet, 1:1 for 300mg tablet and 0.5:1.5 for 350mg tablet. The composition of different formulations was represented in table 1. The various ingredients of each formula were weighed and passed through sieve no. # 80 and the resulting mixture was compressed into tablets on a rotary tablet punching machine (Table 1, 2 and 3) (Figure 3).
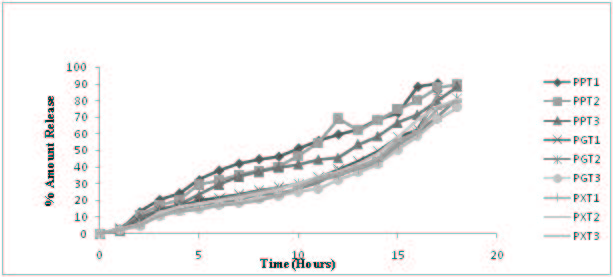
The in vitro release study of Propranolol HCl matrix tablets were carried out for 18h using paddle type dissolution test apparatus containing 900ml of dissolution medium. The pH 1.2 HCl for the first 1.5h at 37 ± 0.5 °C with the speed of agitation at 100 RPM was maintained. Then the dissolution medium was changed with pH 6.8 phosphate buffer solutions for further 2h. Again the dissolution medium was changed by replacing with pH 7.4 phosphate buffer solution for further 15h. At a prefixed time of every 1h, 5ml of aliquots were withdrawn and analyzed spectrophotometrically for the drug content at 290nm. The volume of dissolution medium was adjusted to 900ml at every 1h with the fresh medium (Figure 4).
The six albino rats (weighed 120- 160 g) maintained in the normal dietary conditions were chosen for the study to collect rat cecal contents. The study of the animals was carried out after the scrutiny and approval of the institutional animal ethical committee (IAEC). The study was designed to assess the enzymatic activity of the colonic bacteria on the matrix tablets. To assess the enzymatic activity, drug release studies were performed in the pH media mimicking the colonic pH conditions in the presence of rat cecal contents. Normal diet conditions were maintained for the rats. Previously rats were induced for the enzymes in the colon by oral administration of Pectin dispersion was given orally to stimulate the enzymes in the colon to act on Pectin and other polysaccharides. The 1ml of 2% w/w Pectin dispersions provide the best conditions for the colonic degradation by bacteria. The procedure involves the oral administration of 2% w/v Pectin dispersions for 7days to induce polysaccharide degrading enzymes in the colon. Just about an hour before the commencement of in vitro drug release studies albino rats were sacrificed and cecal contents were collected by opening the abdomen. The cecai was ligated both the ends with the help of thread and removed carefully and weighed. The contents were immediately transferred into 6.8 pH phosphate buffer saline bubbled with carbon dioxide. Finally, 4% w/v of cecal dilution was prepared by pooling the cecal contents of four albino rats. The 4% w/v cecal content was introduced into the dissolution process after four hours of study. The samples were collected at the predetermined time intervals and medium replaced with fresh media bubbled with carbon dioxide as the cecum is naturally anaerobic. The withdrawn samples were centrifuged to remove solid contents. The supernatant liquid was collected and filtered through a bacteria proof filter. The Propranolol HCl contents were analyzed by double beam UV spectrophotometer at a wavelength of 290nm.
The dissolution test carried out as per United States pharmacopoeia. After 2h of operation in 0.1N HCl for acid stage an aliquot was removed from the fluid, and the remaining solution discarded. The tablets are retained in proper order, then each will be reverted to its respective vessel later and proceeded immediately as directed for buffer stage (pH 6.8 phosphate buffer). The Propranolol HCl was analyzed by using UV Spectrophotometer at the wavelength of maximum absorption at 290nm on filtered portions of the solution under test suitably diluted with dissolution medium. After 2h, 5ml was taken and the Propranolol HCl dissolved was determined by using UV Spectrophotmeter as above. In buffer stage pH 7.4 phosphate buffer solutions were implemented until the maximum amount of drug is released and it was determined at the wavelength of maximum absorption at 290nm on the filtered portion of the solution under test, suitably diluted with dissolution medium.
The cumulative amount of Propranolol HCl release from the formulated tablets at different intervals were fitted with following plots, cumulative % drug release versus Time (zero-order kinetic model); log cumulative of % drug remaining vs. Time (first order kinetic model); cumulative % drug release vs. square root of Time (Higuchi model); log cumulative % drug release versus log time (Korsmeyer-Peppas model) and cube root of drug % remaining in matrix vs. Time (Hixson-Crowell cube root law) to characterize the mechanism of drug release. To analyze the in vitro release data various kinetic models were used to identify the release kinetics. The Zero order rate Eq (1) describes the systems where the drug release rate is independent of its concentration. The first order Eq (2) describes the release of the system where release rate is concentration dependent. Higuchi described the release of drugs from insoluble matrix as a square root of time dependent process based on Fickian diffusion Eq (3). The Hixson-Crowell cube root law Eq (4) describes the release from systems where there is a change in surface area and diameter of particles of tablets (Table 4) (Figure 5, 6 and 7).
Zero order Kinetics: Zero order kinetics, it describes the system in which the drug release rate is independent of its concentration.
Qt = Q0 + K0 t ------------1
Where the Qt= amount of the drug dissolved in time t and the Q0 = initial amount of drug in the solution, which is often zero and K0 is the Zero order release constant. If the Zero order drug release kinetic is obeyed, then a plot of Qt versus t will give a straight line with a slope of K0 and an Intercept at Zero.
First Order Kinetics: In first order kinetics, it describes the drug release from the system in which the release rate is concentration dependent.
Log Qt = log Q0 + Kt/2.303 --------2
Where Qt is the amount of drug released in time t. Q0 is the initial amount of drug in the solution and K is the first order release constant. If the first order drug release kinetic is obeyed, then line with a slope of Kt/2.303 and an intercept at t=0 of log Q0.
Higuchi Kinetics: In Higuchi model it describes the fraction of drug release from a matrix is proportional to the square root of time.
Mt/Mα = Kh t1/2 ------------3
Where Mt and Mα are cumulative amounts of drug release at time t and infinite time, and KH is the Higuchi dissolution constant reflection formulation characteristics. If the Higuchi model of drug release (that is Fickian diffusion) is obeyed, then a plot of Mt/Mα versus t1/2 will be a straight line with slope of KH.
Korsmeyer-Peppas Kinetics: In Korsmeyer-Peppas model or the power law describes the drug release from the polymeric system in which release deviates from Fickian diffusion, as expressed in following equation.
Mt/M∞ = kn------------4
Log [Mt/M∞] = log k + n log t -------5
Where Mt and M∞ are cumulative amounts of drug release at time t and infinite time (that is the fraction of drug release at the time), k is the constant incorporating structural and geometrical characteristics of the controlled release device, and n is a diffusion release exponent indication of the mechanism of drug release for drug dissolution. To characterize the release mechanism, the dissolution data {Mt/M∞} versus log t will be linear with a slope of n and intercept gives the value of log k gives the value of k.
Korsmeyer derived a simple relationship that described the drug release from a polymeric system Eq. (5). To find out the mechanism of drug release, first 60% drug data were fitted in Korsmeyer-Peppas model:
Mt/M∞ = kn -------------6
Where Mt/M∞ is fraction of drug released on time, k is the rate constant and n is the release exponent. The ‘n’ is an exponent used to characterize different release mechanisms for cylindrical shaped matrices. If the exponent n=0.45, then the drug release mechanism is Fickian diffusion, and if 0.45<n<0.89, then it is non-Fickian anomalous diffusion. An exponent value of 0.89 indicates Case-II Transport or typical Zero order release. If n>0.89 it is super case transport.
Hixson-Crowell Kinetics: In Hixson-Crowell cube root law the equation can be written as follows
QO1/3 – Qt1/3 = Khc t ----------4
Where Qt is the amount of drug release in time t, Q0 is the initial amount of the drug in tablet and KHC is the rate constant for the Hixson-Crowell rate equation [15].
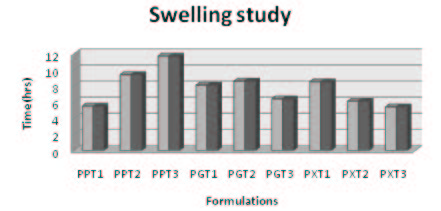
The swelling study of Propranolol HCl matrix tablets (Figure 8) was carried out in two aqueous media. pH 1.2 HCl buffer solution (2h) and pH 6.8 phosphate for next 6h. Accurately weighed matrix tablets were immersed in 50ml of pH 1.2 HCl buffer and after 2h, the tablet was transferred in to 50ml of pH 6.8 phosphate buffer solution. At a fixed time interval the tablets were separated from the solution, wiped gently with filter paper and weighed. The dynamic weight change of the tablet with respect to time was calculated according to the formula.
Swelling index = ((Ws-Wi)/Wi) 100
Where
Ws- is tablet in the swollen state
WI – is the initial weight of the tablet.
Linear regression analysis was performed to compare the mechanism of drug release of different formulations.
The Propranolol HCl matrix tablet was prepared in this study by direct compression techniques. Previously the drug was analyzed for various parameters for identification and purity. The compression of the tablet involves preformulation and the study of precompression and post compression parameters. The drug excipient compatibility study was analyzed by using techniques such as FTIR and DSC. The reports such as FTIR spectrum and DSC thermograms were ruled out the interaction between the drug and the used excipients.
The interpretation of FTIR data states that the Propranolol HCl is compatible with used excipients. The DSC thermogram was developed for each excipient by mixing with the drug. The pure drug Propranolol HCl showed the sharp endothermic peak at 165 0C. Further the drug polymer mixture of Pectin, Guar gum, Xanthan gum also showed the peaks at the range of about 164 0C, 165 0C, 163 0C respectively. Since the DSC study confirmed that the absence of interaction between drug and the used excipients. Before the compression of the tablets the optimized granules were developed by various trials performed during preformulation studies. The precompression parameters were optimized cautiously before the development of formulation, since the formulation was compressed by direct compression technique. The preformulation parameters for Pectin formulations PPT1- PPT3 were found satisfactory. The flow property of PPT1- PPT3 was found to be 19.5, 19.9, and 20.2 respectively. The Guar gum formulations (PGT1-PGT3) had shown the appreciable flow characteristics with values 20.44, 19.05 and 18.74 respectively. The the flow values of Xanthan gum formulations (PPT1-PPT3) was 23.21, 20.2 and 26.92 respectively. The compressibility index of Pectin formulations (PPT1-PPT3) was found to be around 21.21% for PPT1, 21.42% for PPT2 and 17.44% for PPT3. The Guar gum formulation PGT1- PGT3 has shown the compressibility index value of 10-11% . In which PGT3 showed the lowest value of 6.06%. All the Xanthan gum formulations (PXT1- PXT3) shown the compressibliity value around 8%, except PXT3 which showed the highest value of 10.61%.
The post compression parameters were analyzed and optimized during the compression. The weight variation of the tablet was controlled within the limit with minimum standard deviation. The weight variation of the tablets was made with in the limit by controlling the thickness of tablet during compression. The Pectin tablets (PPT1- PPT3) shown the hardness of 5.4-7.5 kg/cm2 with minimum standard deviations. The formulation PPT3 showed the highest hardness value of 7.5 kg/ cm2 ± 0.6 S.D. The hardness of the Guar gum tablet was between 5.5-7.5 kg/cm2 with minimum S.D. In which PGT2 showed the highest hardness value of 7.5 kg/cm2 ± 0.2 S.D. The hardness of the Xanthan gum tablet was between 5.5 - 6.5 kg/cm2 with minimum S.D. The formulation PXT2 showed the highest hardness of 6.5 kg/cm2 ± 0.2 S.D. The content uniformity was found within the limits. The friability of all the formulations was less than 1% which is also in recommended limits.
The swelling, study was carried out using suitable procedure and determined by using the suitable formula. The formulations PPT1-PPT3 shown the swelling index values of 7.4 at 4h and showed the maximum swelling at 8h with the value of around 11.7. The formulation which contains the highest amount of Pectin shown the highest swelling index values demonstrated that Pectin is superior in swelling property. Among all the polymers Pectin formulation showed the highest swelling index value as compared to Guar gum and Xanthan gum based formulations. Guar gum based matrix tablets showed the swelling index value of around 8.6 and demonstrated the better swelling property. Xanthan gum was comparatively better in swelling property as compared to Guar gum but the swelling values were very less with respect to Pectin formulation. The colon targeted drug delivery system is expected to maintain the intactness and integrity throughout the GIT and swelling study confirmed the same. The in vitro studies also confirmed the integrity of the tablet until it reaches the colon. The swelling of the tablet may also increase the residence time of the tablet in the colonic region due its bulkiness.
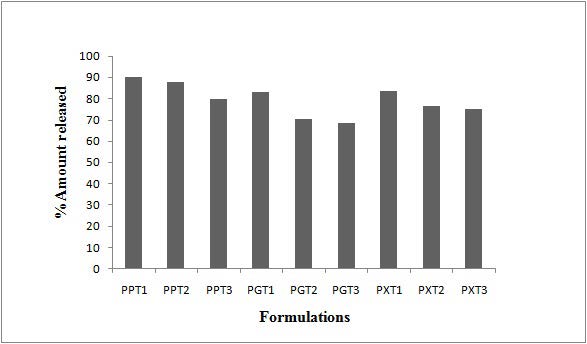
In vitro drug release study was performed on all the formulations in varying pH conditions such as pH 1.2, pH 6.8 and pH 7.2 to mimic the GI pH conditions. The rat cecal contents were incorporated in the dissolution media in order to mimic the colonic environment. The results of the Pectin based matrix tablets (PPT1-PPT3) revealed that Pectin could control the drug release until the dosage form reaches the colon. All the Pectin based matrix tablets showed less than 24% of the drug release in first 4h of the dissolution study. This is the expected lag time for the dosage form to reach the colon. A formulation PPT1 and PPT2 showed more or less same dissolution pattern. The PPT1 and PPT2 released 90% and 89% of the drug, respectively up to 17h of the dissolution study. The formulation PPT3 showed a significant retardation in drug release. These formulation takes 18h to release 88% of the drug. Even after a 12h of dissolution only about 45% of the drug was released from PPT3. It was not desirable for colon drug delivery since PPT3 can not be considered as better formulation. Since colon targeted drug delivery system are expected to release the drug in significant and reproducible manner after a lag time. Among the Pectin formulations PPT2 was found to be better formulation with respect to formulation and compression characteristics. The release pattern of the PPT2 was also satisfactory and it can be defined as the optimized formula of overall formulation design.
The formulation (PGT1-PGT3) prepared with Guar gum showed a significant delayed release profile as like Pectin based matrix tablets. PGT1 and PGT2 showed 16% and 14% of drug release after 4h of dissolution study. Guar gum based matrix tablets could controlled release upto 17h.The PGT3 released in a slowest pattern as compared to other formulations since it contains the highest proportion of polymer. The formulation took 18h to release 75% of the drug. But it took at least 11h to cross 26% of the drug release. The study states that the drug is not released from the Guar gum tablets even after a lag time which is undesirable and Guar gum formulations cannot be considered as the optimized formulation. The Xanthan gum based formulations (PXT1-PXT3) showed a desirable drug release pattern. All the formulations released less than 16% after 4h of the dissolution study. The formulation PXT1 and PXT2 released 83% and 76% of the drug respectively after 17h of dissolution study. As expected the formulation PXT3 containing the maximum amount of polymer controlled the release for the extended period of time and 79% of the drug was released after 18h of dissolution study. This may be due to the high concentration of polymer and high aqueous solubility of Xanthan gum. The same pattern is observed with Pectin and Guar gum formulations too. As the concentration of natural polymers increased the drug release was decreased.
The release profile of the developed formulation was fitted with various pharmacokinetic models in order to assess the controlled release pattern and mechanism of drug release.
The formulation PTT1 showed Zero order as the predominant release followed by Korsmeyer Peppas. In PPT2 drug release follows Peppas model indicated that the Zero order is the predominant release mechanism which was confirmed by the fitting with the Korsmeyer Peppas model. In PGT1-PGT3 Korsmeyer Peppas is the predominant release mechanism, followed by Zero order release. In PXT1-PXT3 Korsmeyer-Peppas is the predominant release mechanism followed by Zero order kinetics except PXT1. The ‘n’ value of the Peppas equation indicated that the values are >0.85 which indicated the super case-II transport for all the matrix tablets. The values are present in the table 4. The release kinetics revealed that the formulation PPT1-PPT2 released the drug by Higuchi kinetics described that the drug release from insoluble matrix follows fickian diffusion and drug release also influenced by geometrical changes in the formulation.
The optimized Propranolol HCl matrix tablets PPT1 was observed for the changes in the physical nature and tested for drug content. The in vitro drug release studies also performed again to analyze whether the storage conditions of the tablets caused any impact on the drug release profile or not. No remarkable physical changes in the tablet were observed. The drug content analysis indicated that there was no change in the content with 95.37±0.10. The dissolution testing reports before the storage of PPT1 batch was found to be 95.14 whereas after the storage the drug release was found to be 92%±0.37mg. There was no significant difference observed in the mean Propranolol release from the PTT1 matrix tablets after stored for three months at 40 0C /75% RH. Stability study reports indicated that the tablet was stable at the different storage conditions, but the elaborated stability study was required in long storage conditions to find the exact shelf life.
The Propranolol HCl delayed release matrix tablets was prepared successfully by using different natural polymers such as Pectin, Guar gum, and Xanthan gum. The matrix tablets were evaluated for various quality control parameters and the results were found to be satisfactory. Pectin was found to be the best polymer in formulation design by retarding Propranolol release until it formulation reaches the colon. Pectin also exetended its influence on the release mechanism. The formulation PPT1 was showed the drug release up to 17h of dissolution study and it also showed Zero order kinetics as predominant release mechanism and followed by Korsmeyer Peppas model. The formulation (PXT1-PXT3) was showing a significant delayed release profile as like Pectin. The Guar gum matrix tablets would be the slowest when compared Pectin and Xanthan gum. The short term stability studies conducted on the formulation revealed that the formulation is stable in varying environmental conditions but long term stability studies are recommended.