Clinical Characteristics and Treatment of Patients with Multiple Myeloma Using the Japan Medical Data Center Database
Background: The incidence of multiple myeloma (MM) is increasing in Japan. However, information on clinical characteristics and current treatments is limited. Such information is needed to inform future clinical research and to optimize management practices.
Methods: This retrospective cohort study describes the clinical characteristics and treatment patterns of MM patients aged ≥18 to <75 years (2009-2016) in Japan using the Japan Medical Data Center database, an employment insurance claims database covering 3.78 million non-government employees and their family members. Adults with a confirmed diagnosis of MM, no prior cancer, and at least a 12-month baseline treatment period for MM were followed until death, or study end, whichever came first.
Results: Of 966 patients with MM in the JMDC database from 01 July 2009 until 31 December 2016, 390 were eligible for the cohort analysis, of whom 226 (58%) did not receive any treatment. Of 164 treated patients; 73% were employees, 27% were family members, 65% were male and 77% were aged 36-65 years, reflecting the characteristics of the employment database. The median follow-up period after diagnosis was 26 months (range 1-75). Co-morbidities at diagnosis were hypertension (36.0%), bone fracture (20.7%), peripheral neuropathy (15.2%), renal failure (11.0%) and anemia (9.8%). Initial treatment was with a novel agent (bortezomib, thalidomide, lenalidomide) in 45.0% of patients, with steroids alone in 49.4% and with other agents, such as chemotherapy, in the remainder. At the end of the initial treatment phase, 16.5% began subsequent therapy and 11.0% had received transplant. By study end, 23% of patients received transplant and 8% developed at least one new malignancy.
Conclusion: The results from this study suggest that there is a relatively low rate of progression to advanced line treatment or retreatment in this young cohort of Japanese patients with MM.
Keywords: Bortezomib; Cohort Study; Japan; Multiple Myeloma; Second Primary Malignancy
Abbreviations CCI: Charlson Comorbidity Index; CI: Confidence Interval; ICD-10: International Classification of Diseases Tenth Revision; JMDC: Japan Medical Data Center; MM: Multiple Myeloma; SD: Standard Deviation.
Multiple myeloma (MM) is a commonly diagnosed hematological malignancy that shows geographic variability in incidence; being highest in Western countries and lower in Asia [1]. Over recent decades, the incidence of MM has been increasing in Asian countries, although few data are available that describe the disease burden, clinical features, or treatment patterns of MM in Asia [2-5].
MM is incurable, yet improved understanding of the pathophysiology of disease has allowed for the development of novel therapies, including immunomodulatory drugs such as thalidomide and lenalidomide, and targeted proteasome inhibitors such as bortezomib, which have substantially improved survival and quality of life for patients with MM [6-10]. Across Asia there are large disparities between countries in terms of economy, health-care infrastructure, and access to novel drugs, which may impede the delivery of optimal care to patients with MM in some regions. Guidelines for the management of MM in Asian countries take into account the variability in access to resources across the region [10]. The first-line treatment for younger patients with adequate organ and kidney function in countries with tertiary healthcare facilities is a combination of high-dose induction therapy (that would usually include bortezomib), followed by autologous stem cell transplant [10]. For transplant-ineligible patients, the traditional regimen of melphalan plus prednisone has been supplanted with a range of drug combinations using novel therapies.
traditional regimen of melphalan plus prednisone has been supplanted with a range of drug combinations using novel therapies.
As observed elsewhere in Asia, the incidence of MM in Japan is increasing and was 5-6-fold higher in 2010 than in 1975 [11]. The 2012 age-standardized incidence of MM in Japan was estimated to be 1.8/100,000, equating to 3311 newly diagnosed cases in that year [11]. Bortezomib was approved in Japan in 2006 for the treatment of relapsed and refractory MM, followed by thalidomide in 2008 and lenalidomide in 2010 [12]. Bortezomib has been authorized for use as first-line therapy since 2011 and lenalidomide since 2015.
To date, there is little information that describes treatment patterns for MM in routine practice across Asia. Such information is important for continuous improvement in MM management, to achieve optimal patient care and to understand the disease burden and healthcare services for MM patients in different Asian countries in a real-world setting. Cohort studies utilizing claims databases provide real-world insights into the healthcare management of specific medical conditions. This study aims to understand the disease characteristics and treatment patterns available for MM in Japan, a high-income country with universal health insurance coverage and an established framework for healthcare delivery.
The Japan Medical Data Center (JMDC) is an employment health insurance claims database that includes approximately 3.78 million non-government employees and their family members up to a maximum of 75 years of age (or approximately 2% of the Japanese population), since 2009. Patient claims information (inpatient, outpatient, and pharmacy) derived from all healthcare services under different health insurance systems are captured in the database. Diagnoses are coded under the International Classification of Diseases Tenth Revision (ICD-10) Patients who become unemployed because they are not fit for work are withdrawn from employment insurance plan, and data collection ceases. Therefore, the death records for patients in the database are not complete. Deaths were identified from hospital records and were confirmed by checking the database for any follow-up visits. If no more claims were seen in the database after death, it was considered a confirmed death. Considering that employment status might affect treatment and the availability of a complete record in the JMDC database, we analyzed employees and their family members separately.
The database containing anonymized data was licensed from Japan Medical Data Center Co., Ltd. by Janssen R&D. Based on the Ethical Guidelines on Biomedical Research Involving Human Subjects (Ministry of Education, Culture, Sports, Science and Technology, and Ministry of Health, Labour and Welfare of Japan), studies conducted on data from medical databases that does not comprise of any interventions or interactions with patients, obtaining written informed consent is not required.
Adult patients at least 18 years of age who had a confirmed diagnosis of MM (ICD-10 code C90.0) between 01 July 2009 and 31 December 2016, who had been in the JMDC claims database for at least 12 months prior to the diagnosis index date, and who had at least one hospital visit after the diagnosis, were included in the study. The diagnosis index date was defined as the date of first diagnosis of MM in the database, and the baseline period as 12 months prior to the diagnosis index date.
Patients were excluded if they had a diagnosis of a malignancy other than MM during the baseline period, if they had received anti-cancer treatments or had undergone a transplant prior to the index date. Eligible patients with MM were followed up from the index date until death, disenrollment, or the end of study period (31 December 2016), whichever occurred first.
Treatments related to MM including chemotherapy, novel agents and steroids that were coded by Reimbursement Code were examined. Drugs were captured using Anatomical Therapeutic Chemical codes. The first drug dispensed was defined as the initial treatment and the earliest date of the treatment was the treatment index date. MM treatments were described as the first and subsequent lines of therapy: First line therapy commenced on the date of the first prescription claim for a MM treatment following the diagnosis index date. This line of therapy was considered to be ended whenever one of the following scenarios occurred: (1) a ≥ 60 day gap in all MM treatments included in the line of therapy; (2) the addition of a new MM treatment to the current regimen > 90 days after the start of the line therapy. Importantly, if a new MM treatment was added within 90 days from the start of the previous line of therapy, it was considered an addition to the existing line rather than a new line of therapy; (3) death, or the end of the data. Introduction of a new treatment regimen after first line treatment ceased was considered as subsequent treatment.
If lenalidomide monotherapy was started within 60 days from the last first line therapy dispensed, then the line of therapy was classified as first line maintenance treatment and not as subsequent treatment. Retreatment was defined as re-initiating a treatment regimen for a patient after a gap of more than 180 days.
For patients who underwent transplant, any MM treatment in the first 90 days after the transplant date was considered consolidation therapy. Transplant included hematopoietic stem cell transplantation, bone marrow transplantation, and autologous or allogenic peripheral stem cell transplantation.
The Charlson Comorbidity Index (CCI) was used for evaluating comorbidities over the 12-month baseline period and for the 3-month period prior to transplant. Comorbidities associated with MM were identified using ICD-10 codes for anemia, bone fracture, gastrointestinal bleeding, hypertension, major bleeding, neutropenia, peripheral neuropathy, pneumonia, renal injury/renal failure, thrombocytopenia, and venous thromboembolism.
Analyses were stratified by age (18-55, 55-65 and 65-75 years). Student’s t tests for continuous variable were conducted to assess the differences between groups. Analyses for categorical variables were based on the Pearson chi-square test and Fisher exact test.
The incidence of second primary malignancies was reported per 1000 person-years. Follow-up for the occurrence of second malignancies began at the index date and ended with the first record of a second primary malignancy, death or the patient’s last record in the database. Cases with a second primary malignancy diagnosed within 60 days of the diagnosis of MM were excluded. The one-year period prior to MM diagnosis was evaluated to ensure that each event of interest was not a pre-existing condition. All analyses were performed using SAS Version 9.4 (Cary, NC, USA).
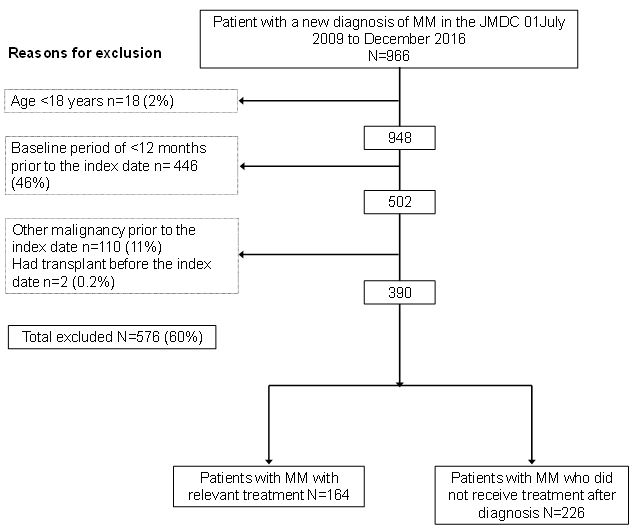
There were 966 patients with MM in the JMDC database from 01 July 2009 to 31 December 2016. Almost half of the patients with MM did not have an available baseline period of 12 months prior to diagnosis, and 11% had another malignancy at the time of diagnosis (Figure 1). Of the 390 potentially eligible patients with newly diagnosed MM, 226 (58%) did not receive any MM treatment (chemotherapy, novel agents or transplant) after diagnosis, leaving a total treated cohort of 164 patients.
Compared to patients who received MM treatment, patients who did not receive any treatment for MM were significantly younger (mean 49.8 years versus 53.8 years, p=0.0021), were more often diagnosed as an outpatient than as an inpatient (96.9% versus 82.9%, p<0.0001) and remained in the JMDC database for a significantly shorter period (mean 19.5 months versus 28.0 months, p<0.0001) (Table 1). The percentage of patients who were <56 years of age was 59.7% (135/226) among untreated patients versus 48.8% (80/164) among patients who received treatment. There was no significant difference between untreated and treated populations in terms of the CCI at diagnosis. However, untreated patients had significantly fewer bone fractures, major bleeding, or peripheral neuropathy at the time of diagnosis than treated patients. The percentage of patients with individual co-morbidities tended to be similar or lower in treated than in untreated patients, although the percentage with myocardial infarction, peripheral vascular disease, cardiovascular disease, renal disease and diabetes with chronic complications was higher in untreated than in treated patients.
tended to be similar or lower in treated than in untreated patients, although the percentage with myocardial infarction, peripheral vascular disease, cardiovascular disease, renal disease and diabetes with chronic complications was higher in untreated than in treated patients.
The percentage of all patients diagnosed with MM who did not receive treatment increased from 48.3% in 2011 to 73.9% in 2016 reflecting shorter follow-up periods later in the study. The proportion of older women (aged 65-75 years) who received treatment was 28% (5/18), versus 62% of older men (21/34).
The total treated population comprised 65.2% men and the mean age was 53.8 years. The mean CCI in the 12 months prior to diagnosis was 1.09 (SD 1.42). The most common CCI comorbidities were mild liver disease (19.5%), peptic ulcer disease (18.9%) and chronic pulmonary disease (16.5%). The most common MM related co-morbidities at diagnosis were hypertension (36.0%), bone fracture (20.7%), peripheral neuropathy (15.2%), renal failure (11.0%) and anemia (9.8%).
Of 164 patients in the treated study population, 73% (n=120) were insured as employees and 27% (n=44) were insured as family members (Table 2). 87.5% of employees were men and 95.5% of family members were women (p<0.0001). The mean age at diagnosis did not differ significantly between employees and family members with MM. There was no difference between patients insured as employees and patients insured as family members in terms of enrolment history, CCI and comorbidities, with the exceptions of bone fracture and major bleeding, which were more frequent among family members with MM than employees.
Of 164 patients who received treatment, there were 160 patients who received drug therapy - three patients received radiotherapy as initial treatment and one patient received transplant as initial treatment. Of these 160 patients, 72 (45.0%) received initial treatment with a novel agent (bortezomib, thalidomide, lenalidomide), and 69 (43.1%) of these received bortezomib (Table 3). 47.4% of employees versus 31.8% of family members commenced initial MM treatment with bortezomib (Table 4). There were 79 patients (49.4%) who were treated with steroids alone. The proportion of family members who were treated with steroids alone was 61.4% (27/44) versus 44.8% (52/116) of employees.
The median time to initial treatment from the diagnosis index date was 26.5 days (range 0-1937). 66.5% of patients (109/164) commenced treatment within 90 days after the diagnosis of MM, and 31 patients (18.9%) did not commence treatment for more than 1 year after diagnosis.
The median duration of treatment for bortezomib-based regimens was 164.5 days (range 18-1270) in non-transplanted patients, and 144 days (15-448) in patients who underwent transplant. Median treatment duration was 120 days (range 1-1837) for regimens that did not include bortezomib (Table 3).
There were 27 patients who went on to receive subsequent therapy (Table 5). The majority of these patients had received a bortezomib-containing regiment for first line therapy (25/27, 92.3%) and 13/27 (48.1%) also received a bortezomib-containing regimen for subsequent e therapy. Many of the subsequent regimens (16/27, 59.3%) included cyclophosphamide.
At the end of the initial treatment regimen, 32.3% (53/164) received no further treatment, 16.5% (27/164) began subsequent therapy, 11.0% (18/164) had received a transplant, 2.4% (4/164) commenced radiotherapy, 1.8% (3/164) was re-treated and 0.6% (1/164) of patients had died. There were 33.5% (55/164) of patients who continued to use first-line treatment until study end. Patient status at the end of initial treatment was similar for employees and family members (data not shown).
There were 37 patients who underwent transplant during the study period (Table 6). The percentage of patients diagnosed with MM each year who had transplant ranged from 14.3% to 31.6% from 2011 to 2015. There were no transplants performed in 2010 (data only available for 6 months in 2010) and only one (4.4%) in 2016. The mean time from the diagnosis index date until transplant was 257.1 days (SD 150.4). Transplant was performed between 91 and 270 days after diagnosis in 67.5% of patients, 271-365 days in 21.6% of patients, and after more than 1 year after diagnosis in 10.8% of patients.
Patients who did and who did not receive transplant were similar in terms of gender, insurance status (employee or family) and enrolment history (Table 6). Patients who underwent transplant were older than patients who did not receive transplant (mean 56.3 years versus 53.0 years, respectively, p=0.0436). However, 95% of transplanted patients were aged 36-65 years and only two patients (5.4%) were 66-75 years of age. By contrast, 18.1% of non-transplanted patients were aged 66-75 years. Compared to patients who did not receive a transplant, patients who underwent transplant had a significantly lower CCI score at diagnosis (mean score 1.2 versus 0.7, respectively, p=0.0236). However, a statistically significant difference in specific underlying diseases was only observed for rheumatic fever (there was no transplant patient who had underlying rheumatic fever, versus 11.8% of non-transplanted patients, p=0.0240).
A comparison of the clinical status of patients who received transplant at baseline with those 3 months prior to the transplant showed evidence of clinical deterioration prior to transplant (Table 6). Prior to transplant there was a significant increase in the CCI (mean score increased from 0.7 to 4.6), and significantly higher rates of congestive heart failure, liver disease, major bleeding, and neutropenia.
All transplanted patients received treatment combinations that included bortezomib and dexamethasone, either with cyclophosphamide (n=19, 54.3%) or without cyclophosphamide (n=15, 42.9%) (Table 3). Two patients also received lenalidomide. Compared to the transplanted population, fewer non-transplanted patients received initial treatment with bortezomib (27.2%, 34/127), and more than half of the non-transplant patients (63.2%, 79/127) received initial treatment with steroids alone.
There were 25 patients who received consolidation therapy post-transplant: 16 patients (64%) received steroids alone (hydrocortisone in 15/16), four patients received a bortezomib-based regimen and four patients received a lenalidomide-based regimen (Table 7).
By study end, 23% (37/164) of patients had received transplant and five transplant recipients had died. In additional to the 34% (55/164) of patients who continued first line treatment and 32% (53/164) who received no further treatment, 5% (8/164) of patients continued subsequent treatment and a total of 7% (11/164) of patients had died.
There were 13/164 treated patients (8%) who developed at least one other malignancy over the observation period (incidence 35.74 per 1000 person-years, 95% CI 19.03-61.12). There were seven patients who developed a hematologic malignancy (incidence 18.92 per 1000 person-years, 95% CI 7.61-38.99) and six who developed a solid tumor (incidence 16.19 per 1000 person-years, 95% CI 5.94-35.24). The median time from the diagnosis of MM to the diagnosis of the second primary malignancy was 330 days (range 98-1254). All but five patients were diagnosed with a second malignancy within 1 year after the MM diagnosis.
The most common second primary malignancies were classified as ‘Secondary malignancies of other sites’ and ‘Multiple myeloma and malignant plasma cell neoplasms’ (after exclusion of ICD-10 C90.0), which were each diagnosed in four patients (incidence 10.77 per 1000 person-years, 95% CI 2.93-27.57). Three patients developed ‘Other and unspecified types of non-Hodgkin’s lymphoma’ (incidence 8.01 per 1000 person-years, 95% CI 1.65-23.41) and one patient each had ‘Malignant neoplasm of prostate’ and ‘Malignant neoplasm without specification of site’ (incidence of each 2.66 per 1000 person-years, 95% CI 0.07-14.82).
We used the JMDC database to describe the clinical and treatment characteristics of patients with MM in Japan. The JMDC covers approximately 2% of the Japanese population but is limited to employees from non-government organizations and their families, and all members are <75 years of age. Therefore, while the JMDC population is not representative of the general Japanese population, it can be considered representative of the working population and their families.
Consistent with the characteristics of the database we observed that patients with MM in our study were younger, and had lower rates of renal impairment and anemia than reported in other studies of MM in Asia [12-14]. Compared with a median age of 53.0 years in the JMDC database, patients with MM notified by 38 affiliated hospitals to the Japanese Society of Myeloma (2001-2012) had a median age of 67 years and the mean age was 68.7 years in patients with MM diagnosed between 1997 and 2013 who were identified from a nationally representative insurance claims database in Taiwan [12,14].
Amongst the 390 patients diagnosed with MM between 2009 to 2016 in the JMDC database, 58% received no treatment for MM during the study period, potentially indicating patients with slow-progressive disease, mis-coding or wrong initial diagnosis. Consistent with this hypothesis, the untreated population were younger than the treated population, were more likely to be diagnosed as an outpatient, had fewer MM-related comorbidities at diagnosis, and moved out of the JMDC database more rapidly, as evidenced by shorter length of enrollment in the database after the diagnosis index date, potentially suggesting greater fluidity in employment opportunities during the study period. The percentage of patients diagnosed with MM who did not receive treatment appeared to increase each year, such that in 2016 only 26.4% of patients diagnosed with MM received treatment. This could be due to the shorter period of follow-up for patients diagnosed later in the study, and because the actual number of patients who received an intervention or treatment may be under-reported because of a 2-year window allowed before claims need to be lodged.
The JMDC database provided opportunity to assess differences in clinical characteristics and treatment patterns of MM among employees versus family members. In the treated population, more employees were men, and more family members were women, reflecting the balance of employment between men and women in Japan (labor force participation rate 49.1% for women versus 70.2% for men, 2015) [15]. There were some trends in the choice of initial treatment between employees and family members, although it is not clear why this should be the case given that both cohorts were of similar age and clinical status: Compared to employees, more family members were treated initially with steroids alone, and fewer family members received first-line treatment with a regimen that contained bortezomib. However, at the end of the initial treatment regimen, a similar percentage of employees and family members had received transplant (11.7% versus 13.6%).
Only 45% of all treated patients received a novel agent as first line therapy even though novel agents were available in Japan throughout the study period, with thalidomide approved for use in relapsed/refractory MM since 2008 and bortezomib since 2011 [12]. Multivariate analysis of a cohort of 2234 patients with MM in Japan identified that overall survival was significantly improved when novel therapies and/or transplant were used for initial treatment; median overall survival was 46.1months for patients receiving conventional therapy versus 62.5 months when novel agents were used and 132.3 months when novel agents were combined with transplant [12].
Compared to the general population, younger persons diagnosed with MM might be expected to receive more aggressive treatment, such as high rates of transplant, and to have a better prognosis [16]. In our study, almost one-half of the treated population with MM in the JMDC were <56 years, yet 16.5% of patients received subsequent therapy and only 11.0% had received transplant by the end of the initial treatment phase, which is lower than might be expected in view of the young population. A study in Australia of transplant-eligible patients recorded upfront transplant in 55% of patients <70 years of age, and in 62% of <65 year-olds with minor/no co-morbidities [17]. This could reflect underuse of transplant as a treatment option in Japan. However, the JMDC database did not allow identification of specific patients who were transplant-eligible and the rates of transplant with other studies cannot be directly compared. The overall rate of transplant during the study period was 22.6%, which is lower than the overall rate of transplant in the US which increased steadily between 2008 and 2013, reaching 30.8% in 2013 [18]. However the 22.6% transplant rate in the JMDC appears to be comparable with the overall rate of 19.8% across seven upper-middle and high-income countries in Asia (China, Hong Kong, Japan, Korea, Singapore and Taiwan and Thailand) [13].
The incidence rate of developing other malignancies among the treated population was 35.74 per 1000 person-years, which is higher than the rate of second primary malignancy reported in MM patients in Taiwan (9.36 per 1000 person-years) [19]. This study used Taiwan’s National Health Insurance Research Database which covers the entire population in Taiwan throughout life. Enrolment in the Insurance database only ceases when the patient is no longer a citizen. By contrast, withdrawal from the JMDC occurs when employment ceases or when the individual reaches 75 years of age, which is likely to have biased the incidence of secondary primary malignancies in our cohort. In addition, the JMDC has fewer individuals enrolled compared to the Taiwan’s National Health Insurance Research Database, which resulted in a smaller pool of patients with MM in our study, leading to wide 95% CIs on the estimates of the incidence of second primary malignancies. However, our estimate is within the range of other published estimates among patients with MM which range between 11.6 to 40.6 per 1000 person-years [20]. Differences in estimates may relate to features of the database used, the population studied rather and the length of survival.
Potential limitations of the study relate to the limitations of the JMDC database. Diagnoses may be unreliable firstly because the health insurance claim form is not validated by a physician, but also because the disease name on the claim form only serves as a reference for prescribing drugs and procedures. Therefore, some diseases or drugs at very low price are not captured if no related medical expenses occur. The disease name on the claim form may be written in text without codes, and these cases would not have been detected in our study. If the patient changes insurer, the first day of treatment is‘re-set’ by the new insurer which means that for these patients the first data of treatment may be unrelated to the time of diagnosis. Finally, JMDC is an insurance database and enrolls from mid-to-large companies, and as such, patients under JMDC may receive better care/treatment than the general population. On the other hand, when patients are not fit for employment they are obliged to withdraw from the database, which may partially contribute to the low rate of advanced-line treatment or re-treatment observed.
The limitations of the JMDC database make it difficult to compare our study with other studies in Japan or elsewhere in Asia. Because the incidence of MM increases with age, the exclusion from the database of patients aged more than 75 years skews our data to a uniquely younger cohort of MM patients. Information on treatment patterns may also be restricted because only 42% of patients diagnosed with MM during the study period received treatment. Nevertheless, our study gives a picture of the management of younger patients with MM in Japan.
We used the JMDC employment database to describe the features of MM in a young population of employed persons and their families in Japan. While the results cannot be considered generalizable to the whole Japanese population, the study suggests a relatively low rate of progression to advanced line treatment or retreatment in this young cohort of Japanese patients with MM.
The study was supported by Janssen Research and Development (Titusville, New Jersey, United States). The sponsor planned the study, performed the analysis and reviewed the manuscript.
Writing assistance was provided by Joanne Wolter (independent writer on behalf of Janssen).
All authors are employees of Janssen Research & Development. HQ, LAR and YL report stock ownership in Johnson and Johnson.