Clinical Significance of Transforming Growth Factor β1 and Tumor Necrosis Factor Α in the Food-Protein-Induced Enterocolitis Syndrome in Children
Introduction: Nowadays food allergy continues its growth, especially in westernized countries and now it is recognized as a worldwide problem. TGF-β1 is a profibrotic cytokine, which plays an important role in promoting the structural changes in food allergy. For the patients with FPIES TNF-α also has an important role.
The objective: To determine the significance of the TGF-β1 and TNF-α in children with FPIES.
Materials and methods of the research: We examined 38 patients with FPIES at the age from 4 months to 3 years old. The control group consisted of 11 healthy children of the same age. The definition of TGF-β1 and TNF-α in serum was performed by an ELISA kits from Bender Medsystem (Austria).
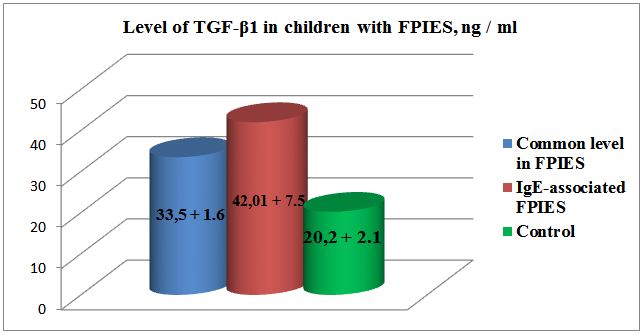
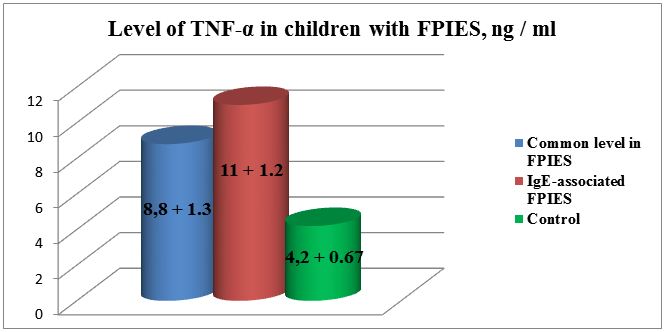
Results: The level of TGF-β1 in patients with FPIES exceeded the normal values and was equal to 33.5 + 1.6 ng /ml, with normal value 20.2 + 2.1 ng/ml, respectively, p <0.001. The indices of TNF-α also increased and amounted to 8.8 + 1.3 ng/ml in comparison with the normal 4.2 + 0.67 ng/ml, p <0.001. In our patients it was characterized by an increase in the amount of specific IgE to cow’s milk in 18 (47.3%) children. In these cases disease was more severe with vivid clinical manifestations (indomitable vomiting, stool with blood, expressed weight deficit). Besides that, among the patients in this group TGF-β1 level was significantly higher than in the control group, reaching 42.01 ± 7.5 ng/ml. TNF - α indicator were also increased: 11 ± 1.2 ng/ml.
Conclusion: It is believed that TGF-β1 inhibits allergic inflammation, but in our observations the increase in its values was established, especially in the group of children with high specific IgE levels to cow’s milk. It is likely, that the increase of TGF-β1 stimulates the release of TNF-α, which supports chronic inflammation in allergic diseases.
Keywords: Food Protein Induced Enterocolitis Syndrome; Ig E; TGF - β1; TNF - α
Food protein induced enterocolitis syndrome (FPIES) is a non-IgE-mediated reaction affecting predominantly infants and children. Majority of the cases occur during infancy, particularly with the early introduction of additional foods. With the general recommendation of delaying introduction of solid foods until 4-6 months, solid food FPIES develops later when caused by cow’s milk or soybean formulas [1].
FPIES is characterized by an abnormal response to ingested food resulting in gastrointestinal inflammation and increased intestinal mucosal permeability [2]. Although sensitization is a prerequisite, some cases apparently occurred following the first exposure, and that in its turn could indicate that the initial sensitizing exposure can be trivial [3,4].
FPIES is a very serious cause of emergency cases in infants. It is characterized by repeated vomiting, diarrhea, systemic anti-inflammatory response with progressing dehydration and even shock in 15-20% cases [5]. Due to its potentially serious clinical progressing and possible increase of the prevalence it is important to review the diagnosis in the cases with acute start of gastrointestinal diseases or shock [6]. After the exclusion of sepsis, disorders in substance exchange or anatomical abnormalities in gastrointestinal tract, the diagnosis can be confirmed on the basis of clinical criteria and/or standardized oral food provocation [7].
TGF-β is cytokine possessing suppressor impact on the dynamics of the immune response, anti-inflammatory effect protecting an organism from excessive production of toxic compounds by macrophages and other cells of inflammation [8].
There is description of the role of regulatory cytokine TGF-β1 in the suppression of T-cells and protection of mucous barrier of small intestine from the penetration of alien agents [9]. Besides that, TGF-β1 stimulates synthesis of collagen, fibronectine, and extra cellular matrix protein by means of alteration of integrines expression, which is very important for the decrease of intestinal permeability and its barrier function [10].
It is known, that in cases of non-IgE-associated allergic diseases T-cellular response is activated, increasing the amount of TNF-α by antigen-specific T-cells and IFN-γ, leading to increase of mucous permeability in small intestine. These data were confirmed in the researches by Saarinen KM, Kapel N, Majamaa H, who determined the rise of fecal TNF-α in children with intolerance of cow’s milk proteins [11-13]. Benlounes, et al., reported that, exactly non-splitted proteins stimulate secretion of TNF-α by mononuclei cells. They also demonstrated that the threshold for the activity of mononuclei cells in the patients with allergy to cow’s milk proteins with gastrointestinal symptoms was lower than that in the children with intolerance of cow’s milk proteins with dermal manifestations [14].
In spite of the consideration that FPIES is not IgE-mediated pathology, researchers detect simultaneous rise of IgE quite often, and that seriously perplex them [1,15]. These cases are called atypical FPIES. It is believed that the presence of increased IgE values is an unfavorable sign, the disease has a slower resolution [15-19].Others think that the reason for the shift of allergic reactions types in patients with FPIES is based on indefiniteness of the symptoms characterizing IgE and non-IgE-mediated reactions to food in young children [19]. Some studies report a possible simultaneous development of both IgE and non-IgE-associated reaction to the same food [15,16,19,20]. Characteristic feature is that phenomenon was demonstrated in allergies to cow’s milk proteins and fish [22].
Japanese researchers revealed increased amounts of specific IgE antibodies in 37% of the patients with FPIES. They consider the presence of specific IgE antibodies and eosinophilia characteristic for Th2 immune response do not exclude non-IgE-associated immune disease [22].
Thus, gastrointestinal food allergy has various manifestations, it is difficult to diagnose, and that increases the percentage of complications in cases when there is no pathogenetic therapy. The role of non-IgE-mediated mechanisms in the formation of the pathology is not revealed yet and demands further study.
Clinical significance of TGF-β1 and tumor necrosis factor α in FPIES is not clear, and now there is no an unequivocal notion about the processes occurring in patients’ organisms are reflected by the level of these cytokines in blood.
To determine clinical significance of transforming growth factor β1 and tumor necrosis factor α in food protein induced enterocolitis syndrome in children.
We observed 38 patients with food proteins induced enterocolitis syndrome in the age from 4 months to 3 years old, and the average age was 19 ± 4 months. Among them there were 20 boys and 18 girls. The control group involved 11 children of the same age. Physical development of the patients was assessed according to WHO criteria (2006) [23].
The following criteria, worked out by Sicherer SH, et al., were taken into account in the diagnostics of “food protein induced enterocolitis syndrome”: 1) repeated exposure of the certain food product caused vomiting and/or diarrhea within the following 24 hours without other reasons; 2) symptoms are limited in gastrointestinal tract; 3) exclusion of cause-effect product from the diet causes the salvation of the clinical symptoms within 24 hours [16].
In the process of the study we also determined the total amount of immunoglobulin E and specific immunoglobulin E to cow’s milk proteins. Definition of total IgE was performed using “EIA-total IgE” kits (Monobind) in human blood serum. The method was solid-phase enzyme immunoassay (one-stage “sandwich” type). Immunoglobulin E molecule conjugated first with anti - IgE-antibodies immobilized during solid-phase, and then, the complex attracted antibodies conjugated with the enzyme.
For the definition of IgE specific to food antigens we have chosen a set of AllergoEIA-specific IgE with liquid biotin-modified allergens used for quantitative definition of specific IgE in human blood serum (produced by Alcor-Bio). For the analysis we used «capture»-variant of enzyme immunoassay, where a solid-phase with adsorbed specific IgE antibodies and liquid biotin-modified allergens were applied. At the first stage the samples containing allergen-specific IgE, were incubated with the solutions of biotin-modified allergens in micro tab sockets; the surface of the sockets was covered by mice monoclonal antibodies to human IgE. If there was IgE specific to a certain biotin-modified allergen in the samples, we could observe simultaneous conjugation of IgE with the allergen and monoclonal antibodies to human IgE. After the removal of non-conjugated material we added streptavidine horse-radish peroxydase conjugate into sockets. During the second incubation streptavidine horse-radish peroxydase conjugate bond biotin-modified allergen. When the content of sockets was removed and sockets were washed, the excess of streptavidine peroxydase was deleted. During the incubation with chromogen solution (tetra methylbensidine, TMB) in substrate buffer there was staining of the solution in sockets. Staining intensity was directly proportional to the amount of conjugated allergen-specific IgE. Measurement of the optic density was performed using spectrometer with the wave length 450 nm and 405 nm. For the quantitative expression of the concentration of specific IgE to the same micro tab we applied calibrating samples with known concentrations of total IgE incubated with anti-IgE-biotin conjugate. The second incubation with the conjugate of streptavidine peroxydase was performed similarly for the patterns and calibrating samples. After the change of the optic density of the solution in the sockets the concentration of specific IgE expressed in International Units (IU) was calculated according to the calibrating charts.
Definition of lymphoquin-producing ability of T-lymphocytes to food allergens was done in compliance with Mirzamukhamedov’s method [24]. The essence of the method is detection and definition of lymphotoxin concentration in supernatant liquid of T-lymphocyte culture received after the stimulation of the cells by food allergens. For the analysis we needed 3-4 ml of heparin added blood. Isolation of lymphocytes was carried out according to Boyum A, on phycol-verographin gradient with 1.077 g/ml density with acceleration equal to 1500 rev. per min for 30-35 minutes [25]. A ring of mononuclei cells was gathered in the interphase of plasma and gradient; two times it was washed in the substratum 199 for 10 minutes with 1000 rev. per min, while the concentration of lymphocytes was brought to 1*106 cells in one ml. Then the suspension of lymphocytes was poured into 3 test-tubes 0.1 ml each: we added 0.1 ml of the allergen into the first test-tube (test sample); 0.1 ml of the substratum 199 was added to the second test-tube (control sample); and 0.1 ml of normal saline was added into the third test-tube for the standard control (spontaneous soluble factor). Both test-tubes were incubated in 37 °C for 18 hours with periodical stirring. After the incubation 0.1 ml of allergen was added into the control test-tube, while 0.1 ml of substratum 199 to the test one to eliminate the toxic effect of the allergen on lymphocytes, as well as cross-reactivity. The test-tubes were stirred, centrifugalized (1500 rev. per min – 10 rev. per min).
Supernatant liquid was tested for toxicity. Calculation of lymphotoxin was done with dilution of supernatant liquid with buffer solution 3 times. The calculation was performed on spectrometer with the wave length equal to 450 nm in infra red range.
Amount of toxic factor in the sample was calculated according to the following formula:

where T is toxicity of the tested solution (optic units, o.u.), t1 is a tested sample incubated with the allergen, t2 - is non-incubated control sample, and t0sp is a standard control.
The blood was tested for the following most common allergens: chicken egg protein, cow’s milk protein, citrus plants, beef and chicken, gluten, and fish.
In the progress of the work we used enzyme immunoassay kit for the quantitative definition of human TGF - β produced by Bender Medsystem (Austria). For the analysis patients’ blood samples were chosen. In order to avoid a loss of biological activity of TGF-β the samples were kept frozen in -20°C, being aliquoted prior to that. The performance of the analysis included several stages. Antibodies to TGF-β1were adsorbed in the sockets of micro tab. TGF-β1, present in the samples, standards, and the controls put into the sockets of the micro tabs, conjugated with antibodies adsorbed in the sockets. Antibodies to TGF-β1, conjugated with biotin bond the molecules of TGF-β1, captured by the first antibodies. After the incubation, while washing the sockets lost non-conjugated biotin-modified antibodies to TGF-β1. We applied streptavidine-horse-radish-peroxydase (streptavidine-HRP) into sockets and it attracted biotin conjugated with the second antibodies to TGF-β1. After the incubation and washing the sockets lost non-conjugated enzyme streptavidine-HRP and we added substrate solution, which interacted to enzyme complex forming stained solution. Reaction was stopped by addition of acid. Intensity of the staining, measured with the wave length equal to 450 nm, was directly proportional to the concentration of TGF-β1, present in the samples. The concentration of human TGF-β1 in the samples was determined according to the standard curve designed in compliance with 7 dilutions of human TGF-β1 standard.
We also applied enzyme immunoassay set produced by Bender MedSystems (Austria) for the quantitative definition of TNF-α in blood serum. Aliquoted TNF-α samples were stored in -20 °С to avoid its loss of bioactivity. Performance of the analysis followed the following principle: antibodies specific to TNF-α, were adsorbed in the sockets of the tab. TNF-α of unknown samples, standards, and controls conjugated with antibodies in the sockets. The added biotin-monoclonal-anti-TNF-α-antibodies conjugated TNF-α, captured by the first antibodies. After the incubation and washing non-conjugated biotin was removed from the sockets. Later we added streptavidine-peroxydase into the sockets to bind biotin conjugated with TNF-α. After the second incubation and washing non-conjugated streptavidine was removed from the sockets and substrate solution, interacting to enzyme complex with formation of stained solution, was added to the sockets. Intensity of staining, measured with the wave length 450 nm, was directly proportional to the concentration of TNF-α in the samples. Concentration of TNF-α in the samples was determined according to the standard curve designed in compliance with 7 dilutions of the standard.
In the study of the history we determined that, 13 (34.2%) children out of 38 had only breastfeeding, while the rest had mixed nutrition (n = 25 (65.7 %)).
The time of first manifestations of the disease was 3.1 ± 1.1 months. Associate atopy was noticed in 36 patients (94,7%), and it was displayed in atopic dermatitis. Two children had attacks of obstructive bronchitis before the appearance of initial manifestations of the underlying disease.
The leading cause of the development of the allergy in these children were cow’s milk proteins (100%). Monovalent allergy was observed in 18 (47.4%).
In the cases of polyvalent allergy (results of lymphoquin-producing ability of T-lymphocytes test) the causes of food allergy were beef, eggs, cow milk, chicken, and less often gluten, soybeans, and citrus plants (Table 1).
As mentioned above, lymphotoxin is a product secreted by sensitized lymphocytes during their cultivation with allergens. This factor is produced exclusively by T-cells, since in the pretreatment of a suspension of leukocytes containing other cells with antiserum to human T-lymphocytes and complement; it completely prevents its production [24].
The incubation of lymphocytes of healthy children with food allergens did not lead to a significant change in the production of spontaneous lymphotoxin, the result ranged from 3.8 + 1.1 to 15.5 + 1.0 OU, which was much lower compared with sick children.
The most often clinical symptom of the disease in children was vomiting, which was observed in 28 patients (73.6%) with FPIES. Diarrhea was registered in 16 children (42.1%). Acute progress of FPIES was noted in 5 patients, clinical symptoms in whom were characterized by lethargy, decrease in body temperature, and pallor. Blood in stool was observed in 3 children, while mucous was seen in 26 children with FPIES (Table 2).
We did not observed thrombocytosis in blood characteristic for FPIES described by other authors; the average number of platelets were 218±7.8 * 109/l [1]. The patients had characteristic mild anemia and absence of leukocytosis and eosinophilia.
The level of TGF-β1 in patients with FPIES exceeded the normal values and was 33.5 + 1.6 ng/ml, respectively; while the normal value was 20.2 + 2.1 ng/ml, p <0.001(Figure 1). The indices of TNF-α were also increased and reached 8.8 + 1.3 ng/ml in comparison with the normal 4.2 + 0.67 ng/ml, p <0.001 (Figure 2). In 18 (47.3%) cases our patients had increase of specific immunoglobulin E to cow’s milk protein; the average values were equal to 1.42 ± 0.6 IU/ml.
Comparison of clinical manifestations of the disease depending on the association with increased titers of specific immunoglobulin E to cow’s milk protein revealed higher prevalence of the symptoms such as vomiting, lethargy, blood in feces in the patients with IgE-associated FPIES, р <0.05 (Table 3).
At the same time, transparent mucous in stool and diarrhea was observed more often in the patients without association with specific immunoglobulin E to cow’s milk proteins.
Blood visible in stool was observed only in 5 (6.9%) patients with FPIES, independently of the values of IgE. Occult bleeding was revealed in 9 (12.5%) children with FPIES regardless of IgE level.
Children with associated increase of specific immunoglobulin E amount more often had diminishing of BMI to more than 3 standard deviations.
Also among the patients in this group TGF-β1 level was significantly higher than in the control group, reaching 42.01 ± 7.5 ng/ml (in control 20.0 ± 2,1). TNF-α indicators were also increased: 11 ± 1.2 ng/ml (in control 4,2 ± 0,67 ng/ml).
During the last decades we could observe increase in the prevalence of food allergy. There are quite many reports according to which new food preferences together with epigenetic factors can be responsible for the tendency [26]. Allergy to cow’s milk protein is one of the leading causes of food allergies, involving about 2.5% children in the age under 3, and 3-6% children under 4 years old [27].
It was found reduction in the expression of TGF-β receptor 1 on the intestinal epithelium in the mucosa of children with FPIES compared to the children in control groups, and it correlates with the intensity of villous atrophy [10].
Although it is interesting to assume that this may reflect a reduced regulatory tone in the intestines of patients with FPIES, this may be secondary to the altered state or differentiation of the state of epithelial cells of truncated villi, rather than as a primary event in pathogenesis. Increased expression of TNFα mucosa by immunohistochemistry has been described by the authors.
In our research we determined 1.5 fold increase of TGF β1 in blood serum of the children with FPIES; and in the patients with FPIES accompanied by increased values of specific immunoglobulin E to cow’s milk proteins the observed rise of TGF-β1 was more than 2 folds.
It is known that TGF-β1 is “anti-inflammatory” growth factor preventing production of IL-1 and TNF-α, cell adhesion, and chemotaxis [28].
Though, there are data explaining the increased expression of TGF-β1 in case of ulcerous colitis due to presence of cytokines Th-2 type, which can promote TGF-β1-producing cells [28,29]. It is supposed, that inability of TGF-β, in spite of its high level, to oppose inflammation in ulcerous colitis, can contribute to the maintenance of inflammation [29].
Ambivalent effect of TGF-β is conditioned by its impact on both passive and activated cells of an organism. Passive immature TGF-β cells are stimulated, while the same population of cells, but the activated one is suppressed [8]. Some authors state that, locally TGF-β intensifies inflammation, while systemically it inhibits the inflammation [30]. Probably that effect is conditioned by the impact on endothelial cells, on which it blocks adhesion of leukocytes and their penetration to the focus of inflammation by means of inhibition of E-selectine expression. Thus, the effect of TGF-β can be both pro-inflammatory and anti-inflammatory [31-33].
Though in the initial stage of inflammation TGF-β, secreted by platelets, can play the part of chemo attractant for monocytes, promote their differentiation to macrophages, and even stimulate production of pro-inflammatory chemokines and TGF-β itself by macrophages. Only in case of progression of inflammation and accumulation of TGF-β its effects get anti-inflammatory character [14].
Sequential analysis of fecal samples from an infant with milk-FPIES demonstrated an elevated TNFα level in the stool during chronic milk exposure, but interestingly not in response to acute challenge [35].
Chung, et al., also found that in addition to increased TNF-a, infants with FPIES also had decreased expression of transforming growth factor b1 (TGFb1) receptor [10]. TGF-b is known to protect the epithelial barrier by stimulating the synthesis of extracellular matrix, proteins, collagen, and fibronectin. Increased expression of TGF-b1 is seen in older children after weaning. This may partially explain why FPIES is only seen in young children; however, the precise pathogenesis of FPIES is still not known.
Duodenal biopsies may reveal crypt abscesses as well as villous atrophy by means of increased tissue staining for TNF-a, and jejunal biopsies reveal flattened villi, edema, and increased numbers of lymphocytes, eosinophiles, and mast cell infiltration [35]. Stool studies typically have occult blood and leukocytes, with a predominance of neutrophiles and eosinophiles [37].
The results of our studies demonstrated increase of TNF α in association of the pathology with increased values of IgE 2.6 folds: 11 ± ng\ml, with normal 4.2 ± ng\ml (р <0.05).
For patients with food-protein-induced enterocolitis, TNF-α appears to have an important role. TNF- α can be cultured in vitro from peripheral blood monocytes in infants with food-protein-induced enterocolitis syndrome [12]. Chung and colleagues also found increased staining for TNF-α in duodenal biopsies of infants with food-protein-induced enterocolitis syndrome [10].
Besides the direct modulating immune effects, TNF-α causes an increase in intestinal epithelial TJ permeability [18, 22, 32, 34]. Studies have shown that TNF- α causes a significant increase in intestinal permeability with clinically relevant concentrations (1-10 ng/ml) [38-41]. As TNF-α levels are significantly increased in CD patients, it is likely that the abnormal increase in intestinal TJ permeability in these patients is partially related to the TNF- α effect on the intestinal TJ barrier [40]. Suenaert and co-workers found that the CD patients treated with anti-TNF-antibodies had a significant decrease in intestinal permeability after the therapy. TNF-α is a key mediator of intestinal inflammation in CD and other inflammatory conditions of the gastrointestinal tract. It had been previously proposed that an important pro-inflammatory action of TNF and other pro-inflammatory cytokines was to induce a disruption of the intestinal TJ barrier, allowing increased paracellular permeation of harmful antigens and toxic substances leading to the intestinal inflammation [41,42].
We assume that a high percentage of atopic manifestations in our patients, as noted above (94.7%), were one of the reasons for increasing the specific immunoglobulin E values for cow’s milk proteins, which facilitated the layering of FPIES into the previously existing immunoglobulin E associated atopy.
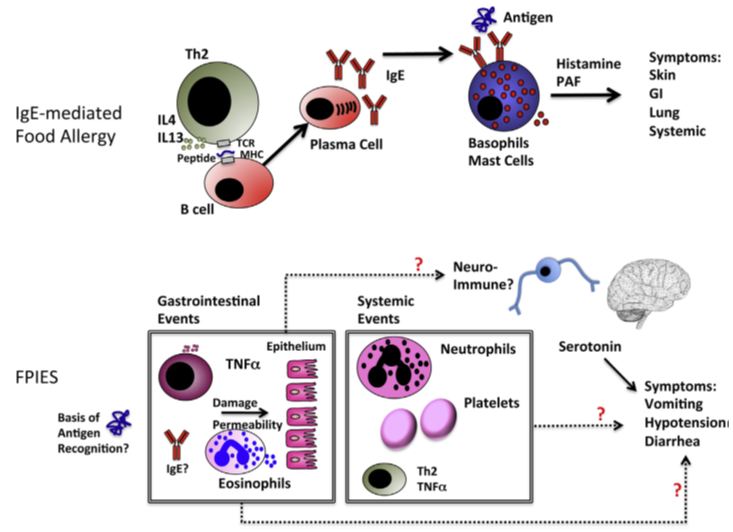
Immune mechanisms of FPIES in comparison with IgE-mediated food allergy were presented by Sesilia Berin [43,44] Figure 3.
The general sequence of immune events from first exposure to re-exposure leading to symptoms in patients with IgE-mediated food allergy is understood. In contrast, although there have been many observations about gastrointestinal and systemic immune events associated with FPIES as depicted, there is no clear understanding of how these immune events relate to symptoms of vomiting, hypotension, and diarrhea. Red question marks indicate uncertainty. To date, only serotonin has been clearly implicated in symptoms of FPIES, although it is not clear whether serotonin is involved as a peripheral trigger of reactions or is restricted to central control of the vomiting reflex. That is, the pathogenesis of both immunoglobulin E and non-immunoglobulin E associated mechanisms of allergic diseases has not been studied well until now.
The role of the increase in TGF-β1 in FPIES, more pronounced in atypical forms, can also be explained by a violation of the intestinal microbiom that occurs in these diseases, which was established in experiments on rats with IBD [45,46]. In addition, there is evidence that TGF-β1 affects inflammation in the intestine through the induction of cyclooxygenase-2 and the subsequent increase in prostaglandin production [47]. The general consensus is that in IBD, plasma TGF-β1 levels increase in parallel with an increase in cytokine secretion due to inflammation [48]. We believe that such result is possible in gastrointestinal forms of food allergy, the clinical manifestations of which are accompanied by pronounced dyspeptic manifestations. Also there are interesting data according to which аn elevated level of TGF-β1 has been reported in the bronchoalveolar lavage (BAL) fluid of asthmatics. These findings have also been confirmed by measurements of TGF-β1 in BAL fluids after segmental allergen challenge in asthmatic subjects. In addition, the secretion of TGF-β1 after an allergic disorder takes part in fibrosis and the irreversible changes associated with airway remodeling in chronic asthma [49]. According to data Wiparat Manuyakorn, there was a significant difference between serum TGF-β1 in asthmatic patients and that in control patients (39.59 ng/ml vs. 0.26 ng/ml, p < 0.001) [50].
According to the received data, expression of TNF-α was reliably explicit in patients with FPIES; though in association of the disease with high values of immunoglobulin E the difference in the values compared to the control group was more overt.
We supposed that TGF-β1 inhibits allergic inflammation. But in our observations increase in its values was established, especially in the group of children with high specific IgE levels to cow’s milk protein. It is likely that an increase in TGF-β1 stimulates the release of TNF-α, which supports chronic inflammation in allergic diseases. But additional studies with a large number of patients are needed to determine the more clinical significance.
The research was performed in the frames of applied grant of the Ministry of Health of the Republic of Uzbekistan “Gastrointestinal forms of food allergy in children: pathogenetic significance of regulatory subpopulations of T-cells; perfection of diagnostics and therapy”.
The authors state the absence of conflicts of interests.