Comparison of Low-Level Laser Therapy and Drug Therapy in Patients with Temporomandibular Disorders: A Randomized Clinical Trial
Background: Non-surgical treatment is the first step in the treatment of temporomandibular disorders. Low-Level Laser Therapy (LLLT) was compared with drug therapy in these patients.
Methods: This randomized clinical trial was done on 72 patients at the school of dentistry, Rafsanjan, Iran in 2015. The patients were randomly divided into two groups of drug therapy (Naproxen 500mg capsules twice a day for 10days and Diazepam 2 mg twice a day for 10days) and LLLT (Azor-2k, Moscow, Russia) and were studied by laser parameters at wavelength of 808 nm, output power of 50 mW, energy per point of 4 Joules, power density of 1.78 W/cm2, laser beam of 0.028 cm2, and energy density of (144 J/cm2) twice a week for four weeks. Data were evaluated by Visual Analog Scale (VAS) and Active Range of Motion (AROM). SPSS (Version 18.0. Chicago: SPSS Inc.) was used to analyze the data. Comparison of average changes in VAS and AROM after treatment in both groups was carried out by independent two-sample t-test. Finally, chi-square test was used to compare tenderness and clicking frequency after the treatment. P-value < 0.05 was considered to be statistically significant.
Results: Both methods showed a decreasing trend in pain, clicking and tenderness. Decline in VAS immediately after treatment was significantly lower in drug therapy (P<0.01). Regarding AROM index, a significant increase was observed in laser therapy (P<0.01).
Conclusion: Our study showed that both laser and drug therapy methods were effective in the treatment of temporomandibular disorders. However, LLLT showed a significant decrease in the recovery process, so it is more sensible to consider it an appropriate therapy.
Keywords: Low-Level Laser Therapy, Temporomandibular Disorders, Drug Therapy
Temporomandibular disorders (TMDs) are defined as a group of symptoms affecting masticatory muscles, temporomandibular joint (TMJ) or both [1]. Mainly, disorders of TMJ do not have an inflammatory origin. Some changes like deterioration and abrasion of articular cartilage are associated with the superposition of secondary inflammatory changes. So, understanding the pathophysiology of the TMJ disorders is important to find out the etiology, diagnosis and treatment of the internal dysfunction and osteoarthrosis of the TMJ [2]. Degenerative joint disease of TMJ (osteoarthritis) is one of the most common articular disorders that affects the temporomandibular joint and is often associated with pain [3]. TMD has many etiological factors among which one can mention trauma, immunology and metabolic and neoplastic disorders [4,5]. Its symptoms are muscular pain, pain in temporomandibular joint, sensitivity in touching the face, clicking and restrictive and asymmetrical jaw movement [6]. Non-surgical or medical treatment is a major part of initial management of patients with temporomandibular dysfunction [7]. An occlusal appliance (splint) and massage of sore muscles can be used as some basic therapies for myogenous TMD [8]. The other common therapeutic methods for reducing pain and temporomandibular dysfunction are drug therapy, laser therapy and physicaltherapy, and clinicians prefer non-aggressive therapeutic intervention for these cases [9,10].
Low level lasers do not liberate heat or destruct the fibers, and they are named so because their density is lower than 0.5w/cm2 [11]. Some advantages of LLLT are stimulating biological system and improving cellular metabolism in the injured cells, having anti-irritant effect, improving blood circulation, increasing pain tolerance based on changes in the potential of embryonic layer, adjusting the immune system, increasing intracellular metabolism, speeding up scar recovery and indolence [12].
Beside its remedial effects in various disorders such as diabetic scars, vascular scars and bedsore, LLLT is advantageous in the treatment of muscular pain [11,12]. Also, it can be a supportive therapy to decrease the symptoms of TMD and increase mandible movements [13]. In one research focusing on the effect of LLLT with infrared laser on TMD, it was shown that LLLT decreased VAS and tenderness and was effective in the treatment of TMD [14]. Another study surveyed the impact of LLLT on TMDs and concluded that LLLT was a suitable treatment for TMD, which should replace other therapeutic methods [14]. Another study on low-level laser treatment was effective in controlling the pain associated with TMD [15]. The results of a study performed on 46 patients with bilateral subjective tinnitus with TMDs showed significant differences in low level laser groups, but no difference in the control group [16].
The present study made a comparison between these therapies in patients with TMD. The study hypothesis was that the effects of these two methods would be the same. The secondary objectives of the study were to determine the mean of VAS, the mean of AROM, the frequency of tenderness, the frequency of clicking before the treatment, immediately after the treatment and one week, two weeks and four weeks after the treatment.
This randomized clinical trial (IRCT number 201412235565N3) was carried out on 72 individuals selected by accidental sampling and suffering from dysfunction of TMJ at school of dentistry, Rafsanjan, Iran in 2015. The Ethic code number is IR.RUMS.REC.1394.278. The inclusion criteria consisted of patients in the age range of 20-45 years who had dental class I occlusion and at least two of the following symptoms: dysfunction of masticatory muscles, restrictive jaw movements, bruxism or clenching, clicking sound and sensitivity to palpation at TMJ [17]. Written consent was obtained from the patients. Permission was taken from the ethics committee to conduct the present study.
The exclusion criteria included any kind of systemic illness, supportive therapies like drug and physical therapy, tooth loss, fixed or displaced prosthesis, previous trauma, malocclusion, orthodontic device, history of recent dental treatment or previous surgery in the maxillofacial area and age limits other than 20-45.
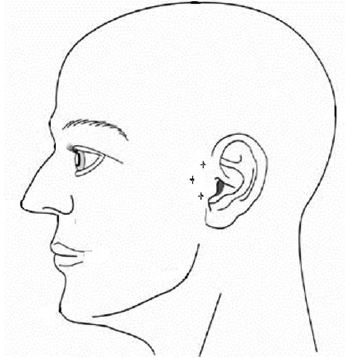
Patients were randomly grouped into drug therapy and laser therapy based on the random number table. Randomization was performed using randomly permuted blocks of 2 to assign patients to laser or drug groups. A limitation of this study was lack of a control group. As for the drug therapy group (24 woman and 12 men), Naproxen 500 mg capsules (Abidi, Tehran, Iran) and Diazepam 2 mg (Abidi, Tehran, Iran) were administered twice a day for 10 days [18]. For laser therapy group (22 women and 14 men), LLLT was performed (Azor-2k, Moscow, Russia) using laser parameters at wavelength of 808 nm, output power of 50 mW, energy per point of 4 Joules, power density of 1.78 W/cm2, laser beam of 0.028 cm2 and energy density of 144 J/cm2 twice a week for four weeks, and the laser was in touch with the epithelial surface on the TMJ location during the laser exposure (for 10 seconds per point) (Figure 1). Exposure was performed at three points in each session, so the energy per session was three times greater than the energy at each point. Pain measurement was carried out using VAS. The patients were asked to rate the pain from 0 to 10. Zero indicated "no pain" and 10 showed "the greatest possible pain". As for evaluation of clicking and crepitus noise, patient's TMJ was palpated during mandible movement and stethoscope use. To evaluate the active range of motion (AROM), a cloth ruler scaled on the basis of millimeter was used, and intrinsic distance was measured in each session of the treatment [4,11,19].
The patients were examined five times: before the treatment, immediately after the treatment and one week, two weeks and four weeks after the treatment. The results of examinations were fed into the enclosed questionnaires. It should be mentioned that the examiner had no idea which group was being examined, who assessed VAS, AROM, clicking and tenderness of the patients and who analyzed the data. He was also blind to the patients. The RDC/TMD was used by examiners [20]. Finally, the results of the two methods were compared and evaluated.
SPSS (Version 18.0. Chicago: SPSS Inc.) was used to analyze the data. Results were reported as "mean ±standard deviation" for quantitative variables and as "number (percentage)" for qualitative variables. To evaluate the changes that occurred in VAS or AROM at different times (before the treatment, immediately after the treatment, one week after the treatment, two weeks after the treatment and four weeks after the treatment) in both groups (laser therapy and drug therapy), one-way repeated measures ANOVA was used. As for evaluation of frequency changes, McNamara’s test was used. Two-way repeated measures ANOVA was used for the purpose of comparing VAS and AROM. Comparison of average changes in VAS and AROM after treatment in both groups was carried out by independent two-sample t-test. Finally, chi-square test was used for comparison of tenderness and clicking frequency after the treatment. P-value < 0.05 was considered to be statistically significant.
As indicated in Table 1, the comparison of analyzed variables before the intervention showed the same results in both groups. There were 22 women and 14 men in the laser therapy group and 24 women and 12 men in the drug therapy group.
Comparison of clinical variables after the intervention is shown in Table 2.
To evaluate the changes, one-way repeated measures ANOVA was used. Also, McNamara’s test, two-way repeated measures ANOVA and independent two-sample t-test were used. Finally, chi-square test was used. P-value < 0.05 was considered to be statistically significant.
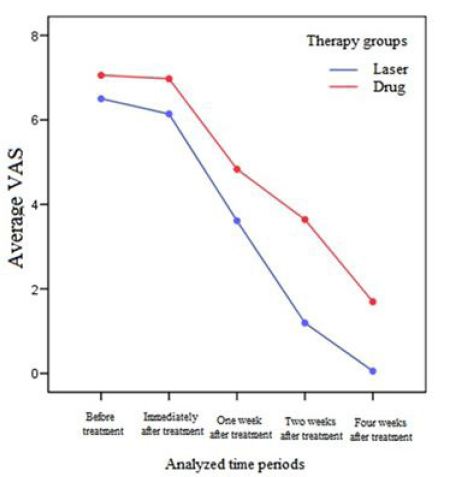
Figure 2 shows the comparison of average VAS changes in each therapy group.
In order to evaluate the changes in VAS during the study period, one-way repeated measures were used in each of the laser and drug groups. According to Mauchly's test of sphericity, the equalization of variances was significant (P <0.01). According to the Green house-Geisser test, the trend of VAS decrease during the study period in each of the studied groups (laser and drug) was statistically significant (P <0.01).
Also, two-way repeated measures showed thatpain reduction was significantly higher in the laser group than the drug group during the study period (P <0.01).
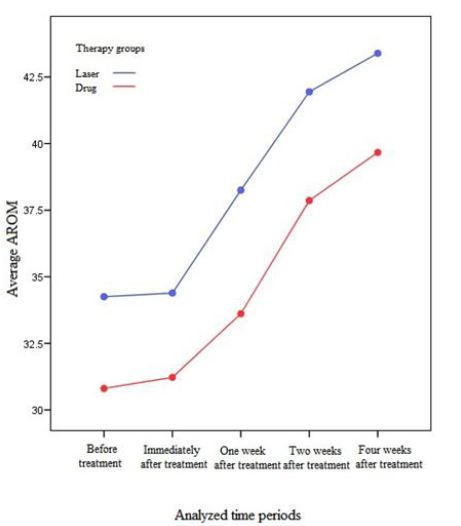
In order to evaluate the trend of AROM changes during the course of study, one-way repeated measures were used in each of the laser and drug groups. According to Mauchly's test of sphericity, equalization of variances was significant (P <0.01). Therefore, according to Green house-Geisser test, the trend of increase of AROM during the study period was significant in each of the studied groups (laser and drug) (P <0.01).
Figure 3 shows the comparison of average AROM changes in each therapy group.
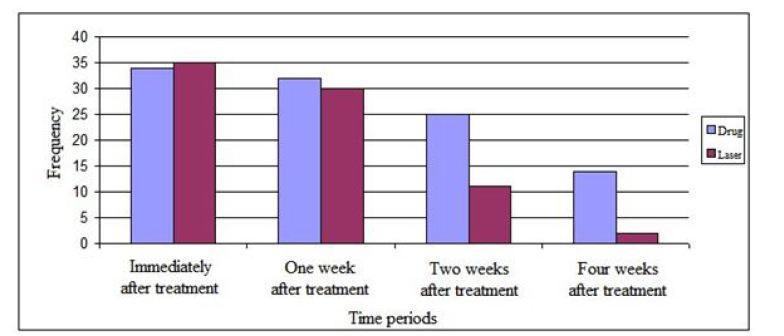
To assess the changes in clicking frequency, McNamara’s test was applied in each of the therapy groups. The results showed a significant decrease in clicking frequency four weeks after the treatment.
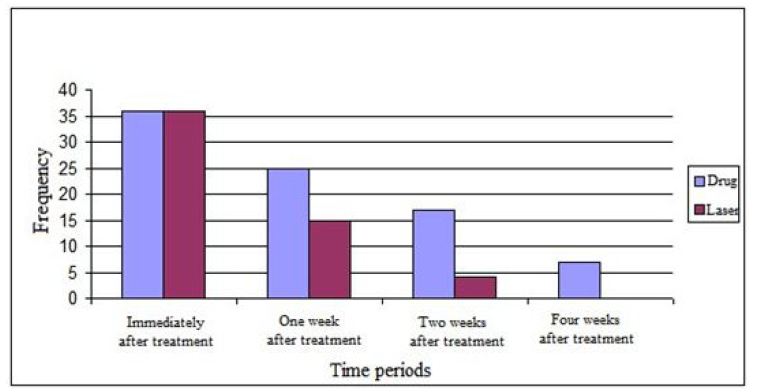
The results of evaluating clicking and tenderness frequency in each group are illustrated in Figure 4,Figure 5
According to the results, the equality of test of variances was significant in VAS, and decreased VAS during the course of study in both groups was significant. Moreover, the interaction of therapy groups and time period was statistically significant.
Also, equality of test of variances was significant, and the increasing trend in the study in both groups was significant. The interaction of group therapy and time period was not statistically significant.
It should be noted that there was no side effect until the end of the study.
Different therapy methods are used for the treatment of TMD such as physical therapy, drug therapy, laser therapy and surgery, and finding the best therapy is quite important because 20 to 30% of adults suffer from this disorder [21].
In a study that compared occlusal splint and physiotherapy, the results showed that physiotherapy might be preferred as initial therapy over occlusal splints in the treatment of myogenous TMD [8]. Therefore, it is advisable to experience several physiotherapy sessions such as medication and low-level laser before other treatments, and if no improvement occurs, other therapeutic interventions would be performed.
A study on the measurement of jaw movements and TMJ pain in patients treated by the gallium-aluminum-arsenide laser (GaAlAs) concluded that laser can be a supportive therapy in the treatment of TMD, causing a decrease in symptoms and an increase in mandible movements [13]. Similarly, the results of the present study showed that LLLT had the same effects.
Another study on the effect of GaAIAs LLLT on TMD showed that LLLT could decrease VAS and increase AROM and thus be used as an effective treatment for TMD [11]. The results of our study confirmed their findings. In the present study, the results showed a decreasing trend in AROM for both groups, but there was a significant increase in AROM after treatment in laser therapy group compared with drug therapy group.
Evaluation of the tenderness frequency in our study indicated a decrease in the tenderness frequency four weeks after treatment compared with its amount before the treatment, although this reduction was not statistically significant. However, in the first week,second week and fourth week, the tenderness frequency was significantly lower in the laser therapy group than in drug therapy group.
Cetiner, et al>. also dealt with the impact of GaAIAs LLLT on TMD. They used this treatment on 39 patients and concluded that LLLT was a suitable treatment for TMD, which should replace other therapeutic methods [14]. Some other studies have shown no significant difference between LLLT and placebo and have suggested no preference for using this therapeutical method [22,23].
The results of the present study showed statistically significant advantages of laser therapy over drug therapy so that before the treatment both were similar as to age, sex, clicking, VAS and tenderness.
Immediately after the treatment, VAS index showed a significant decrease in laser therapy compared to drug therapy, and AROM index showed an increasing trend in laser therapy compared to drug therapy. Active range of motion (AROM) is measurement of movement of the joint without any assistance to the muscles surrounding it, so increase in this parameter indicates improvement of the joint condition. Visual analog scale (VAS) is a measure of pain intensity, so a reduction in this parameter indicates a decrease in the patient's pain and improvement of the joint condition.
One week after the treatment, VAS and clicking indices showed a significant decrease in laser therapy compared to drug therapy, and AROM index showed a significant increase in the laser therapy.
Two and four weeks after the treatment, tenderness, VAS and clicking indices showed a significant decrease in laser therapy compared to drug therapy, and AROM index showed a significant increase in laser therapy.
The results of this study indicated that diazepam and naproxen, if taken together, could be effective in the treatment of TMD.
In a study by Sedat Çetiner, et al>. the use of LLLT improved the maximum opening of mouth and chewing problem, and temporomandibular pain decreased in patients. Further, the LLLT results showed it was a suitable treatment for TMD. The results of this study were in agreement with those of the present study [14].
Another study compared the efficacy of LLLT with non- steroid anti-inflammatory drugs in treating the pain caused by TMD. The mean pain scale in the laser treatment group was significantly lower than those of the drug group and control group. The results of this study were consistent with the findings of the present study [24].
Another study was conducted on patients with pain caused by TMD in which LLLT was used to relieve pain in patients. LLLT was significantly effective in reducing the pain of patients compared with the control group, but there was no significant difference between patients with myofascial pain. The results showed that LLLT could be considered a useful technique to treat the pain associated with TMD, especially chronic pain. The results of this study were consistent with the findings of the present study [17].
In another study performed on 46 patients with bilateral subjective tinnitus with TMDs, LLLT with an neodymium-doped yttrium aluminum garnet (Nd:YAG) (1064 nm) laser and LLLT with a diode laser (810 nm) were applied to the patients. Results showed significant differences in the Nd:YAG laser and 810 nm diode laser groups, which were in line with the findings of the present study [16].
LLLT has more advantages and fewer side effects and at the same time is more cost-effective, but in many cases drug therapy is more appropriate and cost- effective [25].
A limitation of this study was that the reports on the amount of pain were subjective and not reliable. Another limitation of this study was that it had no control group. Another limitation was that we could not expect pain relief after laser therapy at just one point on TMJ in patients that had constriction of lateral pterygoid muscle and restriction of mouth opening but no problem in TMJ. These patients could be included in the study according to the inclusion criteria, but they would not benefit from laser therapy on TMJ.
Our study showed that both laser and drug therapy methods were effective in the treatment of TMD. However, LLLT showed a significant decrease in the recovery process, so it should be considered an alternative to other methods.
The author acknowledges the management and funds of Rafsanjan University of Medical Sciences.