
Comparison of Three Spectrophotometric Reagents for Determination of Formaldehyde (FA) in Fish
Three colorimetric reagents, Nash reagent (ammonia + acetyl acetone), AHMT reagent (4-amino-3-hydrazino-5-mercapto-1,2,4-triazole) and MBTH reagent (N-methylbenzothiazolinone-2-hydrazone) were compared for spectrophotometric determination of formaldehyde (FA) in fresh fish samples. The fish extracts were obtained through trichloroacetic acid (TCA) extraction of the fish samples. Post Hoc test analysis for multiple comparisons using Tukey HSD at p = 0.05 indicated that the amount of FA between the fish species differed from each other. All the three reagents have comparable accuracy and precision in determining FA in fish samples. Among the three reagents used, any of them could be used for FA determination in fish according to ANOVA, however, the MBTH reagent was the most sensitive and accurate followed by the AHMT and the Nash reagent.
Keywords:Fish; Formaldehyde; MBTH reagent; Sensitivity
Formaldehyde (FA) which is present in the environment as a result of the natural and artificial processes is important in many aspects of human life, is also a possible killer of human [1]. It is present naturally in the troposphere through photochemical oxidation of hydrocarbons (e.g. methane, isoprene), biological fluids or tissues. It is a mediator of one-carbon compounds, such as methane and methanol, in methylotrophs where methanol is oxidised by methanol dehydrogenase to give formaldehyde as intermediate in its metabolic pathway [2,3]. Formaldehyde is one of the unstable compounds found in the soil at the initial stage of the decay of plant residue and in water by sunlight irradiation of humic substances [4,5,6]. Anthropogenic sources include automotive exhaust from engines without a catalytic converter, products containing formaldehyde including glues, resins, carpets, paints, heating, cigarette smoke, insulating materials, plywood, fabrics, chipboard, nails polish, skin-care products, cooking and direct emissions from the production and use of FA [3]. In seafood and crustaceans, formaldehyde is known to form post-mortem from the enzymatic reduction of trimethylamine-N-oxide (TMAO) [3,7,8]. Formaldehyde also accumulates during frozen storage, reacts with protein and subsequently causes protein denaturisation and muscle toughness [7].
Formaldehyde is toxic to human health and continuous exposure to it from adulterated fish can lead to uncontrolled cell growth (cancer) in any part of the body like lung, stomach and the respiratory system [9]. It can also cause irritation of the respiratory system, as well as chromosomal abnormalities when ingested [10]. Globally, formaldehyde has been classified as a Group 1 carcinogen [11]. Marine organisms, such as fish accumulate formaldehyde through the reduction of dimethylamine oxide [12]. The maximum value of naturally occurring formaldehyde is about 60 mg kg-1 in marine fish and fruits [13]. Currently, there have been growing concerns by consumers of wet fish and fish products that fish are being adulterated with formaldehyde in order to prolong their shelf life. Some researchers have reported that, the content of formaldehyde in shellfish and finfish samples from some markets ranged between 0.33 and 16.00 mg kg-1 [14,15,16].
There have also been speculations in the media that some Ghanaian fishmongers are using formaldehyde (formalin) to preserve salted fish [17]. The presence of formaldehyde in fish consumed beyond certain threshold value may pose several health threats to consumers [18]. Therefore, a precise data on the levels of formaldehyde in fish is very useful in assessing the risks of formaldehyde exposure. A number of reagents for the determination of formaldehyde in fish including chromatographic and colorimetric reagents are available for the quantitative determination of formaldehyde in fish. These reagents vary in their specificity towards formaldehyde as against other small aldehydes such as acetaldehyde, their sensitivity and their ease of use in addition to cost. Therefore, an accurate, simple, and sensitive reagent for formaldehyde determination in fish is very vital. Therefore, this study sought to assess the reagents involved in the determination of formaldehyde in fish with the aim of selecting the most reliable and accurate reagent. These reagents include the Acetylacetone (Nash), 4-Amino-3-Hydrazino-5-Mercapto-1,2,4-Triazole (AHMT) and 3-methyl-2-benzothiazoline hydrazone (MBTH) reagents.
The study was conducted on fresh fish from various cold stores and fishponds in Kumasi Metropolis of Ghana. The fish species were sampled from four retail cold stores (coded: A, B, C, D), three wholesale cold stores (coded: E, F, G), Kumasi central market (coded: H) and one fishpond (coded: I) in Kumasi Metropolis of Ghana depending on the species availability at the time of sampling. A total of sixty (60) fish samples comprising twenty-one (21) different species were obtained from the various cold stores and were transported while still frozen to the Kwame Nkrumah University of Science and Technology (KNUST) Fisheries Department for scientific identification and later brought to the KNUST Chemistry Department Laboratory for analysis. Each fish sample was thawed and cut into small pieces and put in zipped clean plastic bags and kept in a deep freezer pending extraction and analysis.
A weight of 30 g of each sample was homogenised with 60 mL of 6% (w/w) trichloroacetic acid. Subsequently, the mixture was homogenised for 5 minutes using homogenizer (IKA T18 basic, ULTRA-TURRAX) and allow standing at ambient temperature for 30 min. A Whatman No. 1 filter paper was then used to filter the mixture.
Reagent I [Acetylacetone (Nash Reagent)]: A 5 ml of fish extract measured into a 50 mL volumetric flask was adjusted with 30% KOH to a pH between 6.0 and 7.0 and kept in the deep freezer for 30 minutes. For the analysis, 2 mL of an earlier prepared Nash’s reagent (150 g ammonium acetate, 3 mL of acetic acid, 2 mL of acetylacetone, and distilled water to 1L) was added. The mixture was then heated in a water bath at 60 oC for 30 min and this was cooled to room temperature. The absorbance was then measured at 415 nm using UVmini-1240 UV-Vis Spectrophotometer (SHIMADZU). Blank solution was prepared by replacing the extract with distilled water and treating it in the same manner as the sample. During the calibration process, a standard formaldehyde solution in the range of 0 to 2.5 mg/L was prepared from a 10 mg/L stock solution. The amount of formaldehyde in the fish sample (μg g-1) was calculated from standard formaldehyde curve.
Reagent II [4-Amino-3-Hydrazino-5-Mercapto-1,2,4-Triazole (AHMT) reagent]: A 2 mL of the fish extract was pipetted into a test tube and 2 mL of 5 mol/dm3 KOH was added. Then 2 mL of 0.5 % (w/v) AHMT was dissolved in 0.5 mol/dm3 HCl and the solution was mildly mixed and allowed to stand at room temperature for 20 min. Subsequently, a 2 mL of 0.75 % KIO4 solution prepared from 0.2 mol/dm3 KOH was added. Then, the mixture was gently swirled and the absorbance of the violet colour measured at 550 nm using UVmini-1240 UV-Vis Spectrophotometer (SHIMADZU). Blank solution was prepared by replacing the extract with distilled water and treating it in the same manner as the sample. The amount of formaldehyde in the fish sample (μg g-1) was calculated from standard formaldehyde curve.
Reagent III [3-Methyl-2-Benzothiazoline Hydrazone (MBTH) reagent]: To 5 mL of the fish extract solution, 5 mL of 0.05 % (w/v) MBTH was added and 5 mL of 100 mL solution of 1.0 g ferric chloride and 1.6 g sulfamic acid was then added and diluted to the mark. The solution was allowed to stand for 15 min at room temperature and the absorbance was measured at 628 nm using UVmini-1240 UV-Vis Spectrophotometer (SHIMADZU). Blank solution was prepared by replacing the fish extract with distilled water and treating it in the same manner as the sample. The amount of formaldehyde in the fish sample (μg g-1) was calculated from standard formaldehyde curve.
For quality control, an analytical spike recovery was done by adding standard formaldehyde solutions prepared from 37% formaldehyde to check for the reliability of the reagents used. That is, a known amount of the analyte was added to some fish samples before extraction and also to some of the extracts and was analysed using UVmini-1240 UV-Vis Spectrophotometer and the percentage recovery were calculated in order to evaluate the accuracy of the three reagents. To assess the precision, all fish extract analyses were performed in duplicate and the absorbance for each taken three times. The mean absorbance was then used to calculate the concentration of the formaldehyde from the calibration curve to ensure the quality of the results. Reagent blank was also prepared by replacing the fish extract with distilled water and treating it in a similar manner as the samples in order to minimise errors and to ensure the quality of the results.
Statistical computer software, ‘Statistical Package for Social Science’ version 16 was used in this study. The results were subjected to one way ANOVA to compare the mean amount of FA in the fish from the three reagents.
The absorbance values indicated that the MBTH reagent was the most sensitive followed by AHMT and NASH reagents, Table 1 Shows the standard concentration of formaldehyde and the corresponding absorbance for MBTH, AHMT and NASH reagents.
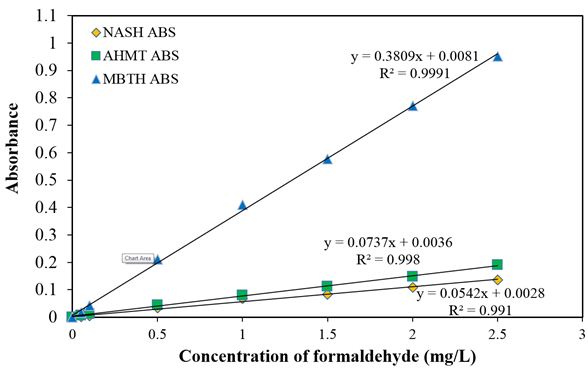
Calibration curves of formaldehyde obtained by the MBTH, AHMT and NASH reagents are shown in Figure 1
The curves were drawn after subtracting the values of the blank test. The calibration curve attained by the MBTH reagent was expressed by as y = 0.3809x + 0.0081 with R2 = 0.9991, y = 0.0737x + 0.0036 with R2 = 0.998 for AHMT reagent and that obtained by the NASH reagent was y = 0.0542x + 0.0028, where y = absorbance, x = concentration of formaldehyde in (mg/L) and 0.3809, 0.0737 and 0.0542 was the slope with corresponding intercept of 0.0081, 0.0036 and 0.0028 for each of the colorimetric reagents (Figure 1). From the calibration curves, the MBTH reagent produced the best slope, hence, the most sensitive among the three reagents used. All the three spectrophotometric procedures gave linear responses with formaldehyde. This established the fact that, the reagents have high linearity even for the small amount of formaldehyde, and the calibration curves passed close to the origin [19].
An analytical spike recovery using standard FA solutions prepared from 37% FA was employed to check for the reliability and accuracy of the three spectrophotometric reagents used for the analysis of the FA in the fish sample. Thus, a known concentration of the analyte (FA) was added to some fish samples, was extracted and analysed using the spectrophotometric reagent and the percentage recovery was calculated in order to assess the accuracy of the three reagents (Table 2).
It was found that the MBTH reagent achieves the highest percentage mean recovery followed by AHMT and the NASH reagent achieving the lowest. The recovery was ranged from 89 to 105% for MBTH reagent, 42 to 71% for NASH reagent and 70 to 81% for the AHMT reagent (Table 2).
The results from the fresh fish samples were subjected to statistical analysis using one way ANOVA to establish whether there was any significant difference between the three spectrophotometric reagents. There was statistically no significant differences between the mean concentration of FA for the three reagents with various F values and corresponding p values ranging from p = 0.000 to 0.023 for the MBTH reagent, p = 0.000 to 0.029 for the AHMT reagent and p = 0.000 to 0.032 for the NASH reagent, as shown in (Table 3).
The level of the FA in the fish species was also compared using bar charts for the three reagents, as indicated in Figure 2.
As shown in Figure 2, the bar charts clearly attest to the fact that the MBTH reagent gives the highest level of formaldehyde in the fish sample compared to the AHMT reagent, which was also higher than the NASH reagent. This confirmed what was observed in the calibration curve and the spiked recovery results. The Nash and the AHMT reagents were both specific and selective for formaldehyde against acetaldehyde [20,21]. This was in conformity with prior information that Nash and AHMT reagents were comparatively specific for formaldehyde, however, the AHMT was more sensitive than the Nash reagent. The MBTH reagent was a non-selective colorimetric reagent for acetaldehyde, which was also harmful as that of the FA, while AHMT and Nash reagents were specific and relatively selective for only formaldehyde devoid of interference from other smaller aldehydes, such as acetaldehyde could result in a better recovery for the MBTH reagent [20].
The levels of FA in the fish samples were subjected to ANOVA analysis and there was a significant difference in the FA content among the species. Thus, the amount of FA between the various fish species differed from one another. Further statistical Post Hoc test analysis for multiple comparisons was performed on the results using Tukey HSD at p = 0.05. It was observed that the amount of FA between the fish species differed from each other. This could be attributed to the difference in the type of fish, the background Trimethylamine Oxide (TMAO) in each species, duration and the storage temperature [22]. Earlier studies have revealed that each fish containing different amount of TMAO and their enzymatic reduction to Dimethylamine and FA as the major products could be responsible for the differences in the FA levels in the fish samples analysed [3,7,8].
The Post Hoc test analysis revealed that the observed amount of FA between the fish species differed from each other. All the three reagents have comparable accuracy and precision in determining FA in fish samples. Among the three reagents used, any of them could be used for FA determination in fish according to ANOVA, however, the MBTH reagent was the most sensitive and accurate followed by the AHMT and the Nash reagent been the last based on the results. Hence each of the reagents has a similar ability in determining FA in fish but for very low or trace levels, MBTH reagent must be used.
The authors are very grateful to the National Council for Tertiary Education (NTCE), Ghana for a research Grant under the Teaching and Learning Innovation Fund (TALIFKNUSTR /3/005/2005). The authors are indebted to Mr Vincent Torve of the Instrumentation Laboratory, Chemistry Department, KNUST, for making time and ensuring most glassware needed are provided.
The authors declare that they have no conflict of interests.

.JPG)
.JPG)
.JPG)
.JPG)
.JPG)
.JPG)
.JPG)
.JPG)
.JPG)