Consumption of Propolis by Young Wistar Rats Causes Altered Reproductive Parameters in Adults
Puberty is the result of maturation of the hypothalamic-hypophysis-gonadal axis (HPG), and the height of hormonal profiles of adults that bring about the physical changes essential for effective reproductive development. In this developmental period, the HPG stimulates sexual gonadal steroid production, which leads to the development of secondary sexual characteristics, accelerated growth and fertility.
Keywords:Testicle Evaluated for Morphological Alterations; Sperm Count Suggesting Lower Fertility; Stereology to AccessAlterations of the Tissue; Western Blot for Biochemical Alteration
The beginning of puberty in humans depends on a series of factors, such as genetical, nutritional and socio-economic conditions [1-2]. Recent studies observed a lowering of the age of initial puberty, determined not by genetics but rather by nutritional conditions such as obesity or because of environmental chemical pollution [3-7].
Leeet al. [8] described the arrival of puberty in girls occurring earlier, due to access to sufficient energy and adiposity, as well as environmental factors such as endocrine deregulator chemicals (EDCs), which can affect not only the control of the energetic balance, but also puberty and reproduction. EDCs are hormonally active substances that candisrupt puberty, acting peripherally on the target organs, such as adipose tissue or the supra renal glands and/or centrally, affecting the hypothalamic-hypophysis-gonadal axis (HPG). Depending on the time of exposure, during fetal life, in the neonatal period or later in childhood, EDCs can give different results depending on different mechanisms. Evidence of the association of endocrine deregulators and the altered synchrony of puberty suggest a close relationship between them.
Considering this relation there are descriptions in the literature of pubertal development, of its implications, of precocious menarches and some explanations for these occurrences. This research is principally focused on the feminine gender and the alterations are due to environmental pollutants that affect animal reproduction [8].
On the other hand, chemical endocrine disruptors (DEOs) include compounds that can alter, imitate or antagonize the functioning of the normal endocrine system by interfering with the synthesis, metabolism or the attachment of receptors and the cellular response to endogenous hormones. The principal risk of DEOs is their ability to induce subtle effects, even in exceptionally low doses that are below the accepted levels, promoting detrimental effects in the process of reproduction and development, as well as causing tumorigenic and teratogenic effects. There is evidence that human exposure to DEOs can occur by ingesting trace contaminants in food or high levels of phytochemical products in fruit, grains and vegetables [9], through the use of medicines and environmental contamination with heavy metals and other elements, as well as occupational exposure [10-12].
The search to identify and characterize the DEOs reveals that a relatively large number of them have estrogenic, antiestrogenic or antiandrogenic activity. In contrast, few of them have been associated with androgenic activity, despite the general agreement that environmental factors may affect masculine reproduction [13]. However, these substances can be difficult to investigate because they act silently, but with serious adverse effects.
Goyal et al. [14] described significant levels of lycopene in the plasma and blood of humans receiving a supplemented diet, resulting in increased ability to sequester free radicals. Reactive oxygen species are deleterious to health and the function of spermatozoa. The sperm contain enzymatic and non-enzymatic defense mechanisms to combat the reactive oxygen species, such as lycopene which is a nonenzymatic defense tool. Al-Yahya et al. [15] showed Swiss mice treated with Ginkgo bilobahad significant alterations of the weight of the epididymal cauda and the prostate, in the pregnancy rate and the pregestational loss of implantation sites, and chromosomal aberrations. However, the motility, the sperm count, and their morphology were not affected. Biochemical parameters showed that nucleic acid depletion and the increase of malondialdehyde (MDA) demonstrated the role of reactive oxygen species in the changes induced in chromosomes in the testicle and the reproductive function of these animals.
Chandra et al. [16] demonstrated that green tea prepared from dried leaves of the Camellia sinensis bush, when consumed in relatively high doses can compromise the morphology and function of rodent testicles.
Russo et al. [17] proposed a possible use of propolis in the prevention and treatment of male infertility, due to its action against oxidative damage to the DNA of human spermatozoaby free oxygen species reactive to Tio barbituric acid (TBARS). Other authors demonstrated that propolis protects against infertility, improves the production, mobility, quantity (sperm count) and quality of rat spermatozoa and that it was able to activate steroidogenesis and therefore testosterone production [18]. According to Yousef et al. [19], this natural product could be efficient to protect against reproductive toxicity induced by an endocrine disruptor known as triphenyltin, causing significant improvement of sperm characteristics of the rabbit. El Mazoudy et al. [20] demonstrated that the previous administration of propolis in animal treated with Chlorpyrifos, an organophosphate insecticide (CPF) that has been related to genital deformities, improves the damage to testicles and relieves the toxic effects of CPF in the reproductive function, in male rats. Together with other authors,they demonstrated that the groups treated with propolis showed higher levels of testosterone [21,18], the total production of spermatozoa, motility and the number of mobile [19], the level of 17-ketosteroid reductase and in the testicular protein content [18], which demonstrates that propolis is also able to interfere in the reproductive function
Considering the alterations of male reproductive parameters, the results of our research group demonstrated that Brazilian green propolis altered the reproductive function of rats, affecting sperm production and epididymal structure when administered in the dose of 6 mg/kg/day, for 56 days [22]. Besides, a significant increase in the volume of Leydig cells (LCs) and in daily sperm production (DSP) was verified. When a dose of 10mg of propolis/kg/day was administered, a higher level of connexin 43 (Cx43) was found and a higher cell death induction as well. In both cases, higher concentrations of propolis lead tostructural damages to germ cells, Leydig cells (LCs) and lower daily sperm production (DSP) [23]. These findings show that propolis can alter the reproductive homeostasis of animals despite de various benefits that it can induce.
In contrast to the above exposed findings, natural products are usually used in popular medicine to treat various male sexual disfunctions[24,25], and not as the inducers of defects. The literature has various descriptions of male infertility, a problem that is common and complex, and can affect 1 in 20 men. Despite many studies on this subject, in many cases, the causes aremainly unknown [26].
Based on this information, the possibility that Brazilian green propolis could interfere with testicular development of Wistar rats, leading to compromised testicular structure and altered function in adults that could affect fertility was investigated. Could this natural product act as an EDC? To investigate these questions, recently weaned Wistar rats received propolis up to the age of maturity, which in this study we considered to be 90 days old.
Exposition to the propolis extract was made by gavage to 24 male Wistar rats (Rattus norvergicus), as soon as they were weaned. They were divided into two groups: the control Co (n=12) that received only water and the P group (n=12) exposed to propolis 6mg/kg/day. The experimental period was 69 days, to complete ninety days of age, considered the beginning of the reproductive period.
The propolis used in the experiment was collected in the state of Paraná and prepared in the Laboratory of Reproductive Biology in the Department of Structural and Functional Biology of the State University of Campinas (UNICAMP). It was prepared by homogenizing 30g of propolis in distilled water completed to 100mL, and maintained under refrigeration in the dark, with constant moderate stirring for 7 days. Next, the solution was filtered and used as the propolis extract (modified from Sforcin et al. [27]).An aliquot of the extract was placed in the oven to evaporate, completely; the concentrate was used to obtain the dry weight. The final concentration of the solution was 40mg/ml, used to calculate the quantity administered to the animals.
Daily propolis intake was estimated based on previous data of our research group, as mentioned above. A dose of 6mg/kg/day corresponds to 360mg for an adult weighing 60kg. This dose is considerably lower than those cited in the literature for analysis in humans. Soleimani et al. (2020) administered 500mg/propolis/day for 4 months; Ding et al. (2020) used 1,627g/propolis/day for 1, 3 or 7 days; Conte et al. (2021) used 500mg/propolis/day for 3 months and Matsumoto et al. (2021) used 508.5 mg/propolis/day for 24 weeks. Also, previous clinical trials showed that the administration of propolis at a daily dose of 900 mg for 18 weeks does not cause adverse effects (Zhao et al., 2016).
Phytochemical analysis and chemical constituents of the aqueous extract of propolis were identified by Professor Alexandra Christine Helena Frankland Sawaya (FCF-UNICAMP). An ultra-high performance liquid chromatographer with mass spectrometer (UPLC-MS Acquity, Waters) was used. Chromatographic separation was performed on 7μL of filtered extract (0.22μm), using a C18 column (50mm x2.1mm, particles of 1.7μm), at 30°C and a flow of 200μL/min. Elution was performed using a gradient of Phase A – Milli-Q Purified water with 0.1% formic acid, Phase B– HLPC grade methanol; beginning with 10% B, and ramping to 100% B in 9 min, maintained until 11 minthen returning to initial conditions and equilibrating until 12 min. The MS conditions were electrospray ionization in the negative ion mode with capillary at - 3kV and a cone of- 30V, source temperature of 150°C and dissolving temperature of 350°C. Method adapted from [28].
Euthanasia of the animals was applied to 90-day old rats, treated for 69 days [29]. Allof the animals received a solution of 2%Xylazine (0,5ml/kg) and 10% Ketamine(0.9ml/kg).
For half of them, the paired numbers, the testicles were collected fresh, the right one was frozen a -4°C and later submitted to dissociation and homogenization for the sperm count, and the left one frozen at -80°C for later biochemical analysis (oxidative stress and Western blotting).
The other animals, the odd numbers, were submitted to medial laparotomy, opening back the dorsal arcade to visualize the heart. Cardiac puncture was made in the left ventricle, then an injection needle connected to a perfusion system was introduced into the pulmonary artery. Drainage of the solution was obtained by sectioning the artery of the right atrium.Pre-perfusion consisted in 100mL of 1% heparinized saline solution followed by perfusion with Karnovsky’s fixative (2% glutaraldehyde and 2% paraformaldehyde) for 30 minutes [30]. Small blocks of the testicles were immersed in the fixative as above in 0.1% cacodylate buffer, for 24 hours to be processed for electron microscopy.
The right testicle was dissected to obtain the weight of the tunica albuginea and the testicular parenchyma. Based on the body and testicular weights, the gonadosomatic index (GSI) was obtained by dividing the organ mass, the testicle, (MO) by the corporal mass (MC) x 100 [30].
Testicles were fixed as above and submitted to alcoholic dehydration. They were included in glycol methacrylate, then sectioned with a rotative microtome. The sections were stained with Hematoxylin/Eosin. They were employed in morphological, morphometrical and stereological analyses [30].
Images of the testicular parenchyma were captured with a digital camera attached to a Leica DM200 microscope and the morphometric and stereological analyses were made using the Image Pro Plus software. The first analysis was the volumetric proportions (%) and the volumes of the parenchyma components. These were estimated by counting 3000 points (per animal) projected over images of aleatoric areas, with a magnification of 200x or 1000x, using a grid of 494 points. The elements quantified for the following structures were the seminiferous tubule in which the lamina propria, germinative epithelium and lumen were differentiated. In the interstitial space, the Leydig cells, blood vessels, lymphatic space, macrophages, and conjunctive tissue were observed. The volume of each component, expressed in mL, was estimatedknowing the percentage occupied by each structure and the total volume of the testicle. The testicular weight, from which the weight of the tunica albuginea is subtracted, corresponds to its volume, as demonstrated by França [31], who showed that the testicular density is approximately 1 (1.03 to 1,04).
The diameter of the tubules, epithelium height and the length of the seminiferous tubules were also noted. The average tubule diameter was obtained by the measurement of 30 transverse sections with cross-sections as circular as possible, at a magnification of 200x.
According to França and Russell [32] the tubule diameter remains relatively constant in sexually mature non-seasonal animals and therefore these measurements do not take into consideration the stage in the cycle. In the same sections used to measure the tubular diameter, the seminiferous epithelium height was also measured, reaching from the basal membrane to the tubule lumen. The value found represents the average height of two diametrically opposed measurements. The total length of the seminal tubules (CT) per testicle, expressed in meters is estimated from the volume occupied by the tubules in the testicle, and the average tubular diameter obtained for each animal. The following formula was employed: CT = VTS/ πR2, where VTS = total volume of seminiferous tubules; πR2 = area of transversal sections of the tubules.
The tunica albuginea was removed from the right testicle and the testicular parenchyma was homogenized in 5mL of saline-Triton solution (0.15M NaCl, 0.05% (v/v) Triton X) for 2 minutes. The nuclei of elongated spermatids, that are resistant to homogenizing, a characteristic of the stage 19, were used. Four fields per animal were counted in a Neubauer chamber. The number of spermatid nuclei per testicle and per gram of testicle was counted and the values divided by 6,1 daysto convert them into daily sperm production [33].
To study oxidative stress of the left testicle, collected from unfixed animals, the activity of catalase (CAT), the levels of the sulfhydryl (-SH) and lipid peroxidation measured by TBARS formation were analyzed. The antioxidant level was investigated for the enzymes superoxide dismutase (SOD), glutathione-S-transferase (GST) and reduced glutathione (GSH).
Protein concentration was measured with the biuret method [34].CAT activity was tested according to the method of Aebi [35]. The levels of reduced total protein (-SH) were measured using 1.0mg of testicle homogenate in 25mM Tris-HCl, 1mM EDTAbufferwith a pH 8.2, as described by Ellman [36]. Absorbance was measured immediately and after 15 min. at 412nm. A concentration of -SH groups was calculated using the equation (finalAbs –initialAbs) x 1.57 using mM as the unit [37]. Lipid peroxidation was measured by the test of Buegeand Aust [38].
SOD activity was studied with the method of auto oxidation of pyrogallol described by Marklund and Marklund [39] that is expressed in absorbance per minute. To determine the GST activity, 1.0 mg of testicular protein homogenate, 0.1 M phosphate buffer, pH 7.4, 0.1mM GSH and 0.1mM CDNB (1-cloro-2,4-dinitrobenzene) were used according to Habig et al. [40]. The absorbance was monitored for 5 minutes with aone-minute interval at 340nm.
The GSH levels were quantified as described by Ellman [36]. For this, 5 mg protein were added in equal volume to 20% trichloroacetic acid (TCA) containing 1mM EDTA. The supernatant was mixed with the 25mM Tris-HCl, 1mM EDTA buffer at pH 8.2. The procedure was the same as for -SH groups.
The testicles were homogenized in a solution of lysate buffer (50nM Tris-HCL, 150mM NaCl, 1mM EDTA, 1% NP40, 0,25% sodium deoxycholate) with the inhibitors (100 μg / ml PMSF, 2mM Na3VO4. 5mM NaF; 10μg / ml Leupeptin). The tissue was centrifuged at 1500rpm and 4°C. Aliquots of the supernatant were mixed in the buffer for Western blotting (312.5 mM Tris-HCl, 10% solid SDS, 50% glycerol, vestigial quantities of Bromophenol Blue, H2Od) according to the proportion of 1:5, then were boiled and run in a polyacrylamide gel-SDS (PAGE), in the Running buffer for Western blotting, using a BioRad equipment. After the run, the proteins were transferred to nitrocellulose membranes in the transfer buffer Western Blotting Semi-dry (2.5M Tris-HCl, 20% methanol, 0,05% SDS, 2 M glycine). After transfer, the membranes were washed in TBS-T buffer, incubated in the specific primary antibodies in 3% BSA, in basal TBs-T buffer, at room temperature. Finally, the membranes were photographed in the photo documenter UVITECH, developed by “Clarity Max Western ECL substrate”. The intensity of the bands was read by the densitometer, using the Image J program [41].
The Primary antibodies used were: anti-Beclin (0.5:1000; Rabbit polyclonal, ab62557, Abcam-autophagy marker ); CYP11A1 (1:1000; Rabbit anti-Beclin (0.5:1000; D8F4F, Cell Sigma–steroidogenic pathway markers); StAR (1:2500; monoclonal Mouse, ab58013, Abcam - steroidogenic pathway markers); Anti-Hsp70 antibody (1:1000; Mouse monoclonal, ab2787, Abcam - heat shock proteins); and Anti-Hsp90 antibody (1:1000; Mouse monoclonal, ab13492, Abcam - heat shock proteins); Anti-connexin43 (1:5000, Rabbit polyclonal, ab11370, Abcam - cell communication proteins); Anti-N Cadherin antibody (1:8000, Rabbit monoclonal,ab76011, Abcam, cell communication).The secondary antibodies were: Goat, Anti-Mouse IgG H&L (HRP) ab6789, Abcam; and Goat, Anti-Rabbit IgG, 170-6515, Bio-Rad representative.
Small blocks of testicle were fixed in 2% glutaraldehyde and 2% paraformaldehyde in 0.1M cacodylate buffer at pH 7.2. Post fixation with 1% osmium tetroxide was followed by an alcohol series, then infiltrated and embedded in Epon 812 resin. The blocks were sectioned with a diamond knife, stained with uranyl acetate and lead citrate, and observed with the transmission electron microscope (Zeiss: Leo 906 of the Biology Institute of UNICAMP).
For the comparison of values of control and exposed groups the variance analysis used was the Student t test, for parametric values. A value of P<00.05 was adopted as statistically significant. For all values, the average standard deviation (± medium) was calculated.
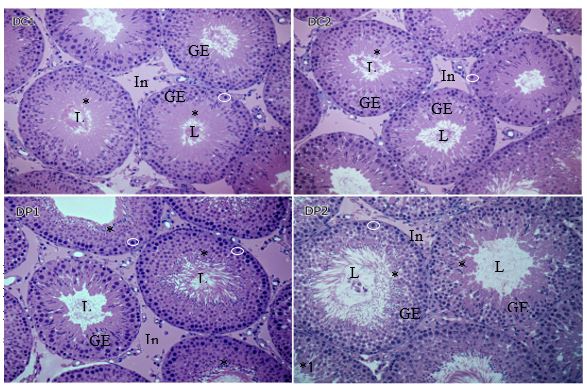
The morphometrical and stereological analyses are compiled in Table I and the morphology can be observed in Figure 1.
A significant increase in height of the cells lining the lumen of the tubules of animals exposed to propolis was observed in comparison with the control group. These results were confirmed by microscopic analysis of the histological sections shown in figure 1. In the tubules of the control group (images DC1and DC2), the region near the lumen has germ cells (*) with lightly stained cytoplasm, differing from darker regions with reduced cytoplasm and close laying nuclei. In comparison, the exposed group (images DP1 and DP 2) the periluminal area is denser, where cell have less cytoplasm and are disorganized (*1). A qualitative analysis of the microscopic images suggests an increase in the number of nuclei of spermatids, spermatocytes and spermatogonia (white circles) that are higher in the group that received propolis, which may explain the higher epithelium in this group. Thus, propolis could stimulate an increase in number of these germ cells.
In the proportion of these components, no significant result was found. However, there was a significant reduction of the seminiferous tubule diameter (Table 1).
A significant increase in height of the cells lining the lumen of the tubules of animals exposed to propolis was observed in comparison with the control group. These results were confirmed by microscopic analysis of the histological sections shown in figure 1. In the tubules of the control group (images DC1and DC2), the region near the lumen has germ cells (*) with lightly stained cytoplasm, differing from darker regions with reduced cytoplasm and close laying nuclei. In comparison, the exposed group (images DP1 andDP2) the periluminal area is denser, where cell have less cytoplasm and are disorganized (*1). A qualitative analysis of the microscopic images suggests an increase in the number of nuclei of spermatids, spermatocytes and spermatogonia (white circles) that are higher in the group that received propolis, which may explain the higher epithelium in this group. Thus, propolis could stimulate an increase in number of these germ cells.
In the proportion of these components, no significant result was found. However, there was a significant reduction of the seminiferous tubule diameter (Table 1).
A diminished number of spermatozoa was observed in all analyses, as shown in Table 2. When compared with the control, the exposed group had a significant reduction in the number of spermatozoa per testicle, in the number of spermatozoa per gram of testicle and the daily sperm production (DSP). However, the GSI was not significantly different.
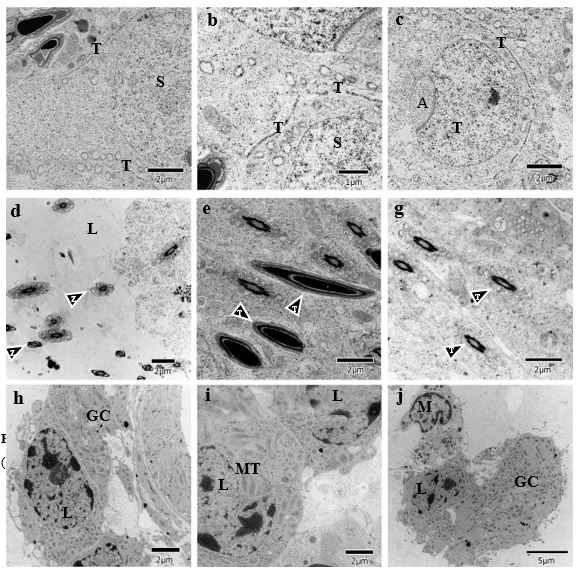
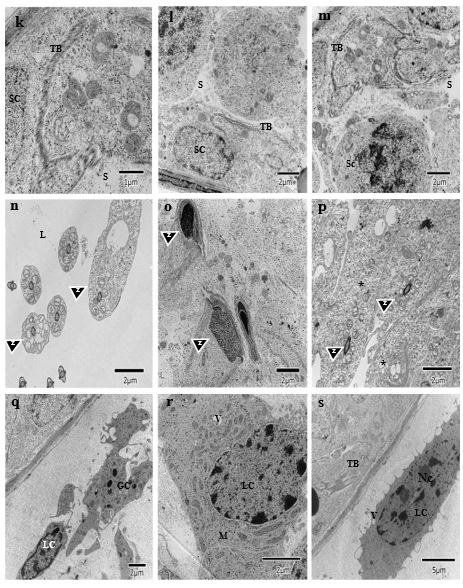
Analyzing the ultrastructural of the testicles of animal in the control group (Figure 2) and of those exposed to propolis (figure 3) the disorganization of the testicular barrier occurred in the second group (figure 3k, l, m, s) when compared to the controls (figure 2a, b, c). Wider spaces can be seen between germ cells, indicating fragmentation of the Sertoli cell extensions. This could explain the disorganization of the spermatogonia verified in the light microscopy images, as in figure 1, where the position and number of spermatogonia are different, when compared to the controls.
In the lumen region, the flagella have excess cytoplasm, as indicated by the arrows in the image 3n, as compared with the image 2d, suggesting a retarded maturation of the spermatozoa. In the image 3o, the spermatozoa are structurally altered and, in the image 3p, retarded development of the spermatids is observed that still retain large quantities of cytoplasm.Such alterations are compatible with the images 2e and 2f. The results corroborate the light microscopy observations, which show an irregular lumen border that appears to be deteriorated, as well asdiminished number of spermatozoa in the sperm count of this tissue. This would also explain why there is an accumulation of spermatids and spermatocytes near the luminal region.
The Leydig cells (CL) in the exposed group have a reduced number of mitochondria and very dense cytoplasm and contain additional smooth endoplasmic reticulum (SER). The ultrastructural modifications can be associated with changes in the process of steroid synthesis and/or of detoxification.
To evaluate de induction of oxidative stress by propolis the activity was quantified for the enzymes, Catalase (CAT), superoxide dismutase (SOD) and glutathione-S-transferase (GST). The levelsof lipid peroxidation (TBARs) and of reduced glutathione (GSH) were also determined. The results were compiled in table 3.
A significant increase was observed for the group exposed to propolis in relation to the activity of the enzymes, Catalase (CAT) and of glutathione-S-transferase, as well as lipid peroxidation (TBARs), that support evidence that propolis induced oxidative stress. The other indicators tested did not show a significant difference.
The quantification method used permitted the identification of the compounds listed in table 4.
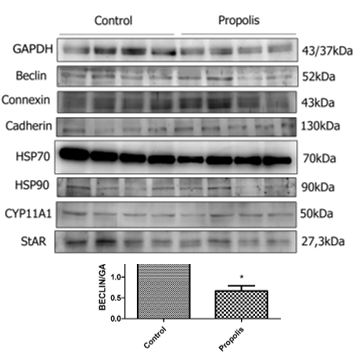
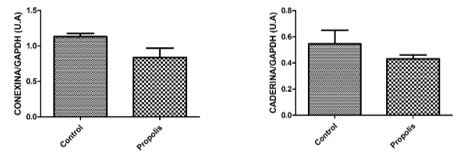
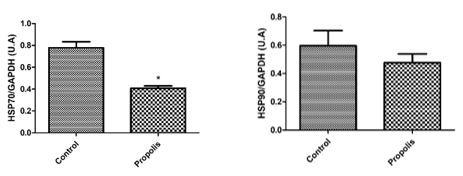
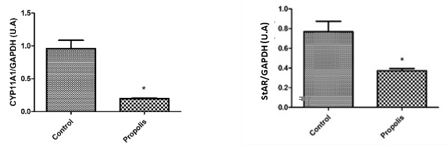
To determine the expression of testicular proteins, specific antibodies were applied against autophagy (Beclin-1) (figure 4), concerning cell communication such as connexin 43 and n-cadherin (figure 5), for the heat shock proteins HSP70 and HSP90 (figure 6) and two proteins that are active in the mitochondria of Leydig cells to convert cholesterol to pregnenolone, CYP11A1 and StAR (figure 7). The average values obtained for the exposed group (P) were compared to the controls (Co) and those values that were significantly different were marked with an asterisk (*).
With the definition of the project of this study, we could verify in the literature concerned, descriptions of structural and functional alterations of the testicles caused by propolis, which was consumed during maturation.
Briefly, it induced an increase in the levels of lipid peroxidation and in the activity of antioxidant enzymes, such as GST and CAT. It reduced the expression of proteins located on the mitochondrial membranes of Leydig cells, which participate in steroidogenesis, such as StAR and CYP11A1. It also increases the expression of proteins such as Beclin, and the number of mitochondria, as well as cytoplasm densification and an increase in smooth endoplasmic reticulum, all of which affect steroidogenesis. An increase of the germinative tissue, is a consequence of retention and the alteration of cell structure, that lead to a reduction of the daily sperm production and malformations of spermatozoa seen in the luminal region.
To understand how these events could have occurred, we can begin with the induction of lipid peroxidation by propolis, and the significant increase in the level of GST in the animals that received this substance. This enzyme belongs to the multi-gene family of isoenzymes that catalyze the conjugation of electrophilic compounds to GST. This enzyme family has a characteristically wide specificity to substrates that have low affinity. This low enzymatic efficiency has an important role in the evolution of GSTs as a wide spectrum detoxification agent, both for the endogenous components and the exogenous ones [42], as is the case of propolis. The increase observed is probably a protection mechanism applied in the effort to detoxify the organism from this compound.
However, even with this mechanism, propolis induced significant increase in CAT levels, which is an enzyme responsible for the inactivation of hydrogen peroxide (H2O2) in the cell. This impedes a cascade formation of new by-products resulting from successive monovalent reduction of the intermediate oxidizing agents. The excessive production of hydrogen peroxide, by a persistent situation, can cause direct tissue damage, lipid peroxidation of the cell membranes, protein carbonylation, cytoskeletolysis and DNA alterations [43]. The results obtained demonstrate the increase of lipid peroxidation, by the significant rise in TBARs, most likely due to excessive H2O2 production, as evidenced by the increase of CAT.
Lipid peroxidation must have triggered disorganization of the Sertoli cell membranes which lead to the loss of adhesion of the germ cell line. This was observed with light and electron microscopy, where immature cells were loosened and reached the tubule lumen, as malformed cells, which very likely are not functional, thus compromising the reproductive capacity of these animals when adults, since their DSP was significantly reduced.
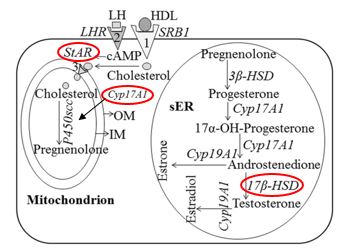
We can also infer that the action of these radicals on the membranes of Leydig cells can answer for the significant reduction of the expression of two mitochondrial proteins that participate in steroidogenesis. StAR (Steroidogenic Acute Regulatory Protein), which mediates cholesterol transfer from the external to the internal mitochondrial membrane, making it crucial for cholesterol transport in the mitochondria, where steroid synthesis begins. CYP11A1 belongs to the family of Cytochrome P450 that catalyzes the cleavage of cholesterol to make pregnenolone. The biosynthesis of testosterone is illustrated in figure 8, where the above cited enzymes can be found and visualized in the enzymatic pathways
Interestingly, Li et al. [45] showed that the StAR protein expression and the testosterone production were reduced in the primary Leydig cells in rats, when exposed to H2O2, which demonstrates the noxious effects of reactive oxygen species (ROS) on spermatogenesis. These authors described aged Leydig cells as having deficient autophagy, a greater number of dysfunctional mitochondria and a higher level of ROS. They proposed that a deficiency in autophagy could result in an accumulation of ROS, which, in turn, leads to the decline of steroidogenesis in Leydig cells of aged rats. Also, they attributed a connection between the low levels of testosterone and StAR expression and the deficiency in autophagy of the Leydig cells with the intracellular accumulation of ROS generated by dysfunction of aged mitochondria [45]. In like manner, our results demonstrate a reduction of StAR and Beclin expression in rats exposed to propolis.
Autophagy was established as a homeostatic mechanism that recycles the intracellular constituents. It is accepted that autophagy is a type of non-apoptotic programmed cell death. Most of the evidence supports autophagy as a route toward survival that is necessary for cell viability. The application of autophagy in the testicles is under investigation and its association to spermiogenesis, the death of germ cells, spermatogenetic function and testosterone secretion. Beclin 1, the ortholog of yeast in mammals, Atg6/Vps30, is a critical regulator of autophagosome formation and an efficient autophagy biomarker [46].
Zhang et al. [46] suggested a possible role for deficient autophagy in testicular toxicity after exposition to fluoride during development. Considering this, the decline of Beclin expression was observed after exposition to propolis. This event could be responsible for the disorganization observed in the germ tissue seen with light and electron microscopy.
Ultrastructural observation of the Leydig cells showed the reduced number of mitochondria and the increase of smooth endoplasmic reticulum. Studies have demonstrated that damage to the mitochondria, in which the greater part of biosynthesis of this hormone occurs, can result in the dysfunction of the testes [47].
Also, according to Arun et al. [48] low expression levels of the steroidogenic mechanism crucial to Leydig cells, such as StAR, CYP11A1 and the hydroxysteroid dehydrogenase can cause reduction in the levels of testosterone in stressed rats.
Taken together, our results point out that propolis interferes with the process of steroidogenesis. Steroidogenesis depends on disponible cholesterol on the internal mitochondrial membrane. Although other proteins can be involved in furnishing mitochondrial cholesterol, there is abundant biochemical, clinical and genetical evidence that show the importance of StAR as a labile protein mediator for this process [49]. Our data demonstrates that rats exposed to propolis had a significant negative regulation of StAR, suggesting that there was an impairment of testosterone.
Besides, testosterone is produced principally in the Leydig cells and it is fundamental for development and reproduction in man. The function of Leydig cells is supposedly harmed by the diminished production of testosterone (T) due to lower activity of CYP11A1, CYP17A1, 3β-HSD e 17β-HSD [49;47]. In this study, we relate a significant suppression of CYP11A1 in rats exposed to propolis. Thus, we suggest that these animals had a probable reduction of testosterone.
Our results indirectly corroborate this observation, although we could not quantify the T levels in the experimental animals. The reduction in the number of spermatozoa, the DSP and damaged spermatozoa are signs of a rupture of steroidogenesis. Some studies that were designed to identify potential markers to qualify sperm and masculine infertility include genes and proteins of the HSP70 family and their evaluation [50-51].
HSP70 was significantly diminished in rats exposed to propolis in our study. Sonmez et al. [52] found a significant loss of HSP70 expression in the interstitial tissue and a significant increase in the expression of HSP70 in germ cells of the testicles of rats exposed to propolis.This event could have a protective effect on the damage induced by metotrexate, which they studied, However, the authors commented that HSP70 has a role in cell division and differentiation in the germinative epithelium. It is also involved in the regulation of steroid hormone synthesis, in Leydig cells. HSP70 participates in crinophagy in Leydig cells and its reduction, therefore also leads to altered testosterone synthesis. In this context, lower levels of HSP70 could be involved in a rupture of steroidogenesis and DSP as observed in our study.
According to a recent revision by Sabir, Akhtar and Saleem [53], the endocrine disruptors are exogenous substances that have the potential to alter a function of the endocrine system and induce adverse effects to the health of an organism. A large variety of substances have been indicated as endocrine disruptors, including pesticides, industrial sub products, environmental pollutants, plastics, metals, food contaminants, products of personal hygiene and pharmaceutical products.
Ylmaz, Korkut e Erkan [47] showed that various chemical products that are endocrine disruptors significantly reduce the expression of StAR in the Leydig cells, negatively affecting the biosynthesis of testosterone. Based on the data obtained in our study, the following question may be asked; “Could propolis be considered an endocrine disruptor?”
More research will be developed to elucidate this supposition. An interesting alternative would be to analyze the components that have been isolated from propolis. Sousa [54] analyzed seven important phenolic compounds obtained throughout a year in samples of Baccharis dracunculifolia. He found that its composition included caffeic acid (CAPE), ferulic acid, aromadendrin-40-methyl ether (AME), isosakuranetin, artepellin C, baccharin and2.2-dimethyl-6-carboxyethenyl-2H-1-benzopyran acid (DCBEN). According to Rodrigues et al. [55], phytochemical studies of this species demonstrated the presence of flavonoids (flavone and subgroups, especially flavonol); diterpens (especially the diterpenslabane and clerodane) and triterpens.
The results found in this study show that propolis affects the development of the male reproductive organs, harming the male fertility in adult life. Therefore, this research indicates that the exposition to propolis diluted in water (6mg/kg/day) can represent a risk for male reproduction, affecting steroidogenesis and DSP in rats.
I thank everyone involved in this research, who, in any case, collaborated for the results to be promising.
The authors declare no conflict of the interest.