Coronary Vessel Supersensitivity to Noradrenaline in the Presence of Chronic Sympathetic Denervation
It is well known that there is usually super-sensitivity to the normal neurotransmitter in chronically denervated organs. The present consensus of opinion is that there is no super-sensitivity of response of myocardial arteriolar resistance vessels to nor-adrenaline after chronic sympathetic denervation; this opinion was tested. We re-analysed the data in the literature on innervated myocardium, plus the effect of chronic sympathetic myocardial denervation induced by surgery plus phenol application. We found that the opinion is based on studies of isolated epicardial arteries. Studies of resistance vessels mostly ignore an important confounding factor, in that myocardial blood flow (MBF) within myocardium is heterogeneous under all circumstances. This heterogeneity is partly related to similar heterogeneity in myocardial oxygen consumption (MVO2), and partly to heterogeneity in local noradrenaline, as assessed by 11C-hydroxyephidrine positron emission tomography. The local volume of distribution of 11C-hydroxyephedrine in innervated myocardium was inversely correlated to local MBF, at the same perfusion pressure, i.e., increasing vasoconstriction with increasing tissue noradrenaline. In chronically denervated myocardium, local MBF was lower for any given amount of noradrenaline, showing the existence of supersensitivity of the resistance vessels. This factor may have a deletereous effect in diabetic patients with cardiac autonomic neuropathy.
Keywords: Coronary Circulation; Autonomic Nervous System; Myocardial Blood Flow; Chronic Denervation
Cardiac autonomic neuropathy almost certainly plays an important role in diabetic heart disease according to Draman, et al.[1]. The generally accepted concept of denervation supersensitivity is that, in the chronic absence of the neural innervation, the response of neurotranmiter applied to the organ evokes an exaggerated response when compared with the innervated case. The present analysis explores this phenomenon in the instance of noradrenaline (the neurotransmitter of the sympathetic system) applied to denervated myocardium. Nor adrenaline causes both alpha and beta receptor effects on ventrricular myocardium, the former being vasocontricion, and the latter increased contractility and vasodilation, which may be due to increased blood flow and shear-stress-induced dilation. We here concern ourselves with the dominant alpha-adrenergically mediated vascular constriction. Such supersensitivity has been denied in the case of the coronary vasculature in chronic regionally denervated hearts because the responses of isolated epicardial arteries, to applied nor-adrenaline, are not altered [2]. Classic studies of cardiac denervation involved a surgical technique [3-5] that removed the sympathetic and parasympathetic innervation (as is also the case in transplanted organs). In those preparations the increased response to noradrenaline in chronically denervated tissue is a well-accepted phenomenon that is certainly present in sinus node and myocardium as far as tachycardic responses and contractility responses are concerned [3,4]. Using the alternative method of selective regional sympathetic denervation with phenol, supersensitivity of the shortening effect on effective refractory period by noradrenaline was demonstrated [6,7]. Chronic sympathetic denervation supersensitivity is not accompanied by upregulation of ß-adrenergic receptors [8-10]. The mechanism is thought to be that chronically denervated myocardium lacks the sympathetic neuronal re-uptake mechanism, the neurones having degenerated [5]. Thus, any increase in tissue noradrenaline has a greater effect on the adrenergic receptors of the target tissue. It would be extraordinary if supersensitivity of the heart rate response and of the contractility response were present, but not present for coronary arterioles, which are in the same tissue. Such supersensitivity may have been missed because, if studied under basal conditions, there is no basal release and re-uptake of neurotransmitter, i.e., no resting sympathetic vasoconstrictor tone [3-5].
Sympathetic vasoconstriction is only recognised as being present on exercise or other causes of enhanced sympathetic activity [11]. Even the high coronary vascular resistance in human hypertension is not thought to be sympathetically mediated [12]. Even the increased perfusion upon alpha-adenergic blockade is thought to be due to blockade of the effect of circulating catecholamines rather than of sympathetic neural tone [13]. This accepted view is based on the fact that the mean myocardial blood flow (MBF) is not significantly increased when measured in regionally denervated myocardium and compared to innervated tissue in the same heart [13,14]. However, any basal sympathetic vasoconstriction would not necessarily be apparent from average data because of the considerable point-to-point spatial heterogeneity of MBF [15]. In addition, the MBF data does not take into account its primary determinant, the myocardial oxygen consumption (MVO2), which also shows considerable point-to-point spatial heterogeneity of MVO2 [15,16]. The purpose of the present study was to test the following hypotheses:-
1. Heterogeneity of sympathetic innervation may mask differences in MBF, so that local MBF may be lower in locations with higher amounts of noradrenaline neurotransmitter.
2. Super-sensitivity of coronary resistance vessels after chronic sympathetic denervation may be demonstrable at the local level.
All data were taken from published papers. The data from papers in which a region of chronic sympathetic denervation were compared with an innervated region in the same heart were examined [7,8,10,13,16,17]. All papers used a standard method of regional denervation in dogs under anaesthesia, recovery for 3 or more weeks after the operation, and validation of chronic denervation by catecholamine assay. This method of denervation involves only sympathetic denervation whereas global denervation also removes the parasympathetic supply. The method has the additional advantage that the normal, non-denervated region can be used for control measurements in the same heart. In both the studies that we now re-analyse, regional denervation of the left ventricle was performed using general anaesthesia. 11 dogs were used in the PET study and 7 in the NMR study. A left thoracotomy was performed, and the heart exposed by opening of the pericardium. The circumflex branch of the left coronary artery (LCx) was dissected free. Phenol (6%) was applied to the circumflex artery and surrounding tissue to destroy the nerves accompanying the artery. The thorax was closed and the animal was allowed to recover. Postoperative analgesia and antibiotic as necessary were given. A period of 3–4 weeks was allowed to elapse for myocardial catecholamines to deplete. This form of denervation does not unclude the pacemaking and conduction systems.
Only two of these papers examined heterogeneity in relation to the determinants of MBF, and it was from these that the data were analysed. Both groups used dogs as the experimental animal. Rimoldi et al., measured both MBF heterogeneity and sympathetic innervation heterogeneity using positron emission tomography (PET) [10]. The radioisotope, 11C-hydroxyephidrine (HED) is handled by postganglionic sympathetic nerve endings in the same way as noradrenaline; MBF was measured with oxygen-15- labelled water (15H2O). Alders et al., measured both MBF heterogeneity and MVO2 heterogeneity using microspheres and 13C magnetic resonance spectroscopy (MRS) respectively [16].
Values are expressed as mean ± 1 SD. Data sets were tested for normality by means of the Kolmogorov-Smirnoff test. Mean values for innervated and denervated tissue were compared by Student’s t test or Mann-Whitney test. Ratios of MBF to MVO2 were compared by Mann-Whitney test. A linear regression analysis was carried out to examine the relationship between [11C]-HED content and MBF, under baseline conditions and a state of metabolic stimulation. Differences between pairs of regression lines were compared by ANCOVA (Prism Software, Graph Pad Inc. San Diego, CA, USA). Other analyses were performed using InStat software (Graph Pad Inc, San Diego, CA, USA). A probability value of less than 0.05 was considered significant.
Mean MBF in the two regions were not significantly different in any of these papers.
Data from Alders et al., were used for the analysis (n = 7) [16]. The open-chest preparation used temporary halothane anaesthesia for the surgery involved in opening the chest and making appropriate cannulations. Further anaesthesia was maintained during the experimental period with alpha-chloralose at a dose sufficient to maintain a steady state with physiological blood gas tensions. Open chest conditions were required because the method of measuring MVO2 could only be performed once and required rapid excision of the heart and rapid freezing of the myocardial tissue. MVO2 was measured in freeze dried samples by quantification of the amount of 13C from labelled substrate accumulating in the various carbon atoms of the glutamate molecules, determined by magnetic resonance spectroscopy (MRS); this enabled calculation of tricarboxylic acid cycling rate. MBF was measured by the standard microsphere method. In the analysis, “normalised data” means that between-experiment variation was compensated by dividing individual absolute measurements by the mean value of the experiment from which the datum was derived. All comparisons were made between a chronically denervated regions and innervated regions.
Linear regression analysis using quantitative raw data (not normalised) data, showed that total regional MBF (ml/min) was correlated with regional MVO2 (μmol/ min).
Innervated regions: MBF= 0.1222(MVO2) ± 2.109;
Denervated regions: MBF = 0.1199(MVO2) ± 4.092
With analysis of covariance, the adjusted mean MBF (ml/min/g dry weight), which is the MBF calculated from the regression equation for the pooled mean MVO2, was significantly higher for denervated regions, whereas the slopes were not significantly different.
A similar analysis was performed after normalizing MBF and MVO2 values to the mean values within each heart.;
Innervated regions: MBF = 0.68(MVO2) ± 0.14, r = 0.66;
Denervated regions: MBF = 0.46(MVO2) ± 0.63, r = 0.50.
Analysis of covariance to compare the two relationships resulted in an F variance ratio for comparison of slopes of 1.004 (p = 0.32, NS) and an F variance ratio for difference of elevations (adjusted means) of 4.810 (p = 0.032). (Adjusted mean MBF innervated = 0.82, denervated = 1.09, i.e., an increase in denervated tissue of 27%).
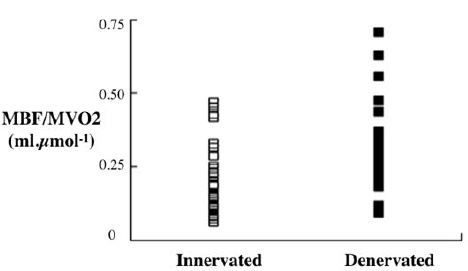
A simple way of demonstrating the results is to normalise MBF by diving by corresponding MVO2 as in (Figure 1).
As the arterial perfusion pressure is the same for all regions, these results mean that for any given local MVO2, there was vasoconstriction in the innervated regions compared with the denervated regions. In spite of this the mean MBF (ml/min/g dry weight) was not significantly different between the regions: 5.56±3.47 innervated; 7.48 ± 3.62 denervat-ed (NS).
Data from Rimoldi et al., were used for this analysis [10].
The intact dogs used as experimental animal in the study of Rimoldi et al., were sleeping closed chest under a dose regime of chloralose less than that required for surgical anaesthesia, the sedation being required so that the animal rested without motion other than respiration within a positron emission tomographic (PET) scanner [10]. MBF was measured using 15O-labelled water; innervation was measured from the volume of distribution (Vd) of [11C]-HED. Both were quantified by PET (Table 1).
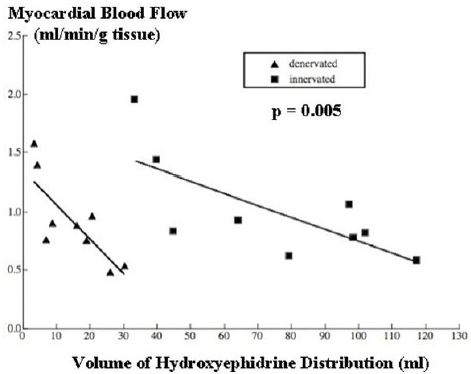
It was found that local MBF, in various regions within innervated tissue, was inversely related to 11C-HED (Figure 2). The magnitude of the significant inverse relationship found between the MBF and 11C]HED Vd was given by:
MBF =1.772 – 0.01HED; r = 0.72, p = 0.023 (Figure 2)
The arterial perfusion pressure for all these regions within the same heart is the same. Therefore, the data in (Figure 2) show that coronary vascular resistance in innervated tissue is heterogeneous, and that resistance increases with denervation (vasoconstriction) at the same amount of local neurotransmitter.
The relationship of MBF to HED in chronically denervated myocardium was also measured by Rimoldi et al., under basal condition [10]. We have compared this with the same relationship in innervated myocardium (Figure 2). MBF was reduced for any given value of HED. Comparison by ANCOVA showed that, although there was no significant difference between the slopes of the regression lines, they were significantly different in adjusted means (elevations) (F=10.78; p=0.005).
These, and previous studies confirm that there is no significant difference between mean blood flow for innervated and chronically denervated tissue. Does this imply, as previous authors have suggested, that there is no resting sympathetic vasoconstrictor tone? Those who hold this opinion can argue, correctly, that open chest conditions cannot be regarded as basal, as were those in the conscious dogs studied by Chilian [2,13,17,18]. However, it is a fact that in the open chest preparation, Alders et al were able to demonstrate sympathetic vasoconstriction at local level, taking heterogeneity of MBF within myocardial tissue into account, in the presence of no difference in mean MBF [16]. If vasoconstriction can be demonstrated in the presence of no difference in mean MBF, how can the presence of no difference of MBF in Chillian’s experiments be any guarantee that vasoconstriction was not present? This question remains unanswered at present.
The argument about the presence or otherwise of basal conditions in Rimoldi et al., study are less potent, because these were sedated closed chest intact dogs [10]. Accepting that they were not basal, the fact remains that vasoconstriction was demonstrated in innervated tissue, and that the mean MBF in this innervated tissue was the same as that in denervated tissue. Again, if vasoconstriction can be demonstrated in the presence of no difference in mean MBF, again how can the presence of no difference of MBF in Chillian’s experiments be any guarantee that vasoconstriction was not present?
From the preceding two paragraphs, we conclude that the equality of mean MBF between innervated and denervated regions is not evidence against resting sympathetic tone, and that the point remains open. The mean MBF is just too insensitive a measurement from which to obtain the correct conclusion, because no account is taken of the fact that MBF is very heterogeneous within myocardium, and that MBF in each location is under metabolic and neurogenic control, and probably, other controls. The evidence from the more relevant studies, which take account of the heterogeneity of MBF, show that resting coronary vascular tone does indeed exist in non-basal myocardium [10,16].
11C-HED uptake shows an inverse relationship with MBF in both innervated and denervated tissue which indicates that control of blood flow via the coronary resistance vessels is related to local noradrenaline release [10] (Figure 2). How-ever, the fact that, for any given 11C-HED uptake, there is less MBF in the denervated tissue, indicating greater vasoconstriction in response to noradrenaline, is evidence of supersensitivity of the coronary resistance vessels.
It is also quite clear that the reason that innervated and denervated mean MBF are the same is because there is such super-sensitivity of coronary resistance vessels (Figure 2). Without this super-sensitivity, the equality of mean MBFs could not have been obtained. MBF in chronic regional denervation, in which there is no increase in mean MBF and MVO2, differs from chronic global denervation in, which mean basal MBF and MVO2 are increased, presumably as a result of parasympathetic denervation [19,20]. However there is no reason for sympathetic supersensitivity to be different in the two preparations, and indeed, supersenstivity is well recognised in global denervation, from the increased heart rate response of the sinus node, and the increased contractility response of myocardium to noradrenaline [3,4].
Supersensitivity has been denied in the case of the coronary vasculature in chronic regionally denervated hearts, because the responses of isolated epicardial arteries, to applied nor-adrenaline, are not altered [2]. We have no reason to deny this observation, but would point out that the epicardial coronary arteries are not resistance vessels, and that epicardial arteries, on the surface of the heart, are in a very difference milieu than the resistance vessels. Of possible relevance is the fact that ß- adrenergic receptor density is unchanged by chronic denervation [9,10]. There is a discordant result claiming increased ß receptor density, but this is not our experience as far as total density is concerned, as opposed to a shift in subtype distribution [5,9]. We would not therefore expect a change in total alpha-adrenergic receptor density in myocardial resistance vessels, although we are aware of confirmation of this only by the demonstration of no change of the alpha subunit of the stimulatory G protein (Gs alpha), of whole myocardium [8].
In conclusion, we suggest that (1) that resting (non-basal) sympathetic coronary vasoconstriction exists (2) such vaso-constriction is overcome by metabolic rate (energy demand) and (3) that it is still a plausible hypothesis that coronary resistance vessels within chronically denervated tissue are super-sensitive to noradrenaline. These conclusions are those expected from considerations of normal general physiology. The clinical significance may occur in diabetic hearts in which autonomic neuopathy is present [1]. Increased vasoconstriction due to supersensitivity of response to alpha-adrenergic stimulus would be the reverse of beneficial.
The authors would like to acknowledge the assistance of and discussion with the staff of the MRC Clinical Sciences Centre and Hammersmith Imanet, the staff of the Department of Physiology of Maastricht University and the staff of the Laboratory for Physiology of the Free University of Amsterdam. The study was supported by the Coronary Thrombosis Trust.