Corrosion Behavior of Zn/Graphene Composite in Aqueous Electrolyte System
In the present study, the electrochemical corrosion behavior of zinc (Zn) and thin layer of graphene on Zn (ZnG) in different salt electrolyte such as NaCl, KCl and Na2SO4 are report. The phase structure and Crystallinity is investigate using X-ray diffraction, Surface morphology and purity of the sample is investigate using Scanning Electron Microscopy and Energy dispersive X-ray analysis (SEM/EDAX) and Raman spectroscopy. The electrochemical corrosion behavior of the Zn and graphene coated on Zn are also investigated using Electrochemical Impedance Spectroscopy (EIS) analysis. The tafel slop and Nyquist plot confirms that ZnG shows better corrosion resistance and lower corrosion rate in KCl solution compare to all other electrolytes which is performed in Zn.
Keywords:Graphene; Electrochemical Techniques; Composite Materials; Corrosion Test; Surface Properties; Electron Microscopy
In the past years, steel materials find large applications and are used in various sectors because of its impressive mechanical strength. However, they have poor corrosion resistance, due to their thermodynamics instability when exposed to environment like high temperature, humidity and high pH [1]. Zinc is the 24th most abounded element in earth. The metal is hard and brittle at most temperature but become malleable between 100 to 150 °C. Zinc is worked to several applications such as, fair conductor of electricity, commonly used as a anti-corrosion agent, powder Zn is used in this way in alkaline batteries and sheets of Zn metal form the cases for and act as anodes in Zn-carbon batteries, Zn is used as the anode or fuel of the Zn-air battery fuel cell [2,3]. In this paper, electrochemical behavior of ZA-8 (Chemical composition of ZA-8 zinc alloy show in Table 1 anodized by the process will be focused. Zinc is more corrosion resistant when compared to steel in most natural atmospheres; the exceptions are ventilated indoor atmospheres where the corrosion rate of both steel and zinc is extremely low and certain highly corrosive in industrial atmospheres. Coatings of metallic zinc are usually regarded as the most economical means of protecting against corrosion. Seven methods of commonly applying a zinc coating to iron and steel that are in general use are stated: electro-galvanizing, zinc plating, mechanical plating, zinc spraying, hot dip galvanizing, continuous-line galvanizing and painting with zinc-bearing paints. But still Zn also gets corroded in the contaminated environment and the rate of corrosion of Zn can be decreased by making it as composite is what shown in this work.
We are urgently in need of decreasing the corrosion rate and increasing the corrosion resistance. In the past, fullerene and exfoliated or intercalated clay metal have been used for anti-corrosion applications but those materials are highly insulating and also hygroscopic [4-6]. Hygroscopic materials act to suppress the anti-corrosion behavior of the coatings barrier properties. For coated metal substrates to be used in some applications such as fuel cells and solar cells. The coating needs to be electrically conductive as a fully insulating coating in unsuitable [7,8]. The alternative think is the newly developed nanoparticle is graphene.
Graphene one of the carbon allotropes, two dimensional honeycomb lattice structure. It has unique characteristic properties, such as chemical inertness, thermal and chemical stability, and high surface area. Graphene that could have a significant impact on the chemical, pharmaceutical and electronic industries [9]. Applied as paint, it can provide an ultra-strong, non corrosive coating for a wide range of applications in industries. Mechanical strength and impermeability to ion diffusion make it very strong candidate for corrosion to resistance and production coating as material [10].
Graphene is one of the best anti-corrosion materials. It is having very good hydrophilic nature. Impermeability of pure graphene, the coating acts as an excellent barrier to water, oxygen and other corrosion materials. When the corrosion starts at the metal/coating interface, electrons generated by the anodic reaction move through the metal to cathodic site, and complete the corrosion reaction [11-13]. This is the reason that, once the corrosion starts at the interface of the metal and a conventional insulating coating, it is difficult to stop. However, when functionalized graphene is incorporated in the coating, because of its excellent electrical conductivity an alternative path for the electron is provided, so that they may never reach a cathodic site. Moreover, graphene and graphene hybrid nanocomposites can be used inhibitors in protective coating to prevent oxidation of underlying metals in oxidizing chemicals, water or air for longer periods [14-17]. Graphene nanoparticles layer will block the diffusion of oxygen atoms with a relatively higher energy barrier. The oxygen molecule is weakly bound to bare graphene surface and when they get inactive, they can easily get dislocated into two oxygen atoms adsorbed to low coordinated carbon atoms of free vacancy at the edges. The oxidation behavior is reduced for these oxygen atoms and therefore the protection from oxidation provided by graphene coatings is weakened. Similarly plain Zn coating will have increased surface defects. Therefore, Zn – Graphene composite, will reduce surface defects, grain size and show better corrosion resistance property than plain zinc or graphene [18].
Graphene has synthesised by several methods such as exfoliation sol-gel chemical reduction ion-exchange and electrochemical method [19-23]. Most of the advantage present in the electrochemical method because naturally friendless, high qualitative and quantitative, control to applied the potential and recovery the using electrolyte. So, prepared the graphene by electrochemical method. The graphene is coated on zinc alloy using a doctor blade [19]. The corrosion studies of Zn / ZnG in three different electrolytes with different concentration (NaCl, Na2SO4 and KCl) by Autolab workstation. The ZnG is more favorable for corrosion resistance than Zn in above electrolytes. In especially the ZnG is high corrosion resistance in KCl than NaCl and Na2SO4, as KCl is being a metal halide and the rate of reaction is less.
The structural, surface morphology and purity was investigated using X-ray diffraction, Scanning Electron Microscopy and Energy dispersive X-ray analysis (SEM/EDAX) measurements and Raman spectroscopy. The electrochemical behavior of the Zn and graphene coated on Zn were studied in terms of their linear sweep voltammograms and Electrochemical Impedance Spectroscopy (EIS) analysis. Aim of this work, is to show that ZnG has high corrosion resistance when compared with Zn.
Purified graphite rods were used as electrodes (6 mm, Aldrich 99.9%) and poly (Sodium diphenylamine sulphonate) (PSDS) (Himedia, 95%) was used as an electrolyte. The electrochemical exfoliation method was employed using potentiostatic (constant voltage) technique (Metrohm Autolab, PGSTAT 302N, The Netherland) to synthesize high-purity graphene. First, 0.01 M PSDS electrolyte solution was prepared by dissolving the salt in to de-ionized (DI) water, then two graphite rods were inserted into a beaker filled with an electrolyte solution, with a separation distance of 2 ± 0.1 cm [23]. A constant dc current potential of 6.2V was applied between two electrodes. During the electrolysis, the anode was corroded gradually to form a black precipitate in the beaker after 20 min. The exfoliation was continued for 4 h, and then the dispersion was taken from the electrolytic cell. The obtained dispersion was centrifuged (Remi, C-24 BL, India) at 10,000 rpm to remove the lighter particles. The supernatant was decanted and then, washed with de-ionized (DI) water and subsequently with ethanol and then finally dried at 353K for 24h to obtain graphene oxide powder. The obtained powder was reduced by hydrazine hydrate and dried in a hot air oven at 353K to obtain graphene sample [20]. This graphene sample was later composited with Zn alloy.
The phase and crystalline nature of the prepared samples were analyzed by X-ray diffractometer (XRD) (X’ Pert PRO, PANalytical, The Netherlands) using CuKα (λ= 1.5406Å) radiation source. The samples were scanned over the 2θ range of 10˚ to 80˚ at room temperature (298K). The observed peak positions and the relative intensities of the powder pattern were identified in comparison with the reference diffraction data. The surface morphology of graphene is examined under scanning electron microscopy coupled with energy dispersive X-ray analysis (SEM-EDAX) (JEOL JSM-6390LV, Japan) operating at 20 kV. The Raman spectra of the as-prepared graphene sample was obtained using a Raman spectrometer (Japan, WITech alpha300) confocal Raman systems equipped with an Nd:YAG laser (λ=1064 nm). The Raman spectra were recorded with a frequency of 514nm as an excitation source using (RENISHAW M005-141, Japan) with a laser spot size of 1 μm.
A zinc metal bar was used for the present study. The metal bar was cut into a small round specimen (1 cm2) and then subsequently polished with 9μm, 3μm, and 1μm silicon carbide grit papers and cleaned after each steps with acetone. The as-synthesized graphene powder was mixed with PVDF and N-Methyl-2-pyrrolidoneat 80:15:5 weight ratio in order to prepare slurry. The slurry was further coated over the zinc specimen using the doctor the blade technique [15]. The coating was repeated 3 times in order to achieve a uniform thickness of ~1μm of graphene on to the zinc metal surface. The coated zinc was dried in a hot air oven at 353K for 1h and then used for corrosion studies. Hereafter, the coated sample will be identified as ZnG.
The corrosion behavior of zinc metal was examined using a three electrode cell set-up. In this set-up, the zinc metal was used as a working electrode, while platinum and saturated calomel as counter and reference electrodes, respectively, for chloride based electrolyte. The salt bridge was used as a reference electrode for sulphate electrolyte. Electrochemical corrosion study was carried out (until the concurrent value was obtained) for both zinc and graphene coated zinc in different electrolytes using Autolab equipment (PGSTAT302N, Metrohm Autolab, and The Netherlands). The applied potential window for corrosion study was -1.8 to -1V at a scanning rate of 5 mV. Corrosion potential (Vcorr) and corrosion current (icorr) was determined from the extrapolated data of the cathodic and anodic parts of the potentiodynamic polarization test or Tafel plot. The impedance data for Zn and Zn/graphene was obtained within the frequency range of 0.01-100 kHz with AC amplitude of 5 mV. All the experiments were repeated three times in order to confirm the reproducibility of the results.
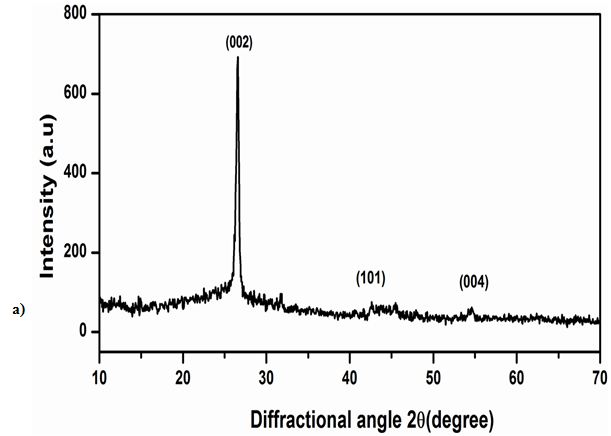
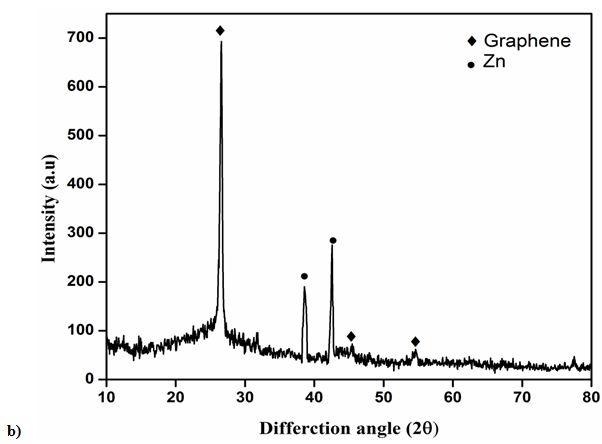
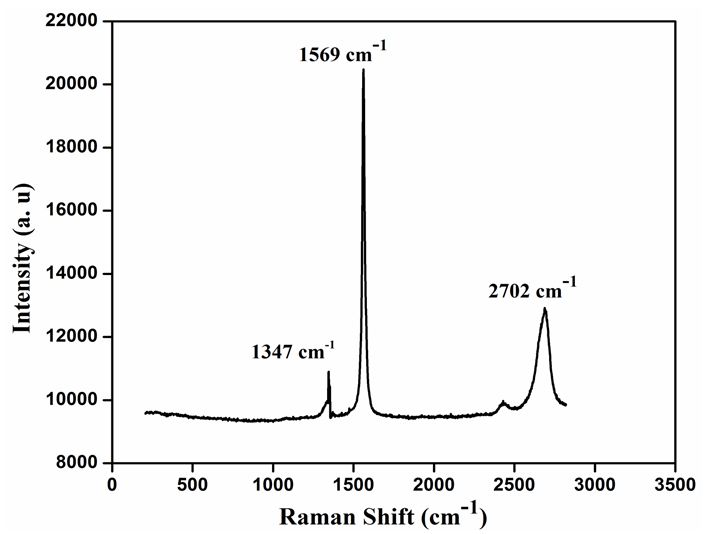
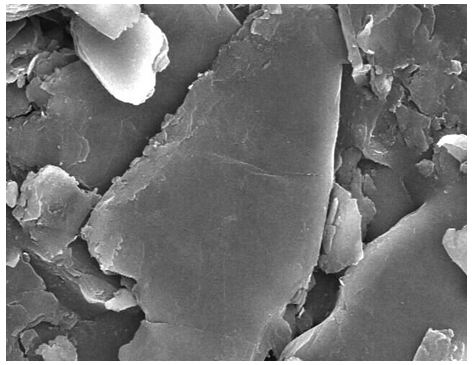
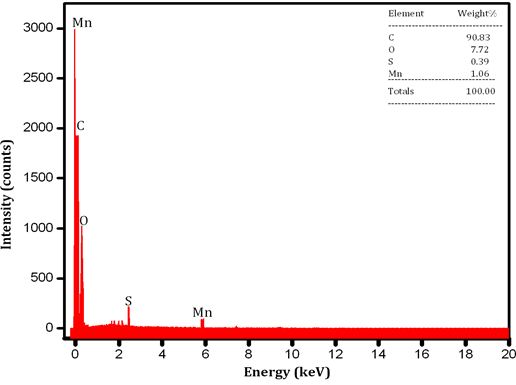
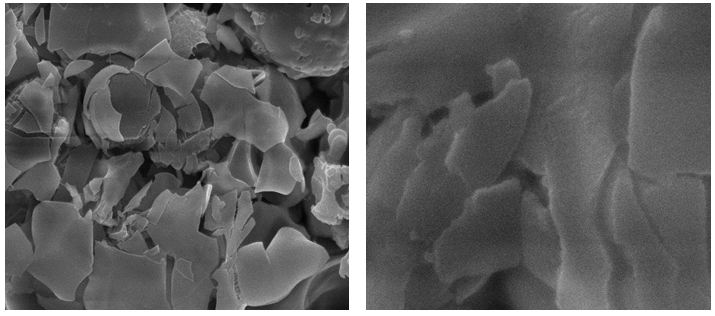
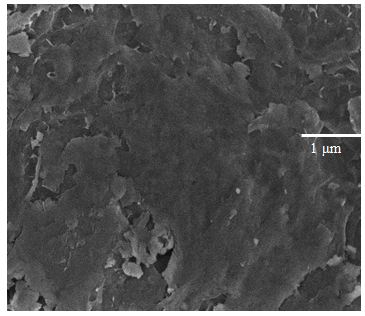
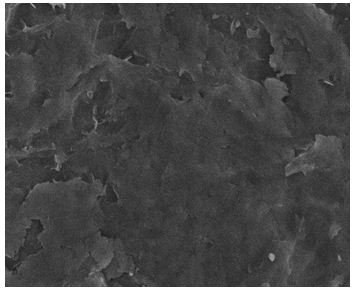
Figure 1 Shows the observed peak in XRD pattern confirms the crystalline nature of the prepared graphene samples. A sharp intensive peak observed at 26.40° indicates existence graphene. However, the XRD pattern shows three peaks at 2θ value of 26.40, 44.28 and 54.35° for the planes (002), (101) and (004). Figure 1b shows the XRD pattern of Zn/graphene sample, the observed peak at 38.35° indicates presence of zinc. The XRD pattern shows two peaks at 2θ value of 38.35 and 42.62° for the planes (100) and (101). The observed results confirmed graphene is coated on Zn surface. Figure 2 shows the Raman spectra, the D, G, and 2D bands are clearly observed, respectively in 1347, 1569, and 2702 cm-1 for the graphene samples. The above observation confirms the existence of a graphene layer. The SEM image reveals that sample have been ultrathin sheet morphology is shown in Figure 3. The EDAX intimate sample have been carbon and oxygen moreover S and Mn elements.
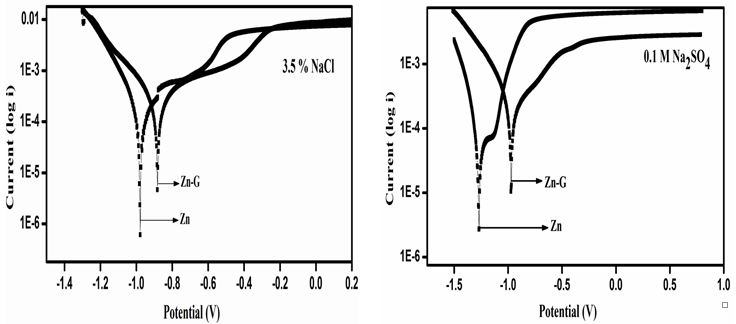
Comparative corrosion studies are carried out for both the Zn alloy and graphene coated zinc (Zn/graphene) samples in three different electrolytes namely NaCl, Na2SO4 and KCl. First, the potential is applied at -1.4V and the corrosion is initiated at magnesium anode. Further, the potential tends to move toward 0.2V with an interval of ~5mVs-1. Figure 4a shows the potentiodynamic polarization curves or tafel plots for Zn and Zn/graphene samples in 3.5% NaCl electrolyte solution. The solid line indicates the corrosion behavior of Zn and the dotted line indicates the corrosion behavior of Zn/graphene in 3.5% NaCl electrolyte solution. It is observed that corrosion potential of Zn/graphene is shifted towards more positive (anodic region) value compared to Zn. The calculated corrosion current (icorr) tabulated in Table 2 was found ~7.52 × 10⁴ Acm-2 and ~2.82 × 10⁴ Acm-2 for Zn and Zn/graphene samples, respectively. The above results assured that low corrosion rate and high electrochemical corrosion resistance was achieved by a thin layer coating of graphene over the zinc anode surface.
Figure 4b shows the corrosion curves for Zn and Zn/graphene in 0.1 M Na2SO4 electrolyte. Similar corrosion trend was observed where the solid line indicates the corrosion behavior of zinc and the dotted line indicates the corrosion behavior of Zn/graphene in 0.1 M Na2SO4 electrolyte and the observed corrosion current of Zn/graphene (~9.98 × 10⁴ Acm-2) has lower value than Zn(~7.43 × 10⁴ Acm-2).
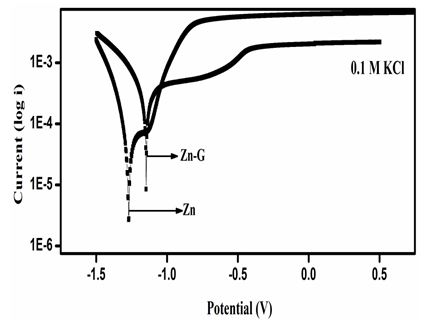
The corrosion curves for Zn and Zn/graphene sample in 0.1 M KCl electrolyte was plotted in Figure 4c. It was also obvious that the Zn/graphene sample has lower corrosion current compared to Zn alloy sample suggests improve corrosion resistance achieved due to graphene coating over Zn surface. The Tafel slope is observed to be at low potential for Zn compared to Zn/graphene which also suggests a high corrosion rate. The calculated corrosion current (icorr) of the Zn and Zn/graphene samples was determined from the extrapolated lines of the Tafel curve (see Table 2) and found ~2.96 × 10⁴ Acm-2 and ~1.84× 10⁴ Acm-2, respectively,. The above results testify that a thin layer coating of graphene over Zn surface is able to improve corrosion resistance in aqueous electrolytes. The polarization parameters measured from the potentiodynamic polarization curves or Tafel plots tabulated in Table 2 is also a testament that corrosion rate drastically drops when a thin layer coating of graphene is applied over the zinc surface. All the above studies were repeated multiple times, and found within the experimental error limits.
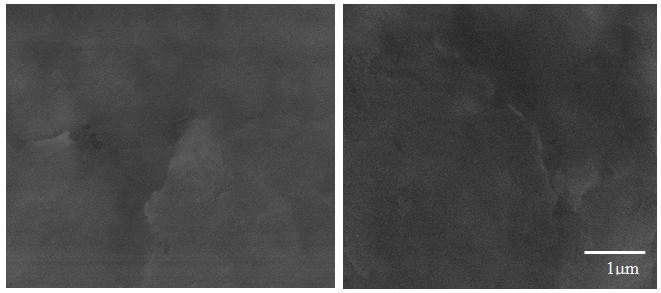
The SEM image provided additional information about the nature of the corrosion in Zn/ZnG (Figure 5). while the entire surface of the Zn metal alloy sample is damaged after exposure to positive potential in the electrolytes, in ZnG sample the surfaces degraded at isolate area, while leaving most of the sample surface undamaged (Figure 6). As graphene does not corrode on the potential window used in our experiment. We expect that these change accur at region of the Zn surface well covered by graphene. That is, high corrosion resistance have graphene coated Zn (ZnG).
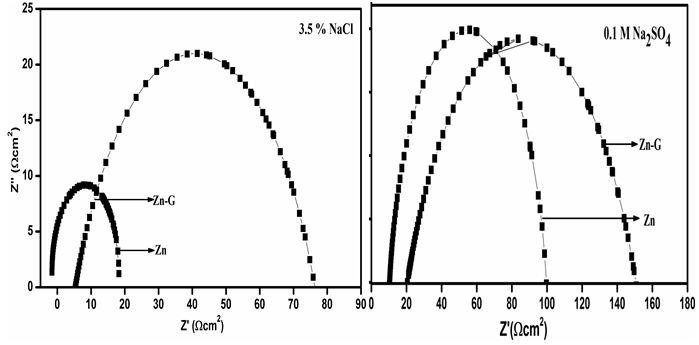
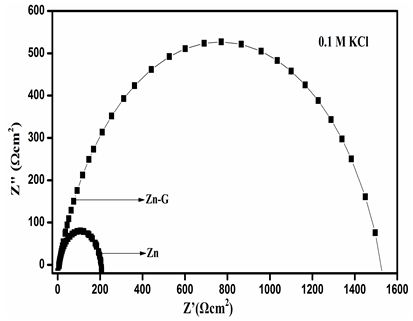
The electrochemical impedance spectroscopy was used to study the corrosion mechanism of with and without coated Zn in three different electrolytes, such as NaCl, KCl and Na2SO4. Three different electrolytes, such as NaCl, KCl and Na2SO4 is chosen since all the three of them has neutral salt behavior and are predominantly used now-a-days. Typical Nyquist plots Zn and ZnG in 3.5 % NaCl solution are shown in Figure 7a. The Nyquist plot shows that the curves for Zn and ZnG have a single capacitive loop in all frequencies [25]. Since, the corrosion rate is inversely proportional to Rct value, the higher the Rct value is, the lower the corrosion rate. Rct value is nothing but, the radius of high frequency semicircle (coupling of Rct and Cdl). It is intersection with the x-axis at low frequencies. Rct is the charge transfer resistance and it can be automatically calculated by using the command fit and simulation of equivalence circuit available in autolab (software NOVA 2.1). In other words, Rct value is the difference between Rcoat (coating resistance) and Rp (Polarization resistance). Figure 7b. The Nyquist plot shows that the curves for Zn and ZnG have a single capacitive loop in all frequencies. Since, the corrosion rate is inversely proportional to Rct value, the higher the Rct value is, the lower the corrosion rate. The Zn have less Rct (100 Ωcm2) value than graphene coated Zn (150 Ωcm2), owing to Zn have low Rct value and high corrosion rate than graphene coated on Zn in Na2SO4 electrolyte. The Nyquist plot in Figure 7c shows that the curves for Zn and ZnG in 0.1M KCl solution have a single capacitive loop in all frequencies The Nyquist plot reveals that charge-transfer resistance (Rct) of Zn in KCl, Zn have been lowest (Rct) value than ZnG. which one has higher (Rct) value and it also has higher corrosion resistance behavior. The Zn have less Rct (200Ωcm2) value than graphene coated Zn (1550Ωcm2), owing to Zn have low Rct value and high corrosion rate than graphene coated on Zn in KCl electrolyte. The Nyquist plot confirms that ZnG shows better corrosion resistance and lower corrosion rate in KCl solution compared to all other electrolytes which was performed in Zn. Comparing all the 3 electrolytes, metal halides (NaCl and KCl) have good corrosion resistance property than metal sulphates. Sulphates are more corrosive in nature and they react with Zn to form ZnS. Comparing with NaCl and KCl, both react with Zn to form ZnCl. Taking Na and K in to account, both react with graphene. But the rate of reaction is said to be less in K than Na. That’s why KCl got favourable corrosion potential.
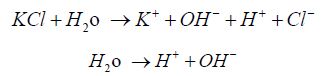
As solution contains equal number of H+ and OH- ions, aqueous solution of potassium chloride is neutral in nature. Moreover, corrosion rate was evaluated based on the thickness of the corrosion product formed during one week of exposure to each of the salt. Both NaCl and KCl show strong corrosively. But when tested with ZnG KCl shows less reaction rate and said to have more corrosion resistance.
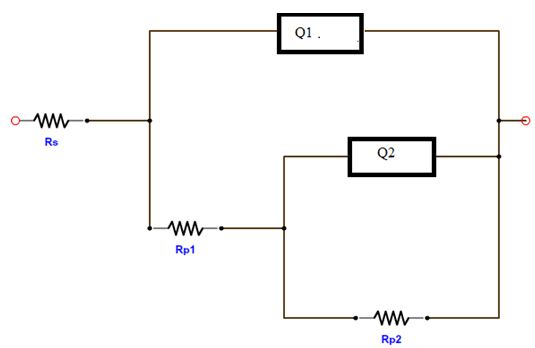
The equivalent circuit model of the impedance diagram is provided in Figure 8. Here, Rs represents the solution resistance between the alloy and counter electrode, Q1 and Q2 the constant phase element (CPEs), Rp1 the resistance of a film layer formed on the Zn alloy surface and Rp2 accounts for the polarisation resistance at the alloy surface.
In summary, thin layer graphene have been synthesized employing electrochemical method which is used to study the electrochemical properties in salt electrolytes such as NaCl, KCl and Na2SO4. The XRD have sharp and intensive peak at (2θ) 26.34° it is intimated to graphene. The observed peak at 38.35° indicates presence of zinc. Raman spectra of graphene peak corresponds to identified as D band at 1347 cm-1, G band at 1569 cm-1 and 2D band at 2702cm-1. The surface morphology of graphene sheets and Zn/ZnG was confirmed by SEM image; EADX has been confirmed the present of graphene as 90.83 %. The tafel plot reveals that the lower corrosion rate is achieved in ZnG than the Zn performed in KCl electrolytes. In addition, the Nyquist plot confirmed the ZnG exhibits better corrosion resistance in KCl electrolyte. The excellent corrosion resistance suggests that the ZnG has the potential to be used as an anode material for Zn battery system.
One of the author Mr. M. Selvam is thankful to Department of Science and Technology (DST), New Delhi, for providing the INSPIRE fellowship (IF110749) to carry out this research work.