Cytogenetic Study for the Effect of Exotoxin A in Mice Caused by Pseudomonas Aeruginosa Isolated from Mastitic Cow
Environmental Mastitis in cow commonly caused by P. aeruginosa which found everywhere in farms, water and medical equipment’s so it is zoonotic transmission. Forty-five pathogenic bacterial isolates were identified as P. aeruginosa which isolated from Eighty-two cows suffering from mastitis, five cases were diagnosed as gangrenous mastitis. Twenty-five isolates were found producing exotoxin A as detected by specific ELISA kit. Isolate PA15 was found able to produce 32.08 ng/ml of active exotoxin A (ETA) with a protein of about 0.063 mg/ml. Molecular weight of the toxin was determined to be 65,000 Dalton. Three dose of ETA (125, 250 and 500) ng/ml were given orally for seven days to experimental animals (mice) to measure the cytogenetic effects of this toxin by employing the following parameters (mitotic index (MI), micronucleus (MN), chromosomal aberrations (Cas) and sperm abnormalities) in compression with negative control PBS (phosphate buffer saline).
Keywords:P. aeruginosa; Exotoxin A; Cow; Mastitis; Mice; Chromatography
Pseudomonas aeruginosa is an opportunistic pathogen that causes extensive morbidity and mortality in animals and human who are immuno compromised or have underlying infection such as urinary tract, respiratory tract and skin infections and primarily causes of nosocomial infections, and it is frequently resistant to commonly used antibiotics and disinfectants [1,2]. P. aeruginosa was found only produce exotoxin A which released normally outside the cells [3]. Pseudomonas aeruginosa produces large numbers of extracellular toxins, which include phytotoxic factor, pigments, hydrocyanic acid, proteolytic enzymes, phospholipase, enterotoxin, exotoxin, and slime [1]. The most important factor in the pathogenicity of P. aeruginosa is the elaboration of a group of exotoxins (protein in nature). These exotoxins could cause leukopenia, acidosis, circulatory collapse, necrosis of liver, pulmonary edema, hemorrhage, and tubular necrosis of kidneys. Passive administration of antitoxic sera against these exotoxins can protect against lethal infections with P. aeruginosa in the absence of antibody against the cellular antigens [4].
Bacterial isolates were subjected to number of cultural and biochemical tests following schematic diagram for identification suggested by Collee JG, et al. [5-7].
Detection & Purification of ETA: Bacterial isolates Samples were collected according to the method suggested by Collee JG, et al. [5]. All samples were immediately streaking on MacConkey’s agar, blood agar and cetrimide agar, incubated for overnight at 37 °C under aerobic conditions for 24 hrs. followed by determination for protein concentration according to Bradford MM, et al. [8].
Detection of ETA, (9): The ability of exotoxin A production for the isolates was tested using ELISA kit. This kit standardized to detect even trace amount of exotoxin A in cultures. This kit also found to be specific only for the exotoxin A produced by Pseudomonas aeruginosa.
Precipitation of protein by ammonium sulphate, (10): The supernatant (crude extract) was fractionated with ammonium sulphate at (0, 10, 20, 30, 40, 50, 60, 70, 80, 90) % saturation. The precipitated product of 90% saturation was used to obtain complete precipitation of the toxin, and then the precipitant was separated by centrifugation at 10,000 rpm for 30 min. The precipitant was resuspended in 10 ml normal saline.
Preparation of ion exchange column (DEAE-cellulose) gel: The DEAE-Cellulose was prepared according to the method suggested by [11]. Suspended 20 gram from ion exchange resin in 1 liter distilled water, left in graduated cylinder to stagnate, after that the supernatant was removed, this step was repeated many times, until the supernatant become clear, the ion exchange resin was filtered by using Bukhner’s funnel under vacuum (without drying the ion exchange resin), then the resin was activated in 250 ml from buffer which contain 0.25M sodium hydroxide and 0.25M sodium chloride for 30 minutes, the resin was re filtered and washed under vacuum using distilled water, then the resin was suspended in 250ml hydrochloride acid 0.25M with agitation for 30 minutes, after that, the resin was washed with distilled water under vacuum, the resin was suspended in Tris-HCl buffer (1μM, pH=8.0) and the ion exchange resin was degassed by using vacuum, the resin was packaged gently in glass column (2.5×16cm), the equilibration was achieved by the same Tris-HCl buffer.
Separation through ion exchange resin (DEAE-Cellulose): Ten ml solution was loaded on ion exchange column, the separated fractions were collected at flow rate 20 ml/hour (approximately, 3ml for each fraction), the wash was obtained of by using Tris-HCl buffer (the same buffer used in equilibration), the elution was achieved by the same buffer with gradual increase in concentration of sodium chloride, the flow rate was 20 ml/ hour too, the protein concentration of the fractions was measured at wavelength 280 nm to the washed and eluted fractions, protein concentration then was calculated.
Determination of the void volume of the column: Sepharose-4B column (56×1.5 cm) was prepared and packed according to the instructions of the manufacturing company (Pharmacia Sweden). The column was equilibrated overnight with 0.02 M Tris-HCl buffer pH 8.0 with a flow rate of 50 ml/hour. A 2 ml blue dextran 2000 solution was passed through the column, and 225 ml of Tris-HCl buffer pH 8.0 was added to the column. Fractions of 5 ml were collected. The absorbency at 600 nm for each fraction was measured. The column void volume (Vo) was determined, by estimation of total volume of fractions as characterized with start point movement of the blue dextran to that of climax of absorbency of the blue dextran.
Determination of ETA elution volume (Ve): Sepharose-4B column (56 × 1.5 cm) was prepared, packed and equilibrated for a second time A 3 ml of purified exotoxin A sample was passed through the column carefully, and equilibrated with 0.02 M Tris HCl buffer pH 8.0, with a flow rate of 50 ml/hour. Fractions of 5 ml were collected. The elution volume (Ve) was estimated for the separated fractions of purified exotoxin, by following the absorbency at 280 nm.
Measurement of standard protein elution vole (Ve): Different standard proteins were applied through sepharose-4B column, and then eluted with 0.02 M Tris-HCl buffer pH 8.0, with a flow rate of 50 ml/hour, as shown in Table 1.
The elution volume was estimated for each standard protein by following the absorbency for the separated fractions at wave length 280 nm. The (ve/vo) ratio was calculated for each standard protein and for the separated fractions of purified ETA , then standardization was done, by plotting the elution volume (Ve) of each standard proteins to the void volume (Vo) of the blue dextran 2000 (Ve/Vo) versus the log value of molecular weight [12,13]. The ETA molecular weight was accordingly calculated.
Laboratory animals: Albino Swiss (20 Females & 20 males), which were obtained from the veterinary laboratory Center / Stanford University, were used. For cytogenetic study of the effect of exotoxin A. Their ages were ranged between (8-12) weeks and weighting (25-30) gm. They were divided into subgroups, and each group was put in a separate plastic cage. The cages were kept in a room temperature (23-25) °C. The animals were fed with a suitable quantity of water and complete diet.
Administration of Experimental Animals: Animals in this experiment were treated with a cumulative dose of ETA for seven. The main aim of this experiment was to evaluate the acute treatment effect of ETA in normal mice.
The LD50 of P. aeruginosa exotoxin A is 2.3 μg [14]. Four groups of mice were used in this experiment (half of them used to determine MI, CAs and the other half for MN and sperm abnormalities) treated as follows:
• Group I: Negative control (10 mice), treated with (0.1ml) of PBS.
• Group II: ETA treatment (10 mice), treated with (0.1 ml) of ETA (125 ng/ml).
• Group III: ETA treatment (10 mice), treated with (0.1ml) of ETA (250 ng/ml).
• Group IV: ETA treatment (10 mice), treated with (0.1ml) of ETA (500 ng/ml).
Chromosomal preparation from somatic cells of the mouse bone marrow: This experiment was done according to as follows [15]:
a. Each animal was injected with 0.25ml of colchicine with a concentration of (1mg/ml) intra peritoneal (I.P) 2hr before sacrificing the animal. b. The animal was sacrificed by cervical dislocation. c. Then the animal was fixed on its ventral side on the anatomy plate and the abdominal side of the animal and its thigh region were swabbed with 70% ethanol. d. The femur bone was taken and cleaned from the other tissues and muscles, then gabbed from the middle with forceps in a vertical position over the edge of the test tube, and by sterile syringe 5ml of PBS were injected so as to wash and drop the bone marrow in the test tube. e. The test tube was taken and centrifuged at speed of 2000 rpm for 10min. f. The supernatant was removed and 5ml of potassium chloride (0.075) M was added as a hypotonic solution, then the test tubes were left for 30min in the water bath at 37 °C and shacked from time to time. g. The tubes were centrifuged at 2000 rpm for 10 min. h. The supernatant was removed, and the fixative solution was added (as drops) on the inside wall of the test tube with the continuous shaking, the volume was fixed to 5ml and the content shacked well. I. The tube was kept at 4 °C for 30min to fix the cells. i. The tubes were centrifuged at 2000 rpm for 10min. The process was repeated three times and the cells were suspended in 2ml of the fixative solution. By a pasture pipette, few drops from the tube were dropped vertically on the chilled slides from a height of 3 feet at a rate of (4-5) drops to give the chance for the chromosomes to spread well. Later the slides were kept drying at room temperature. j. The slides were stained with Giemsa stain and left for 15 min, then washed with distilled water. k. Two slides per each animal were prepared for cytogenetic assays.
B- Micronucleus test in mouse bone marrow cells: This assay was adapted from that described by [16].
a. The femur bone was cleaned from tissue and muscles, then gapped from the middle with some forceps in a vertical position over the edge of a test tube, and by a sterile syringe 1ml of human serum was injected to wash and drop the bone marrow in the test tube. b. The test tube was centrifuged at 1000 rpm for 5min. c. The supernatant was removed, and a drop from the pellet was taken to make a smear on clean slides. The slides were kept at room temperature for 24hrs. d. The slides were fixed with absolute methanol for 5min, then stained with Giemsa stain for 15min, then washed with distilled water and left to dry. e. Two slides for each animal were prepared for micronucleus test.
Mitotic Index (MI) Assay: The slides were examined under the high dry power (40X) of the compound light microscope and (1000) of divided and non-divided cells were counted and the percentage rate was calculated for only the divided ones according to the following equation (17) MI= number of divided cells/total number of cells (1000) X100
Chromosomal Aberrations (CAs) Assay: The prepared slides were examined under the oil immersion lens for 100 divided cells per each animal, and the cells should be at the metaphase stage of the mitotic division, where the chromosomal aberrations are clear, and the percentage of these aberrations was estimated [15].
Micronucleus (MN) Test: The number of MN in (1000) cells of polychromatic erythrocytes (PCE) in mice was scored under the oil immersion lens, and the percentage of MN was calculated [16].
Sperm abnormality: This assay was adapted from that described by [5,17]. Animals were sacrificed after 37 days after injection. The epididymides extracted and the sperm were sampled. Both epididmides from each mouse were minced with small scissors in 4 ml PBS (Phosphate Buffer Saline), and then left at least 2 min for the spermatozoa to diffuse into the saline. Pipetted and then filter in test tube to exclude large tissue.
More than one slide were prepared for each animal by placing a drop of suspension on cleaned microscopic slide and smearing with a clean cover slip. Then the slides were air dried and the fixed in absolute alcohol for 1 min before staining in Eosin Y for 15 min.
Scoring: For scoring, in each animal about 1000 sperm were examined for morphological abnormality.
2.2.9.5 Mammary gland and nibbles of female mice: preparation smear same as sperm in vital cells all cells became inflamed, bucket filled with granulation tissue and most cell dead with gangrenous.
A one-way analysis of variance was performed to test whether group variance was significant or not. Data were expressed as mean ± standard deviation and statistical significances were calculated using ANOVA test [18].
ELISA kit was used for detection of exotoxin A produced by isolates of Pseudomonas aeruginosa. Average the duplicated reading for each standard, control, and sample and subtract the average zero standard optical density. Create a standard curve by reducing the data using computer software capable of generating a four-parameter logistic (4-PL) curve-fit. As an alternative, construct a standard curve by plotting the mean absorbance for each standard on the x-axis against the concentration on the y-axis draw a best fit curve through the points on the graph. The data may be linearized by plotting the log of the PEA concentrations versus the log of the O.D. and the best fit line can be determined by regression analysis. This procedure will produce an adequate but less precise fit of the data. If samples have been diluted, the concentration read from the standard curve must be multiplied by the dilution factor. Forty-five isolates only twenty-five were found to produce exotoxin A. The kit was also used for concentration measurement as the results indicated in Table 2. Screening of these isolates indicates that, most of the isolates show positive results. However, three isolates were selected according to their highest productivity as well as their distribution in different sites if infections, three isolates namely PA 10, PA 11 and PA 15 which produce (23.31) (19.01) (29.73) ng\ml and distributed in burn, UTI infection and wound respectively.
These results were nearly agreed with Schultz WW (1979) who found that registered concentration between 0.3 and 0.6 ng/ml at least concentration, Thompson MR (1991) found the maximum concentration detected by using ELISA approximately 0.75 μg/ml [9,19].
From previous results, it was shown that, the isolate PA15 capable of producing exotoxin A at concentration of 29.37 ng/ml which considered as basal synthesis. In order to improve synthesis, TSBD medium was amended with nitrilotriacetic acid (NTA) and then fallow productivity. Results shown in Table 3 indicate that protein concentration was found to be higher in cultures contain NTA than that of free cultures, this may be due to the ability of NTA for inhibiting protease activity and hence stop protein turnover as reported by several research articles [3,20].
Number of purification steps was followed in order to obtain pure exotoxin A. These steps were reduced to minimum as long as the quantity of toxin is low and could be lost during purification. These steps are:
Precipitation of proteins by ammonium sulphate: In order to concentrate the crude extract of toxin and remove as much as possible water, ammonium sulphate was used at (10, 20, 30, 40, 50, 60, 70, 80, 90) % saturation, the saturation ratio of 90% was chosen to precipitate exotoxin A. This step allows the salting out of molecules from water. Since ammonium sulphate has the ability to neutralize charges at the surface of the protein and to disrupt water layer surrounding the protein, it will eventually cause a decrease in the solubility of protein which, in turn lead to the precipitation of the protein by the effect of salt [20,21]. Ammonium sulphate is widely used because of availability of ammonium sulphate, high solubility, low cost and it stabilizes the protein [22].
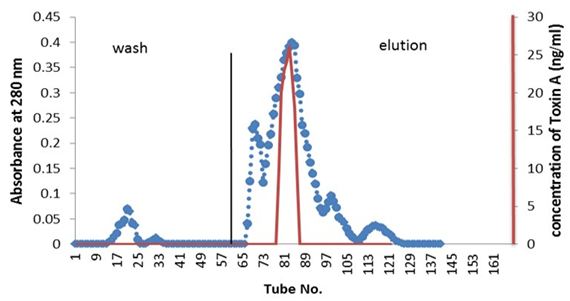
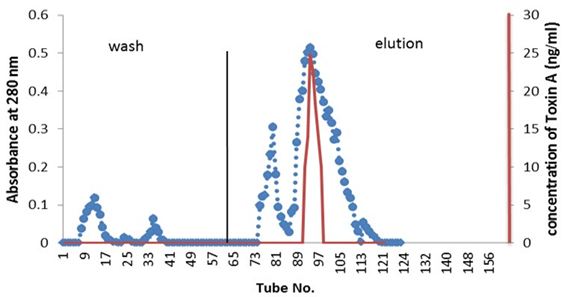
Partial purified of exotoxin A by ion-exchange chromatography: Purification of exotoxin A was done by ion-exchange chromatography using (DEAE-cellulose). Figure 1 showed the wash and elution of DEAE-cellulose column for three isolates. No exotoxin A was detected in the wash steps, while the eluted fractions revealed. Results indicate the presence of three peaks. However, only one peak for each elution of three isolates shows activity as detected by ELISA kit. The amounts of partial purified proteins shown in Table 3 indicate as much as 0.063, 0.044 and 0.051 mg/ml of protein produced by isolates PA15, PA11 and PA10 respectively A, B and C.
Detection of exotoxin in fractions eluted from ion-exchange chromatography was done using ELISA kit; the results shown in Table 4 indicate the presence of only one peak in the elution steps of the three isolates giving positive result, as measured by spectrometrically at 450 nm wavelength. The results indicate that, isolate PA.15 is the highest producer for exotoxin A.
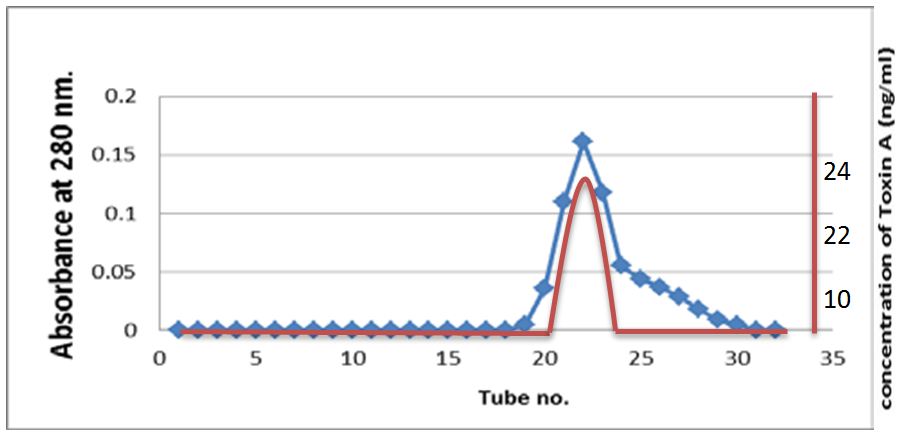
The sample passed through Sepharose-4B then fractionated on the gel, fractions were collected up to 30 fractions. Exotoxin A was present in fractions 21-23 depending on using acetic acid assay and increase absorbency of fractions. The result of purification showed the presence of one-peak as indicated in Figure 2.
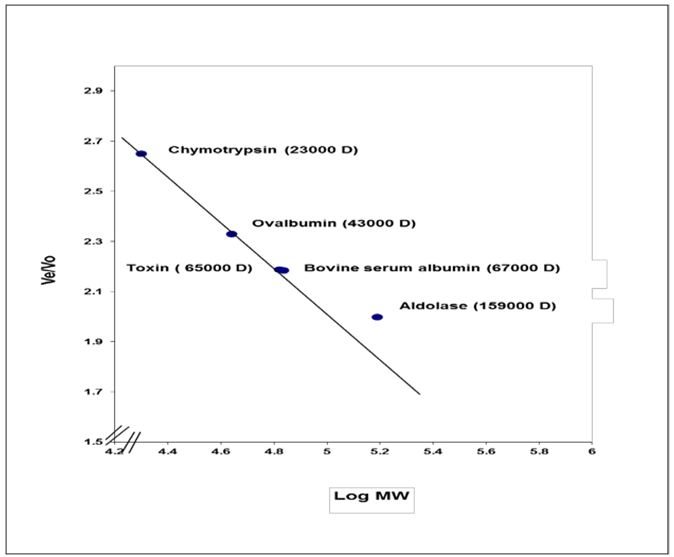
Molecular weight of exotoxin A was determined using Sepharose4B column (56×1.5 cm). The void volume (Vo) of the column was calculated by estimating the void volume of blue dextran 2000 to the elution volume (Ve) for each one of standard proteins and for the separated fractions of purified exotoxin. The ratio of the elution volume of each standard protein as well as the separated fractions of the purified exotoxin, to that of void volume of the blue dextran 2000 was calculated. Results in Table 5 show that the (Ve/Vo) ratio of purified exotoxin was about (65000 D), the ratio of (Ve/Vo) of each standard protein to the log molecular weight of each standard protein was plotted. The ratio of (Ve/Vo) of each standard protein to the log molecular weight of each standard protein was plotted.
Results shown in Figure 3. indicate that molecular weight of purified exotoxin was estimated as 65000 Dalton, which near molecular weight of bovine serum albumin as about 67000 Dalton. These results agree more or less with the results described by Hamood AN, et al. who determine the molecular weight of exotoxin A as about 68000 Da. Shiraishi Y, et al. determined molecular weight of exotoxin A as about 66,583 Da [23,24].
ETA effect on mitotic index (MI): The treatment effect of three doses of ETA of isolate (PA15) in addition to PBS (as a negative control) on mitotic index of mouse bone marrow cells was examined. Results shown in Table 6 indicate that a significant decrease in MI (P<0.005) for the all three doses of ETA in the order (35.05%, 26.86% and 19.82%) after seven days of treatment at doses of (125, 250 and 500 μl/kg) respectively as compared with negative control (43.08%).
Attributed to MN minimization of MI occurred because of many factors, mainly could be reduction in protein concentration that is important for mitosis or death of bone marrow cells as long as ETA toxin inhibit protein synthesis in cell. Or could be because of synthesis of the mitotic spindles which is organized during cell division or during mitosis, these spindles composed of number of microtubules which is responsible on capture and alignment of chromosomes in metaphase and subsequent separation to the two daughter cells at anaphase [24]. Although the mechanism of mitotic arrest by microtubule-targeted antimitotic agents is poorly understood, it is believed to be a result of suppression of microtubule dynamics, which prevents chromosome alignment at the metaphase plate, resulting in a sustained block at or before the metaphase-anaphase transition [17,25].
Many bacterial toxins were shown to cause reduction in MI such as C. botulinum C2 toxin ADP-ribosylates that inhibit MI, Cells treated with C2 toxin did not recover and did not start to proliferate again [26]. At the same time, MI was shown to be increase after treatment with other kinds of agents, such as antioxidants (e.g., vitamin C which is the active constituent of many plants), they act by inducing cell division by acting as mitogens [27, 28]. P. aeruginosa ETA was not shown to have antioxidant activity, but in fact, it was shown to act as many as bacterial toxin in decreasing MI, but the mechanism still unknown.
Results shown in Table 7 indicate the effect of three doses of ETA (125, 250 and 500 μl/kg) on MN reduction. A percentage of (1.74%, 1.92% and 2.46%) obtained for the three doses respectively as compared with PBS as a negative control (0.54%), and Table 7 indicate the micronucleated cell in bone marrow of mice per cell after treatment with three doses of ETA. These indicate a significant increase in MN percentage was recorded for the three doses. Micronuclei may be originated from acentric chromosome fragments, either from the double stranded DNA damage before cell division or after breakage of anaphase bridges [29].
Although, there are agents that cause increased MN frequency, at the same time several plant extracts was also found cause decreased MN frequency. Several plants were shown to contain active constituents such as rutin and quercetin which protect DNA from damage by their antimutagenic and detoxification activities [30,31].
Some chemicals could increase MN frequency such fluoride due to its mutagenic effects, and could give rise to DNA damage [32].
The examination of chromosomal aberrations is important for studying the effect of ETA in mouse. In this study, types of chromosomal aberrations which have been observed were; ring, gap, acentric, dicentric, chromosome break, chromatid break and deletion. Three different doses of ETA was found cause significant differences (P<0.05) in total and in all types of CAs frequency in comparison to the negative control. Results of Table 7 revealed that treatment with different doses of ETA had increased spontaneous CAs percentage (0.615, 0.926 and 1.318%) at doses of (124, 250 and 500μg/Kg) respectively as compared with negative control.
Although, who suggested that endo/exotoxin released by Mycobacterium tuberculosis act as chemical mutagens in generating CA in affected individual [33]. Other similar infections caused by Mycobacterium Lepra and number of viruses, including A and B hepatitis (Chatterjee and Ghosh, 1989) were demonstrated to cause different CAs in human lymphocytes [34].
These abnormalities may involve the autosomes, sex chromosomes, or both. The disruption of the DNA sequence could alter the genes carried on the affected chromosomes results in a mutation. Such a change may alter the protein coded by a gene. Often, however, a mutation could also result in disruption of gene functionality, which result in altered or missing proteins for metabolism which cause genetic diseases. Only mutations occurring to the DNA in the gametes will potentially pass on to the offspring. An elevated frequency of structural chromosome aberrations could be directly caused by an abnormally high incidence of DNA double-strand breaks. Chromosomal breakage can result in several different structural rearrangements, some of which give rise to abnormalities of chromosomal segregation at mitosis. For example, terminal deletions due to a break of a single chromatid will result in a centric derivate chromosome plus an acentric fragment. Because of its failure to bind the mitotic spindle, the fragment may be permanently lost in the subsequent cell division and may be seen body at metaphase or anaphase [35]. However, although P. aeruginosa ETA was shown to cause different CAs, but also the mechanism still unknown.
ETA effect on sperm normality’s: It is known that the abnormality that occur in germ cells transfer by the movement to subsequent generations and thus constitute one of the most important genetic risk due to carcinogenic effect while the distortions that occur in somatic cells may cause a risk to the individual himself [36].
The results in Table 7 indicating that, the abnormality in the sperm was increase as the dose of ETA increase and this incensement is significant when compared with negative control after seven days of mice treatment.
Sperm abnormality includes: amorphous head, banana head, two head, head without hook, divided tail, coiled tail and others abnormalities. It was noted that the abnormality in divided tail more than other abnormality because of toxin effect on protein concentration in tail which made of protein in most contents.
Another bacteria product decrease sperm head abnormalities like Lactobacillus acidophilus [37]. Also, some chemicals caused decreases in sperm head abnormality like dimethoxyethyl phthalate, epichlorohydrin and formaldehyde [38].
Pseudomonas aeruginosa was found able to produce significant amount of exotoxin A in growth medium. Productivity of exotoxin A was enhanced by using NTA in growth medium, and reduced in isolates producing proteases. Inhibitors were effecting in protecting the toxin from degradation. The molecular weight of purified ETA was found to be 65,000 Dalton. Numbers of cytogenetic effects in mice caused by ETA were detected depending on changes such as (MI, MN, CAs and sperm abnormalities). My Recommendations Further research is needed concerning the use of this toxin for vaccination against P. aeruginosa. Genetic studies include localization of structural and regulatory genes related to exotoxin a synthesis. Genetic engineering used to more production of exotoxin A of P. aeruginosa by cloning.