Demand for Clean Energies Efficient Development in Buildings Technologies
Aims/Purpose:The increased availability of reliable and efficient energy services stimulates new development alternatives. This article discusses the potential for such integrated systems in the stationary and portable power market in response to the critical need for a cleaner energy technology. Throughout the theme several issues relating to renewable energies, environment, and sustainable development are examined from both current and future perspectives. It is concluded that green energies like wind, solar, groundsource heat pumps, and biomass must be promoted, implemented, and demonstrated from the economic and/or environmental point view. Biogas from biomass appears to have potential as an alternative energy source, which is potentially rich in biomass resources. This is an overview of some salient points and perspectives of biogas technology. The current literature is reviewed regarding the ecological, social, cultural and economic impacts of biogas technology. This article gives an overview of present and future use of biomass as an industrial feedstock for production of fuels, chemicals and other materials. However, to be truly competitive in an open market situation, higher value products are required. Results suggest that biogas technology must be encouraged, promoted, invested, implemented, and demonstrated, but especially in remote rural areas.
Study design: Anticipated patterns of future energy use and consequent environmental impacts (acid precipitation, ozone depletion and the greenhouse effect or global warming) are comprehensively discussed in this article.
Place and Duration of Study:National Centre for Research, Energy Research Institute (ERI), between January 2016 and July 2017.
Methodology/Approach:An approach is needed to integrate renewable energies in a way to meet high building performance. However, because renewable energy sources are stochastic and geographically diffuse their ability to match demand is determined by adoption of one of the following two approaches: the utilisation of a capture area greater than that occupied by the community to be supplied, or the reduction of the community’s energy demands to a level commensurate with the locally available renewable resources.
Results/Findings:The adoption of green or sustainable approaches to the way in which society is run is seen as an important strategy in finding a solution to the energy problem. The key factors to reducing and controlling CO2, which is the major contributor to global warming, are the use of alternative approaches to energy generation and the exploration of how these alternatives are used today and may be used in the future as green energy sources.
Keywords: Renewable Energy; Built Environment; Sustainable Development
Originality/ValueThis study highlights the energy problem and the possible saving that can be achieved through the use of renewable energy technologies. Also, this study clarifies the background of the study, highlights the potential energy saving that could be achieved through use of renewable energy technologies and describes the objectives, approach and scope of the study. The move towards a de-carbonised world, driven partly by climate science and partly by the business opportunities it offers, will need the promotion of environmentally friendly alternatives, if an acceptable stabilisation level of atmospheric carbon dioxide is to be achieved. This requires the harnessing and use of natural resources that produce no air pollution or greenhouse gases and provides comfortable coexistence of human, livestock, and plants. The increased availability of reliable and efficient energy services stimulates new development alternatives. We present and focus a comprehensive review of energy sources, and the development of sustainable technologies to explore these energy sources. We conclude that using renewable energy technologies, efficient energy systems, energy savings techniques and other mitigation measures necessary to reduce climate changes.
Over millions of years ago, plants have covered the earth converting the energy of sunlight into living plants and animals, some of which was buried in the depths of the earth to produce deposits of coal, oil and natural gas [1-3]. The past few decades, however, have experienced many valuable uses for these complex chemical substances and manufacturing from them plastics, textiles, fertiliser and the various end products of the petrochemical industry. Indeed, each decade sees increasing uses for these products. Coal, oil and gas, which will certainly be of great value to future generations, as they are to ours, are however non-renewable natural resources. The rapid depletion of these non-renewable fossil resources need not continue [4]. This is particularly true now as it is, or soon will be, technically and economically feasible to supply all of man’s needs from the most abundant energy source of all, the sun. The sunlight is not only inexhaustible, but, moreover, it is the only energy source, which is completely non-polluting [5].
Industry’s use of fossil fuels has been largely blamed for warming the climate. When coal, gas and oil are burnt, they release harmful gases, which trap heat in the atmosphere and cause global warming. However, there had been an ongoing debate on this subject, as scientists have struggled to distinguish between changes, which are human induced, and those, which could be put down to natural climate variability. Notably, human activities that emit carbon dioxide (CO2), the most significant contributor to potential climate change, occur primarily from fossil fuel production. Consequently, efforts to control CO2 emissions could have serious, negative consequences for economic growth, employment, investment, trade and the standard of living of individuals everywhere [5].
The energy conservation scenarios include rational use of energy policies in all economy sectors and use of combined heat and power systems, which are able to add to energy savings from the autonomous power plants. Electricity from renewable energy sources is by definition the environmental green product. Hence, a renewable energy certificate system is an essential basis for all policy systems, independent of the renewable energy support scheme. It is, therefore, important that all parties involved support the renewable energy certificate system in place. Existing renewable energy technologies (RETs) could play a significant mitigating role, but the economic and political climate will have to change first. Climate change is real. It is happening now, and GHGs produced by human activities are significantly contributing to it. The predicted global temperature increase of between 1.5 and 4.5 ºC could lead to potentially catastrophic environmental impacts. These include sea level rise, increased frequency of extreme weather events, floods, droughts, disease migration from various places and possible stalling of the Gulf Stream. This has led scientists to argue that climate change issues are not ones that politicians can afford to ignore, and policy makers tend to agree [6]. However, reaching international agreements on climate change policies is no trivial task.
Renewable energy is the term used to describe a wide range of naturally occurring, replenishing energy sources. The use of renewable energy sources and the rational use of energy are the fundamental inputs for any responsible energy policy. The energy sector is encountering difficulties because increased production and consumption levels entail higher levels of pollution and eventually climate change, with possibly disastrous consequences. Moreover, it is important to secure energy at an acceptable cost in order to avoid negative impacts on economic growth. On the technological side, renewables have an obvious role to play. In general, there is no problem in terms of the technical potential of renewables to deliver energy. Moreover, there are very good opportunities for RETs to play an important role in reducing emissions of GHGs into the atmosphere, certainly far more than have been exploited so far. However, there are still some technical issues to address in order to cope with the intermittency of some renewables, particularly wind and solar. Yet, the biggest problem with relying on renewables to deliver the necessary cuts in GHG emissions is more to do with politics and policy issues than with technical ones [6]. The single most important step governments could take to promote and increase the use of renewables is to improve access for renewables to the energy market. This access to the market would need to be under favourable conditions and, possibly, under favourable economic rates as well. One move that could help, or at least justify, better market access would be to acknowledge that there are environmental costs associated with other energy supply options and that these costs are not currently internalised within the market price of electricity or fuels. This could make a significant difference, particularly if appropriate subsidies were applied to renewable energy in recognition of the environmental benefits it offers. Similarly, cutting energy consumption through end-use efficiency is absolutely essential. This suggests that issues of end-use consumption of energy will have to come into the discussion in the foreseeable future.
An approach is needed to integrate renewable energies in a way to meet high building performance. However, because renewable energy sources are stochastic and geographically diffuse their ability to match demand is determined by adoption of one of the following two approaches: the utilisation of a capture area greater than that occupied by the community to be supplied, or the reduction of the community’s energy demands to a level commensurate with the locally available renewable resources.
District Heating (DH), also known as community heating can be a key factor to achieve energy savings, reduce CO2 emissions and at the same time provide consumers with a high quality heat supply at a competitive price. Generally, DH should only be considered for areas where the heat density is sufficiently high to make DH economical. In countries like Denmark for example, DH may today be economical even to new developments with lower density areas, due to the high level of taxation on oil and gas fuels combined with the efficient production of DH [7].
Most of the heat used for DH can be produced by large CHP plants (gas-fired combined cycle plants using natural gas, biomass,waste or biogas). DH is energy efficient because of the way the heat is produced and the required temperature level is an important factor. Buildings can be heated to a temperature of 21 ºC and domestic hot water (DHW) can be supplied at a temperature of 55 ºC using energy sources other than DH that are most efficient when producing low temperature levels (<95 ºC) for the DH [5]. Most of these heat sources are CO2 neutral or emit low levels. However, only a few of these sources are available to small individual systems at a reasonable cost, whereas DH schemes because of the plant’s size and location can have access to most of the heat sources and at a low cost. Low temperature DH, with return temperatures of around 30-40 ºC can utilise the following heat sources:
• Efficient use of CHP by extracting heat at low calorific value (CV).
• Efficient use of biomass or gas boilers by condensing heat in economisers.
• Efficient utilisation of geothermal energy.
• Direct utilisation of excess low temperature heat from industrial processes.
• Efficient use of large-scale solar heating plants.
Heat tariffs may include a number of components such as: a connection charge, a fixed charge and a variable energy charge. Also, consumers may be incentivised to lower the return temperature [8]. Hence, it is difficult to generalise but the heat practice for any DH company, no matter what the ownership structure is, can be highlighted as follows:
• To develop and maintain a development plan for the connection of new consumers.
• To evaluate the options for least cost production of heat.
• To implement the most competitive solutions by signing agreements with other companies or by implementing own investment projects.
• To monitor all internal costs and with the help of benchmarking, improve the efficiency of the company.
• To maintain a good relationship with the consumer and deliver heat supply services at a sufficient quality.
Also, installing DH should be pursued to meet the objectives for improving the environment through the improvement of energy efficiency in the heating sector [9]. At the same time DH can serve the consumer with a reasonable quality of heat at the lowest possible cost. The variety of possible solutions combined with the collaboration between individual companies, the district heating association, the suppliers and consultants can, as it has been in Denmark, be the way forward for developing DH in the United Kingdom. The modernisation of the system components and their power ranges which allow easy expandability of the supply structure, the standardisation of interfaces and the hybridisation by integration of different energy converters in order to increase the power availability, represent the most important measures from the point of view of system technology [10].
Platinum is a catalyst for fuel cells and hydrogen-fuelled cars presently use about two ounces of the metal. There is currently no practicable alternative. Reserves are in South Africa (70%), and Russia (22%). Although there are sufficient accessible reserves in South Africa to increase supply by up to 5% per year for the next 50 years, there are significant environmental impacts associated with its mining and refining, such as groundwater pollution and atmospheric emissions of sulphur dioxide ammonia, chlorine and hydrogen chloride. The carbon cost of platinum use equates to 360 kg for a current fuel cell car, or 36 kg for a future car, with the target platinum loading of 0.2 oz, which is negligible compared to the CO2 currently emitted by vehicles (UNFCCC, 2009) [5]. Furthermore, Platinum is almost completely recyclable. At current prices and loading, platinum would cost 3% of the total cost of a fuel cell engine. Also, the likely resource costs of hydrogen as a transport fuel are apparently cheapest if it is reformed from natural gas with pipeline distribution, with or without carbon sequestration. However, this is not as sustainable as using renewable energy sources. Substituting hydrogen for fossils fuels will have a positive environmental impact in reducing both photochemical smog and climate change. There could also be an adverse impact on the ozone layer but this is likely to be small, though potentially more significant if hydrogen was to be used as aviation fuel [11].
Hydrogen is now beginning to be accepted as a useful form for storing energy for reuse on, or for export off, the grid. Clean electrical power harvested from wind and wave power projects can be used to produce hydrogen by electrolysis of water. Electrolysers split water molecules into its constituent parts: hydrogen and oxygen. These are collected as gases; hydrogen at the cathode and oxygen at the anode. The process is quite simple. Direct current is applied to the electrodes to initiate the electrolysis process. Production of hydrogen is an elegant environmental solution. Hydrogen is the most abundant element on the planet, it cannot be destroyed (unlike hydrocarbons) it simply changes state (water to hydrogen and back to water) during consumption. There is no CO or CO2 generation in its production and consumption and, depending upon methods of consumption, even the production of oxides of nitrogen can be avoided too. However, the transition will be very messy, and will take many technological paths to convert fossil fuels and methanol to hydrogen, building hybrid engines and so on. Nevertheless, the future of hydrogen fuel cells is promising. Hydrogen can be used in internal combustion engines, fuel cells, turbines, cookers gas boilers, road-side emergency lighting, traffic lights or signalling where noise and pollution can be a considerable nuisance, but where traffic and pedestrian safety cannot be compromised. Measures to maximise the use of high-efficiency generation plants and on-site renewable energy resources are important for raising the overall level of energy efficiency [12].
Hydrogen is already produced in huge volumes and used in a variety of industries. Current worldwide production is around 500 billion Nm3 per year [13]. Most of the hydrogen produced today is consumed on-site, such as at oil refineries, at a cost of around $0.70/kg and is not sold on the market [13]. When hydrogen is sold on the market, the cost of liquefying the hydrogen and transporting it to the user adds considerably to the production cost. The energy required to produce hydrogen via electrolysis (assuming 1.23 V) is about 33 kWh/kg. For 1 mole (2 g) of hydrogen the energy is about 0.066 kWh/mole [13]. The achieved efficiencies are over 80% and on this basis electrolytic hydrogen can be regarded as a storable form of electricity. Hydrogen can be stored in a variety of forms:
• Cryogenic; this has the highest gravimetric energy density.
• High-pressure cylinders; pressures of 10,000 psi are quite normal.
• Metal hydride absorbs hydrogen, providing a very low pressure and extremely safe mechanism, but is heavy and more expensive
than cylinders, and
• Chemical carriers offer an alternative, with anhydrous ammonia offering similar gravimetric and volumetric energy densities to
ethanol and methanol.
One of the negative results of growing prosperity worldwide has been an increase in waste generation from year to year. In response, policy-makers and researchers are examining how best to decouple waste growth and economic growth [14].
Hydropower has a valuable role as a clean and renewable source of energy in meeting a variety of vital human needs. The recognition of the role of hydropower as one of the renewable and clean energy sources and that its potential should be realised in an environmentally sustainable and socially acceptable manner. Water is a basic requirement for survival: for drinking, for food, energy production and for good health. As water is a commodity, which is finite and cannot be created, and in view of the increasing requirements as the world population grows, there is no alternative but to store water for use when it is needed. However, the major challenges are to feed the increasing world population, to improve the standards of living in rural areas and to develop and manage land and water in a sustainable way. Hydropower plants are classified by their rated capacity into one of four regimes: micro (<50kW), mini (50-500 kW), small (500 kW-5 MW), and large (>5 MW) [15].
The total world installed hydro capacity today is around 1000 GW and a lot more are currently planned, principally in developing countries in Asia, Africa and South America as shown in Table 1, which is reproduced from (Bos, My, Vu, and Bulatao, 1994) [15]. However, the present production of hydroelectricity is only about 18 per cent of the technically feasible potential (and 32 per cent of the economically feasible potential); there is no doubt that a large amount of hydropower development lies a head [15].
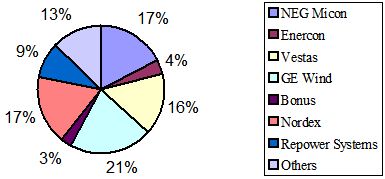
Water is the most natural commodity for the existence of life in the remote desert areas. However, as a condition for settling and growing, the supply of energy is the close second priority. The high cost and the difficulties of mains power line extensions, especially to a low populated region can focus attention on the utilisation of different and more reliable and independent sources of energy like renewable wind energy [16]. Accordingly, the utilisation of wind energy, as a form of energy, is becoming increasingly attractive and is being widely used for the substitution of oil-produced energy, and eventually to minimise atmospheric degradation, particularly in remote areas. Indeed, utilisation of renewables, such as wind energy, has gained considerable momentum since the oil crises of the 1970s. Wind energy, though site-dependent, is non-depleting, non-polluting, and a potential option of the alternative energy source. Wind power could supply 12% of global electricity demand by 2020, according to a report by the European Wind Energy Association and Greenpeace [15,17].
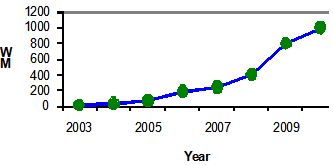
Wind energy can and will constitute a significant energy resource when converted into a usable form. As Figure 1 illustrates, information sharing is a four-stage process and effective collaboration must also provide ways in which the other three stages of the ‘renewable’ cycle: gather, convert and utilise, can be integrated. Efficiency in the renewable energy sector translates into lower gathering, conversion and utilisation (electricity) costs. A great level of installed capacity has already been achieved. Figure 2 clearly shows that the offshore wind sector is developing fast, and this indicates that wind is becoming a major factor in electricity supply with a range of significant technical, commercial and financial hurdles to be overcome. The offshore wind industry has the potential for a very bright future and to emerge as a new industrial sector, as Figure 3 implies. The speed of turbine development is such that more powerful models would supersede the original specification turbines in the time from concept to turbine order [18]. Levels of activities are growing at a phenomenal rate (Figure 4), new prospects developing, new players entering, existing players growing in experience; technology evolving and, quite significantly, politics appear to support the sector.
Sustainability is defined as the extent to which progress and development should meet the need of the present without compromising the ability of the future generations to meet their own needs [17]. This encompasses a variety of levels and scales ranging from economic development and agriculture, to the management of human settlements and building practices [19]. Tables indicate the relationship between energy conservation, sustainable development and environment (2,3 and 4).
The following issues were addressed during the Rio Earth Summit in 1992:
• The use of local materials and indigenous building sources.
• Incentive to promote the continuation of traditional techniques, with regional resources and self-help strategies.
• Regulation of energy-efficient design principles.
• International information exchange on all aspects of construction related to the environment, among architects and contractors,
particularly non-conventional resources.
• Exploration of methods to encourage and facilitate the recycling and reuse of building materials, especially those requiring
intensive energy use during manufacturing, and the use of clean technologies.
And, the following action areas for producers were recommended:
• Management and measurement tools - adopting environmental management systems appropriate for the business.
• Performance assessment tools - making use of benchmarking to identify scope for impact reduction and greater eco-
efficiency in all aspects of the business.
• Best practice tools - making use of free help and advice from government best practice programmes (energy efficiency,
environmental technology, resource savings).
• Innovation and ecodesign - rethinking the delivery of ‘value added’ by the business, so that impact reduction and resource
efficiency are firmly built in at the design stage.
• Cleaner, leaner production processes - pursuing improvements and savings in waste minimisation, energy and water
consumption, transport and distribution, as well as reduced emissions.
• Supply chain management - specifying more demanding standards of sustainability from ‘upstream’ suppliers, while
supporting smaller firms to meet those higher standards [20].
• Product stewardship - taking the broadest view of ‘producer responsibility’ and working to reduce all the ‘downstream’
effects of products after they have been sold on to customers.
• Openness and transparency - publicly reporting on environmental performance against meaningful targets; actively using clear
labels and declarations so that customers are fully informed; building stakeholder confidence by communicating sustainability
aims to the workforce, the shareholders and the local community (Figure 5).
This is the step in a long journey to encourage progressive economy, which continues to provide people with high living standards, but at the same time helps reduce pollution, waste mountains, other environmental degradation, and environmental rationale for future policy-making and intervention to improve market mechanisms. This vision will be accomplished by:
• ‘Decoupling’ economic growth and environmental degradation. The basket of indicators illustrated in Table 5 shows the progress
being made. Decoupling air and water pollution from growth, making good headway with CO2 emissions from energy, and
transport. The environmental impact of our own individual behaviour is more closely linked to consumption expenditure than
the economy as a whole.
• Focusing policy on the most important environmental impacts associated with the use of particular resources, rather than on the
total level of all resource use.
• Increasing the productivity of material and energy use that are economically efficient by encouraging patterns of supply and
demand, which are more efficient in the use of natural resources. The aim is to promote innovation and competitiveness.
Investment in areas like energy efficiency, water efficiency and waste minimisation.
• Encouraging and enabling active and informed individual and corporate consumers.
Humans and wildlife are being contaminated by a host of commonly used chemicals in food packaging and furniture, according to the World Wildlife Federation (WWF) and European Union [21]. Currently, the chemical industry has been under no obligation to make the information public. However, the new proposed rules would change this. Future dangers will only be averted if the effects of chemicals are exposed and then the dangerous ones are never used. Indeed, chemicals used for jacket waterproofing, food packaging and non-stick coatings have been found in dolphins, whales, cormorants, seals, sea eagles and polar bears from the Mediterranean to the Baltic. The European Commission has adopted an ambitious action plan to improve the development and wider use of environmental technologies such as recycling systems for wastewater in industrial processes, energy-saving car engines and soil remediation techniques, using hydrogen and fuel cells used [22]. The legislation, which has not been implemented in time, concerns the incineration of waste, air quality limit, values for benzene and carbon monoxide, national emission ceilings for sulphur dioxide, nitrogen oxides, volatile organic compounds and ammonia and large combustion plants.
Improving access for rural and urban low-income areas in developing countries through energy efficiency and renewable energies is important. Sustainable energy is a prerequisite for development. Energy-based living standards in developing countries, however, are clearly below standards in developed countries. Low levels of access to affordable and environmentally sound energy in both rural and urban low-income areas are therefore a predominant issue in developing countries. In recent years many programmes for development aid or technical assistance have been focusing on improving access to sustainable energy, many of them with impressive results. Apart from success stories, however, experience also shows that positive appraisals of many projects evaporate after completion and vanishing of the implementation expert team. Altogether, the diffusion of sustainable technologies such as energy efficiency and renewable energies for cooking, heating, lighting, electrical appliances and building insulation in developing countries has been slow. Energy efficiency and renewable energy programmes could be more sustainable and pilot studies more effective and pulse releasing if the entire policy and implementation process was considered and redesigned from the outset. New financing and implementation processes are needed which allow reallocating financial resources and thus enabling countries themselves to achieve a sustainable energy infrastructure. The links between the energy policy framework, financing and implementation of renewable energy and energy efficiency projects have to be strengthened and capacity building efforts are required [23].
Waste is defined as an unwanted material that is being discarded. Waste includes items being taken for further use, recycling or reclamation. Waste produced at household, commercial and industrial premises are control waste and come under the waste regulations. Waste Incineration Directive (WID) emissions limit values will favour efficient, inherently cleaner technologies that do not rely heavily on abatement. For existing plant, the requirements are likely to lead to improved control of:
• NOx emissions, by the adoption of infurnace combustion control and abatement techniques.
• Acid gases, by the adoption of abatement techniques and optimisation of their control.
• Particulate control techniques, and their optimisation, e.g., of bag filters and electrostatic precipitators.
The waste and resources action programme has been working hard to reduce demand for virgin aggregates and market uptake of
recycled and secondary alternatives. The programme targets are:
• To deliver training and information on the role of recycling and secondary aggregates in sustainable construction for influences
in the supply chain, and
• To develop a promotional programme to highlight the new information on websites.
This results in the following requirements:
• Relevant climate variables should be generated (solar radiation: global, diffuse, direct solar direction, temperature, humidity,
wind speed and direction) according to the statistics of the real climate.
• The average behaviour should be in accordance with the real climate.
• Extremes should occur in the generated series in the way it will happen in a real warm period. This means that the generated
series should be long enough to capture these extremes, and series based on average values from nearby stations.
On some climate change issues (such as global warming), there is no disagreement among the scientists. The greenhouse effect is unquestionably real; it is essential for life on earth. Water vapour is the most important GHG; followed by carbon dioxide (CO2). Without a natural greenhouse effect, scientists estimate that the earth’s average temperature would be –18 ºC instead of its present 14 ºC [24]. There is also no scientific debate over the fact that human activity has increased the concentration of the GHGs in the atmosphere (especially CO2 from combustion of coal, oil and gas). The greenhouse effect is also being amplified by increased concentrations of other gases, such as methane, nitrous oxide, and CFCs as a result of human emissions. Most scientists predict that rising global temperatures will raise the sea level and increase the frequency of intense rain or snowstorms [25]. Climate change scenarios sources of uncertainty, and factors influencing the future climate are:
• The future emission rates of the GHGs (Table 6).
• The effect of this increase in concentration on the energy balance of the atmosphere.
• The effect of these emissions on GHGs concentrations in the atmosphere, and
• The effect of this change in energy balance on global and regional climate.
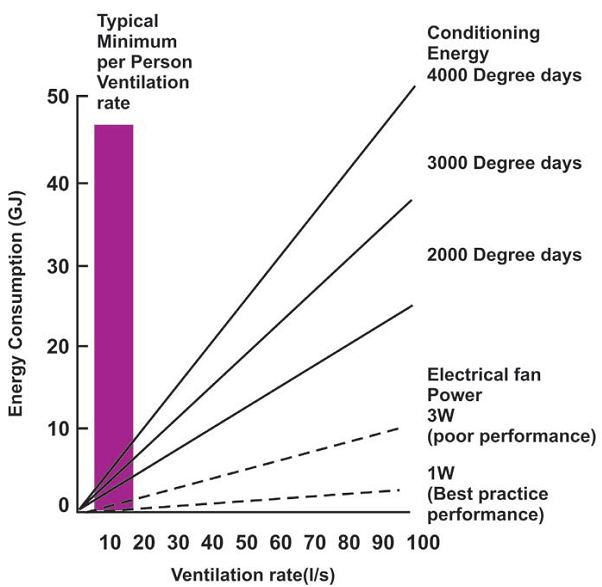
It has been known for a long time that urban centres have mean temperatures higher than their less developed surroundings. The urban heat increases the average and peak air temperatures, which in turn affect the demand for heating and cooling. Higher temperatures can be beneficial in the heating season, lowering fuel use, but they exacerbate the energy demand for cooling in the summer times. Neither heating nor cooling may dominate the fuel use in a building in temperate climates, and the balance of the effect of the heat is less. As the provision of cooling is expensive with higher environmental cost, ways of using innovative alternative systems, like the mop fan will be appreciated. The solar gains would affect energy consumption. Therefore, lower or higher percentages of glazing, or shading devices might affect the balance between annual heating and cooling loads. In addition to conditioning energy, the fan energy needed to provide mechanical ventilation can make a significant further contribution to energy demand. Much depends on the efficiency of design, both in relation to the performance of fans themselves and to the resistance to flow arising from the associated ductwork. Figure 6 illustrates the typical fan and thermal conditioning needs for a variety of ventilation rates and climate conditions [27].
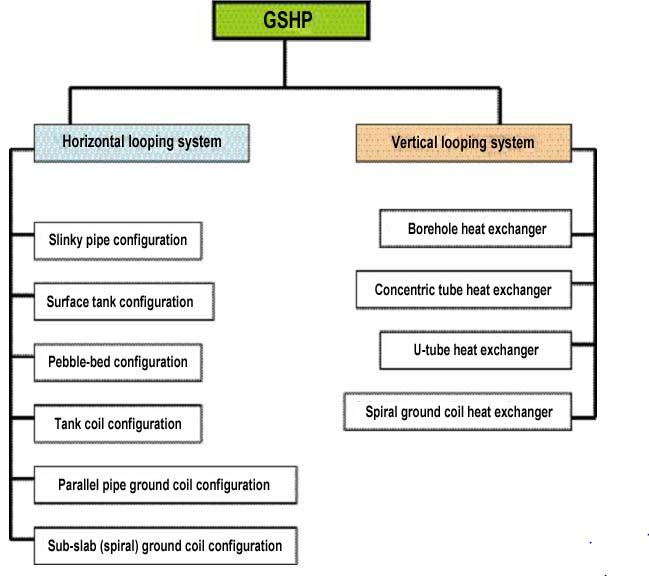
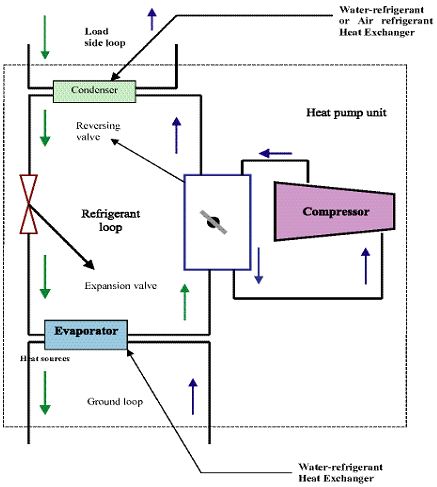
The term “ground source heat pump” has become an all-inclusive term to describe a heat pump system that uses the earth, ground water, or surface water as a heat source and/or sink. Some of the most common types of ground source ground-loop heat exchangers configurations are classified in Figure 7. The GSHP systems consist of three loops or cycles as shown in Figure 8. The first loop is on the load side and is either an air/water loop or a water/water loop, depending on the application. The second loop is the refrigerant loop inside a water source heat pump. Thermodynamically, there is no difference between the well-known vapour-compression refrigeration cycle and the heat pump cycle; both systems absorb heat at a low temperature level and reject it to a higher temperature level. However, the difference between the two systems is that a refrigeration application is only concerned with the low temperature effect produced at the evaporator, while a heat pump may be concerned with both the cooling effect produced at the evaporator and the heating effect produced at the condenser. In these dual-mode GSHP systems, a reversing valve is used to switch between heating and cooling modes by reversing the refrigerant flow direction. The third loop in the system is the ground loop in which water or an antifreeze solution exchanges heat with the refrigerant and the earth [28-30].
The GSHPs utilise the thermal energy stored in the earth through either vertical or horizontal closed loop heat exchange systems buried in the ground. Many geological factors impact directly on site characterisation and subsequently the design and cost of the system. The solid geology of the United Kingdom varies significantly. Furthermore there is an extensive and variable rock head cover. The geological prognosis for a site and its anticipated rock properties influence the drilling methods and therefore system costs. Other factors important to system design include predicted subsurface temperatures and the thermal and hydrological properties of strata. The GSHP technology is well established in Sweden, Germany and North America, but has had minimal impact in the United Kingdom space heating and cooling market. Perceived barriers to uptake include geological uncertainty, concerns regarding performance and reliability, high capital costs and lack of infrastructure. System performance concerns relate mostly to uncertainty in design input parameters, especially the temperature and thermal properties of the source. These in turn can impact on the capital cost, much of which is associated with the installation of the external loop in horizontal trenches or vertical boreholes. The climate in the United Kingdom makes the potential for heating in winter and cooling in summer from a ground source less certain owing to the temperature ranges being narrower than those encountered in continental climates. This project will develop an impartial GSHP function on the site to make available information and data on site-specific temperatures and key geotechnical characteristics.
The GSHPs are receiving increasing interest because of their potential to reduce primary energy consumption and thus reduce emissions of greenhouse gases. The technology is well established in North Americas and parts of Europe, but is at the demonstration stage in the United Kingdom. The information will be delivered from digital geoscience’s themes that have been developed from observed data held in corporate records. This data will be available to GSHP installers and designers to assist the design process, therefore reducing uncertainties. The research will also be used to help inform the public as to the potential benefits of this technology.
The GSHPs play a key role in geothermal development in Central and Northern Europe. With borehole heat exchangers as heat source, they offer de-central geothermal heating with great flexibility to meet given demands at virtually any location. No space cooling is included in the vast majority of systems, leaving ground-source heat pumps with some economic constraints. Nevertheless, a promising market development first occurred in Switzerland and Sweden, and now also in Austria and Germany. Approximately 20 years of R and D focusing on borehole heat exchangers resulted in a well-established concept of sustainability for this technology, as well as in sound design and installation criteria. The market success brought Switzerland to the third rank worldwide in geothermal direct use. The future prospects are good, with an increasing range of applications including large systems with thermal energy storage for heating and cooling, ground-source heat pumps in densely populated development areas, borehole heat exchangers for cooling of telecommunication equipment, etc.
Loops can be installed in three ways: horizontally, vertically or in a pond or lake (Figure 9).
The type chosen depends on the available land area, soil and rock type at the installation site. These factors help to determine the most economical choice for installation of the ground loop. The GSHP delivers 3-4 times as much energy as it consumes when heating, and cools and dehumidifies for a lower cost than conventional air conditioning. It can cut homes or business heating and cooling costs by 50% and provide hot water free or with substantial savings. The GSHPs can reduce the energy required for space heating, cooling and service water heating in commercial/institutional buildings by as much as 50%.
Efficiencies of the GSHP systems are much greater than conventional air-source heat pump systems. A higher COP (coefficient of performance) can be achieved by a GSHP because the source/sink earth temperature is relatively constant compared to air temperatures. Additionally, heat is absorbed and rejected through water, which is a more desirable heat transfer medium because of its relatively high heat capacity. The GSHP systems rely on the fact that, under normal geothermal gradients of about 0.5 ºF/100 ft (30 ºC/km), the earth temperature is roughly constant in a zone extending from about 20 ft (6.1 m) deep to about 150 ft (45.7 m) deep. This constant temperature interval within the earth is the result of a complex interaction of heat fluxes from above (the sun and the atmosphere) and from below (the earth interior). As a result, the temperature of this interval within the earth is approximately equal to the average annual air temperature in order to quantify the influence of these factors [12,14,20,24,30-33]. Above this zone (less than about 20 feet (6.1 m) deep), the earth temperature is a damped version of the air temperature at the earth’s surface. Below this zone (greater than about 150 ft (45.7 m) deep), the earth temperature begins to rise according to the natural geothermal gradient. The storage concept is based on a modular design that will facilitate active control and optimisation of thermal input/output, and it can be adapted for simultaneous heating and cooling often needed in large service and institutional buildings [34]. Loading of the core is done by diverting warm and cold air from the heat pump through the core during periods with excess capacity compared to the current need of the building [12,14,16,27,35,36]. The cool section of the core can also be loaded directly with air during the night, especially in spring and fall when nights are cold and days may be warm.
• Launching of public awareness campaigns among local investors particularly small-scale entrepreneurs and end users of RET to
highlight the importance and benefits of renewable, particularly solar, wind, and biomass energies.
• Amendment of the encouragement of investment act, to include furthers concessions, facilities, tax holidays, and preferential
treatment to attract national and foreign capital investment.
• Allocation of a specific percentage of soft loans and grants obtained by governments to augment budgets of R and D related to
manufacturing and commercialisation of RET.
• Governments should give incentives to encourage the household sector to use renewable energy instead of conventional energy.
Execute joint investments between the private sector and the financing entities to disseminate the renewable information and
literature with technical support from the research and development entities.
• Availing of training opportunities to personnel at different levels in donor countries and other developing countries to make use
of their wide experience in application and commercialisation of RET particularly renewable energy.
• The governments should play a leading role in adopting renewable energy devices in public institutions, e.g., schools, hospitals,
government departments, police stations, etc. for lighting, water pumping, water heating, communication and refrigeration.
• Encouraging the private sector to assemble, install, repair and manufacture renewable energy devices via investment encouragement
and more flexible licensing procedures.
The adoption of green or sustainable approaches to the way in which society is run is seen as an important strategy in finding a solution to the energy problem. The key factors to reducing and controlling CO2, which is the major contributor to global warming, are the use of alternative approaches to energy generation and the exploration of how these alternatives are used today and may be used in the future as green energy sources. Even with modest assumptions about the availability of land, comprehensive fuel-wood farming programmes offer significant energy, economic and environmental benefits. These benefits would be dispersed in rural areas where they are greatly needed and can serve as linkages for further rural economic development.
However, by adopting coherent strategy for alternative clean sustainable energy sources, the world as a whole would benefit from savings in foreign exchange, improved energy security, and socio-economic improvements. With a nine-fold increase in forest – plantation cover, every nation’s resource base would be greatly improved while the international community would benefit from pollution reduction, climate mitigation, and the increased trading opportunities that arise from new income sources.
The non-technical issues related to clean energy, which have recently gained attention, include: (1) Environmental and ecological factors, e.g., carbon sequestration, reforestation and revegetation. (2) Renewables as a CO2 neutral replacement for fossil fuels. (3) Greater recognition of the importance of renewable energy, particularly modern biomass energy carriers, at the policy and planning levels. (4) Greater recognition of the difficulties of gathering good and reliable renewable energy data, and efforts to improve it. (5) Studies on the detrimental health efforts of biomass energy particularly from traditional energy users.
The present study is one effort in touching all these aspects.