Development of New Models and Systems to Micro- And Nanoscale Supported in High-Precise Functional Replication of the NEMS as Products of Pilot Plant Laboratory UNAB
This work shows a technology of artificial cloning for industrial sensors by means of the use of neural networks and genetic mapping. The neural networks allow develop to the intelligent structure of the micro- nanosensors, for it, the method of activation of random values is used to train the sensors and to carry out the learning starting from real devices, the genetic mapping allows the generation of codes for the cloning procedure, for it the mutation processes, crossing, reproduction and investment are used also, an example of a cloned sensor that determines the index of viscosity of lubricant oils with phenol for a monitoring system is briefly explained. The present article shows the results of the research carried out in the project on the development of a real time monitoring technology for the content of phenols in industrial wastewater. In - line dump flows, treatment tanks, stabilization pools In the open water and in the discharge of the water spill as part of the challenge presented by ECOPETROL on the need for decontamination of the wastewater in the Barrancabermeja Oil Refinery where they include the results on the design, development and implementation of a methodology that Through the detection of contaminants in real time, uses a network of sensors based on micro-nanobioinstrumentation with electronic nose, artificial tongue and spectrophotometric eye, supported in mobile technology for the monitoring of parameters of water quality (phenol content) in lines of Pipe in vertimient and effluents, the article presents the results development of a real-time monitoring system and on-line control by mobile technology of water quality parameters (phenols) in pipeline line for shedding and effluents that emulate by functional replication of the senses of smell, taste and spectrophotometric vision by artificial cloning that is applied in the design of the sensor network and control systems.
Keywords: Artificial Cloning; Genetic Mapping; Sensors Network Micro Nanobioinstrumetation
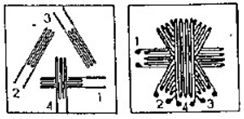
The technology of artificial cloning of industrial sensors, as presented here, consists of a group of means and procedures based on tools of artificial intelligence these are then applied in the reproduction of high fidelity of real devices used in automation and control of industrial processes. This is based on the integration of neural networks techniques and genetic algorithms [1-4]. A method, a procedure and utilities form this technology. The method consists of the application and interpretation of the genetic mapping that it contains; the codes of the functional structure of the sensor. The mapping is a group of bars of codes that describe the functional operative units of the sensor, each operative unit is formed by unitary elements that represent a part of the operation of the sensor such as deviation of the angle of incidence, variation of the intensity of the sheaf of light, etc. A code is a series of digits that represent a part of the operation of the sensor where each digit represents a position inside the functional structure (Figure 1). The procedure consists of the application of a group of guidelines directed to the structural connections of the neural networks which facilitates the flow of information for the learning of the cloned sensor [5]. The utilities are criteria likeness that applies measured a dimensional and they include parametrical characteristics of the real devices to clone that allow a sensor to reach a cloned version.
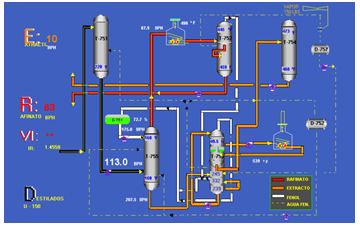
Let us consider, a plant of extraction for lubricant oils with phenol and let us consider that this prepares, among other, of an analyzer (sensor of the refractory meter) on-line and the whole instrumentation associated to the monitoring of the process that are centralized in a team that serves as operation interface (Figure 1).
The sensor determines the index of viscosity of lubricant oils with fenol. For this, it calculates the refraction index starting from a sheaf of monochrome light and then processes that information through a linear relationship with the index of viscosity. This information constitutes the primary element for later prosecution on the part of the monitoring system, which registers and permanently deploys the obtained information of the cloned sensor.
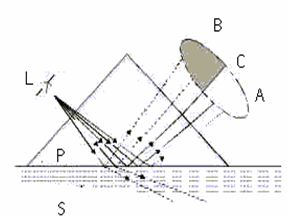
The analyzer it determines the refraction index through the solution S that is refracted measuring the critical angle of refraction [6] (Figure 2a). For it, the light coming from the light source L goes against the interface among a prism P and the solution. The rays of light meet with this surface to different angles. The reflected rays form an image ACB, where C is the position of the ray of the critical angle. The rays in to are reflected totally in the interface and the rays in B are partially reflected and partially refracted inside S. This way the optic image it is divided into illuminated area to and a dark area B. The position of the limit C among the areas to and B shows the value of the critical angle and therefore of the refractive index of the solution of the process. The refractive index is usually increased whilst increasing the concentration.
Five stages compose the process of cloning artificial sensors [7].
Stage 1: In this stage, the devices are selected to clone. The population is divided according to the number of objectives given in functional operative units; the group of operative units is called” objective function”. For example, for an I number of N devices that constitute the population and an I number of n operative units, the population is divided in an agreement population’s part with the units whose size is N/n. Then, you re-iterate with a genetic algorithm each subpopulation with a strongest different objective function with the purpose of selecting the individuals; that is, to assure that each objective function is evaluated. Then, priority is assigned (hierarchical classification) to the functions objective depending the problem be solved. Finally, each function is selected according to its priority and it is evaluated on each subpopulation. This is carried out until evaluation of all the functions objective. Is achieved to assure the diversity, the weakest individuals are replaced in each subpopulation.
Stage 2: Are obtained the partial solutions S1, S2, S3,... ,Sn for each operative unit. The union of these solutions will allow to conform a new global population, to randomly which is applied a objective function that has been selected. This process is repeated until a certain number of iterations (fixed as convergence criteria) to assure that each function objective was evaluated inside the total population with a high reliability.
Stage 3: In this stage, in each subpopulation one selects the individuals that have the minimum value of the objective function that is evaluated. The number of individuals that are selected (for each sub population) it is taken as information to define the coefficient that will ponder each one of the components of the multiple objectives function (the group of different operative units). Finally, the total population is generated as the union of all subpopulations and is evaluated using the multiple objectives function considered according to certain previous values [8].
Stage 4: In this stage the objective function is selected to evaluate, among the operative units that compose. One should make sure that all the functions are evaluated a definited minimum number of times.
Stage 5: In this stage a process of optimization is carried out with values and spaces characteristic of the partial solutions obtained in the stage 3 using the multiple objectives function resulting in stage 4. Then, the number of individuals is determined that give a minimum solution; that is to say satisfying the coefficient of consideration of the functions objectives with regard to the multiple objectives function. This represents the cloned device.
For this example, the real analyzer is replaced a cloned intelligent sensor starting from the real device due to frequent flaws presented in the system [1].
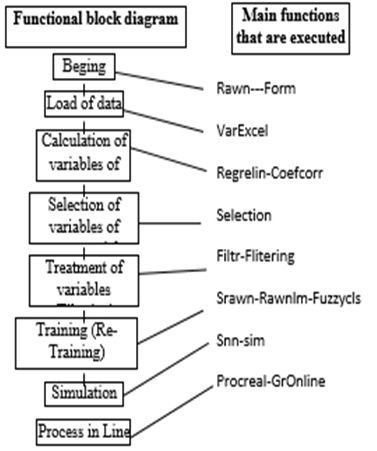
In the (Figure 2b) shows a summary of the total approximation of the RAWN each step can be divided into different actions and calculations, the first part of the algorithm has to do with the estimation of the activation weights, this is based on the construction of local linear models, but to construct these linear models, the dataset first needs to be partitioned into different subsets, which will be used for the estimation of a particular local linear model, to avoid saturation of the activation function, these subsets need to be scanned, this is the second step of the algorithm, the third step is with the parameters of these local linear models that must be calculated by linear quadratic techniques, the resulting parameters of the local linear models are used as the activation weights of the neural network, now that the weights have been calculated, the final step of the RAWN training process is the estimation of the output weights by standard linear quadratic techniques (Table 1,2,3 & 4) (Figure 3 & 4).
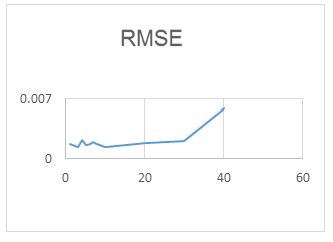
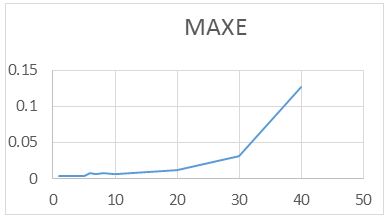
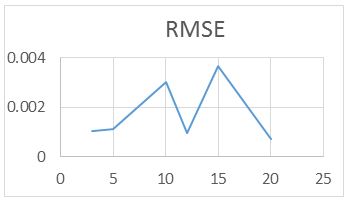
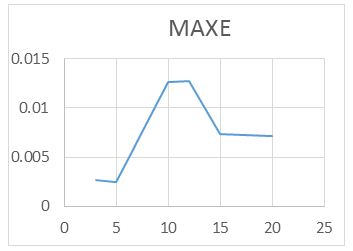
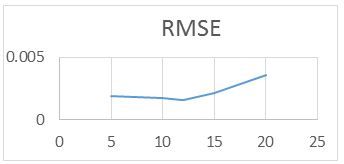
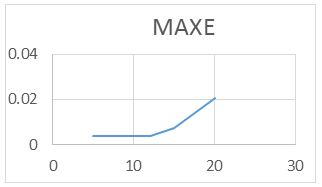
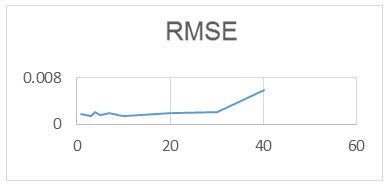
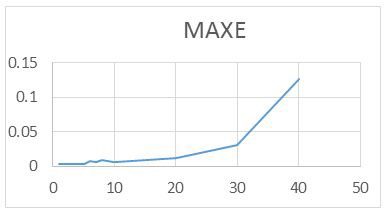
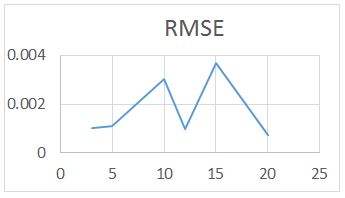
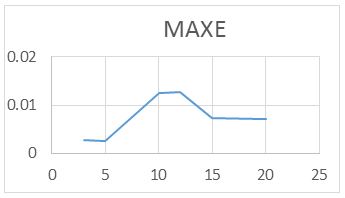
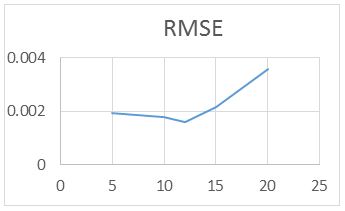
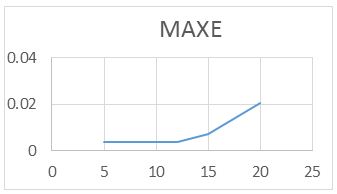
For the RAWN Training Method. Which allows to obtain the parameters of the architecture neural network, the analysis of the behavior by complete training, with the optimal parameters found for the RAWN, to determine the appropriate network is considered the number of neurons in the hidden layer, samples required for the Training and the number of steps back, For each training the RMSE (Error RMS) complemented with the MAXE (Maximum Error: with the validation data to determine the experiments with the best performance corresponding to the optimal parameters.
The computational contribution was obtained in the reduction of the execution time necessary for the training that the algorithms require determination of the parameters of the neural network (Figure 5,6,7,8 and 9) (Table 5,6,7 and 8).
For the implementation of the methodology based on stem cell patterns (nanosensor-smart control-nanoactuator) a learning stage is required, with the GA procedure (in the search phase of the correct sequence), so it is implemented Directly, replacing the “ parent” device, which can be used as a reference element in a primary stage of implantation a summary of the operation of the cloned system, in this illustration it is seen, as the inputs are converted, thanks to “ Fuzzy c -mean “ in fuzzy clusters and these in turn are reflected in fuzzy sets (Figure 10,11,12,13,14 and 15) (Table 9,10,11 and 12) [10,11].
After having this information in the form of a “chromosome”, the sequence of genetic operators is applied, which converts the input information into “chromosomes” with the same data structure (antecedent and consequent)?
The data set delivered by the cloning process is processed by the system; one of the important stages of this process is the defuzzification of a part of the “chromosome”, so that it can have the value of the variable cloned in ranges of the universe of discourse and not in terms of belonging to fuzzy sets.
The modeling of nanotechnology systems equipped with nanosensors of phenol concentration, pressure and flow by top-down design methodology and the nanoinstrumentation parameters are presented in terms of membership of sets [12].
The configuration of a polymer molecule is due to the nature of the tetrahedral carbon atoms which forms the basis of most polymeric structures. A system of these atoms is the amorphous state of a polymer, in contrast to the crystalline state that the molecules are most ordered. When interacting with a solvent, the various molecular polymer chains will be soaked in solvent. If there is little interaction of polymer it dissolves and is simply dispersed. If the interaction is strong, then the molecule bonds will easily disappear, since there will be a considerable number of solvent molecules surrounding the polymer chain. If the polymer / solvent interaction is equal to the intermolecular interaction then the resulting solution is known as an ideal solution. This polymer melt can also be viewed with an ideal solution since the solvent is simply a polymer of the same type as the solute for a polymer solution it is subjectedResults
Electrospinning must have a sufficient degree of intermolecular interaction to cooperate with stress forces associated with the fiber deposition process [13].
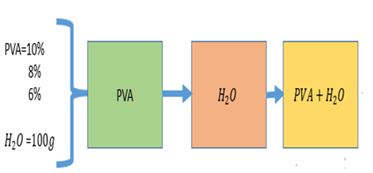
The Figure shows a schematic of the procedure for the synthesis of the solution that will be used for the respective tests (Figure 16).
The PVA used PVA-124, with a degree of polymerization of 2400 and a degree of hydrolysis of 98.41mol%, the solvent used was distilled water to be used. For preparation of the polymer Solutions of 6%, 8% and 10% by weight of compound were made in a total of 90 grams taking into account the following amounts to be used (Table 13):
Using the analytical balance, the weights and measurements necessary to carry out the preparation process were determined, taking into account, where the sample values are shown in quantities used as a result of the experimental design for solutions of 6% , 8% and 10% (Table 13).
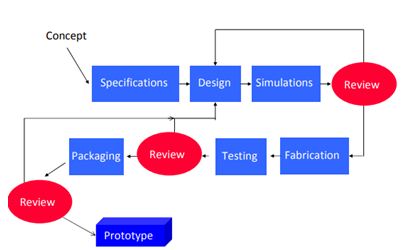
Artificial cloning in engineering develops as an alternative for the development of means and advanced control systems, that allow to respond to the demands of the industry, through functional replicas of sensors, controllers and actuators based on techniques of artificial intelligence supported in advanced artificial cloning systems and evolutionary software. This methodology is presented in Figure 17 [13,14].
The referred methodology is implemented in hardware through mutable logical arrangements that allow the replication of functions, ensuring the procedures are shown below [15]:
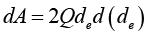
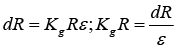
The development design of nanosensors by manufacturing based on the technique of electrospinning for the start up of nanoinstrumentation from nanowires considers the variation of their electrical resistance from the known relation of the resistance of the conductor is:
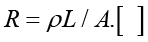
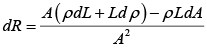
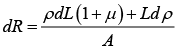
If the part is deformed in the direction of the conductor, the three parameters ρ, L and A must be varied then the resistance will vary according to [17]:
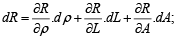
Where
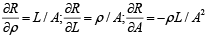
Then
The cross section can be reduced to a circular section of equivalent de thus,

The conductor is circular,

Deriving
The magnitude of the Poisson coefficient
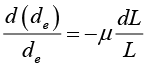
It is then that
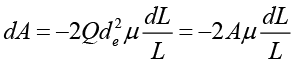
Substituting equation (2) into equation (3)
Eliminating A with the help of equation (3)
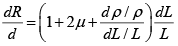
It is now taken into account that the unit longitudinal strain ε=ΔL/L and then
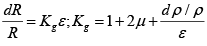
It is observed that Kg apparently depends on ε, but the term ε, but the term (dρ/ρ)/ε is a physical property of the conductor material and is called piezoresistivity, so that
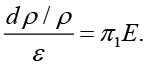
In equation (5), E is the modulus of elasticity of the material and y  is the longitudinal piezoresistivity coefficient, being it possible to be positive or negative.
Finally,
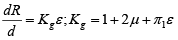
Kg This is the tensoelement coefficient and relates the unit longitudinal deformation (relative change of length) to the relative resistance change of the conductor.
The sensitivity Kg R of this conductor is the ratio between the change in resistance and the unit longitudinal deformation
The above described applies to wire of low caliber, with mechanical resistance with a limit lower than the defined specifications, the other possibility is to increase L. if the length is increased the value of the unitary longitudinal deformation is not measured, which requires that the length L is as small as possible; To increase it without changing the measurement area.
If the part has in the direction of measurement a unit longitudinal strain ε, it will have in the transverse direction a unitary longitudinal deformation -με. Assuming that the total longitudinal length of the wire remains L and its area A but the total transverse length of the wire is Lt, with a section AT, it turns out that the change in longitudinal strength is:
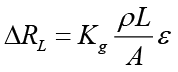
The change of transverse resistance
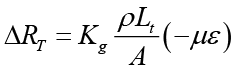
The change of total resistance is
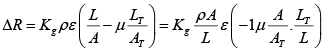
Then
n this case all the nanowire has the same uniform section A. thens AT= A and finally
It is observed that although the total length of the wire is L + L_T and because its sensitivity is now smaller it is considered that the wire is straight with a length L, for the conditions of the tensoelement that during its manufacture by electrospinning the samples of measure their behavior in one piece then the actual change in resistance corresponding to a certain unit longitudinal strain is measured and Kg is determined experimentally therefore, already the coefficient of the tensoelement takes into account this phenomenon.
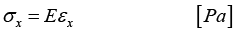
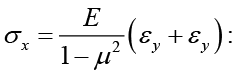
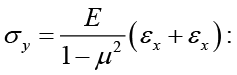
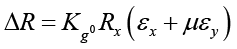
With the tensoelements, the unit strain εx, is measured in the longitudinal direction, which will now be referred to as the x direction. To calculate the normal stress in the x direction, it is necessary to know a priori that there is no normal stress in the y direction, as in the case of a rod subjected to traction or compression. Then, for an elastic material with modulus of elasticity E (Pa) and within the elastic zone has
If one were not sure of the absence of σ_y, another tensoelement would be placed in the direction y, so that its axis would be 90˚ with respect to the axis of the first tensoelement. now he wouldes have the readings εx and εy. The general law of Hooke, one has to
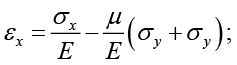
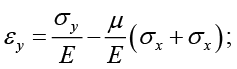
The Greek letter μ represents the Poisson coefficient of the material (it is assumed that the elastic limit is not exceeded). Here σx=0. then clearing the efforts you get
In this way normal forces can be determined in both directions.
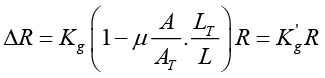
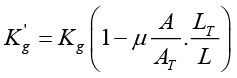
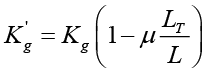
The length of the grid in the y direction is μ times the length of the grid in the length x. In addition, both grills are in series, reason why their resistances are added Kg0 ) to the constant of each grid, which is the same for both, we have for the change of resistance in each grid
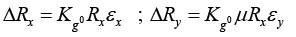
The total resistance is
Comparing equations (14) and (11) gives the expressions
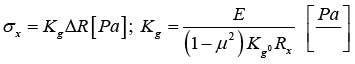
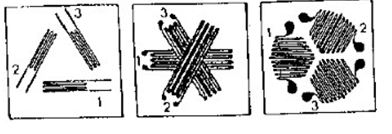
The value of Kg is given by the manufacturer and without performing operations we have the stress σx, only by measuring the total change ΔR of resistance of the tensoelement in this case, a minimum of three tensoelements must be used and the readings of each of them must be processed (Figure 18,19 and 20).
The values of the máximum (σmax) and minimum (σmin) stresses in the plane and the position of the main axes refer to the direction of the tenso element 1, are determined as follows:
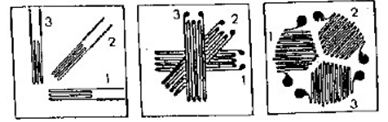
For the Rectangular Rosette:
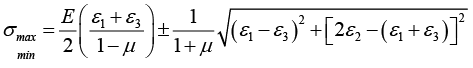
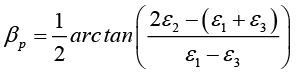
The Delta Rosette:
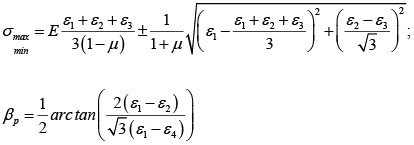
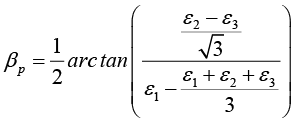
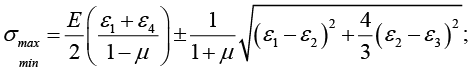
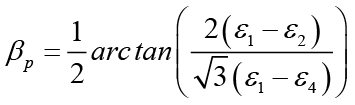
The arrangement in Delta T Rosette configuration presented, introduces the values of the amplified signals of a tensoelement, providing greater accuracy in the calculations, it is possible to measure with this configuration and to use the formulas of the Delta Rosette, without considering the information of the tensoelement 4 ; then recalculated with the formula of the Delta T rosette, to obtain the desired result with the values of σmax; σmin y βp all other parameters of the tensional and deformational state can be calculated.
In equations (13) through (16), E is the modulus of elasticity of the material in Pa and μ the Poisson coefficient. With the characterization of the polymer patterns the design parameters can be obtained information of parameters such as position, force, and angle. The database should be taken and organized for use in the design of control systems by artificial cloning, which includes the technique of grouping data known as fuzzy c-mean referred to above, where each data corresponds to its degree of Belonging according to the bases of applied theory of possibilities [18].
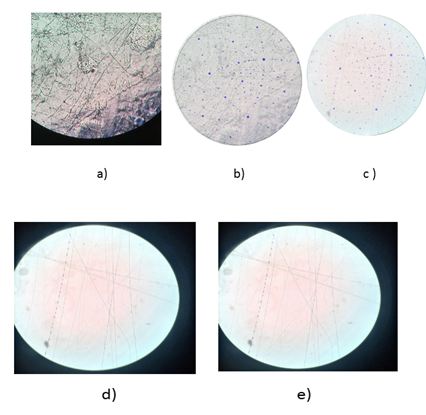
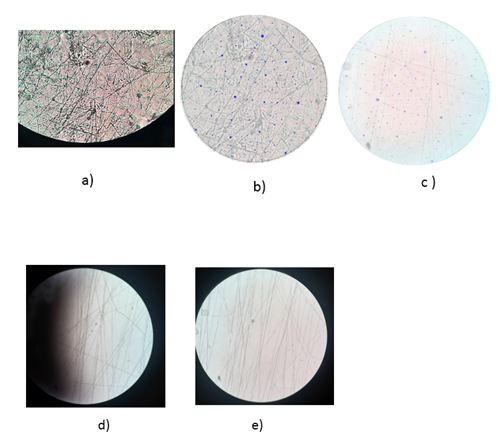
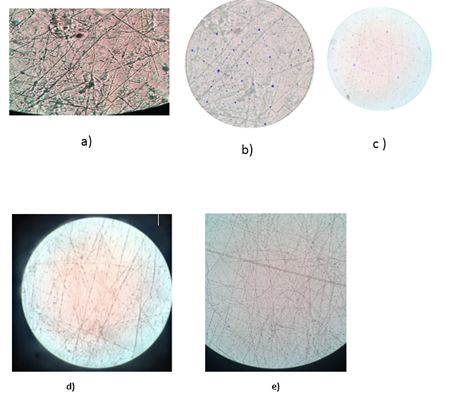
For the experimental validation of the results of the use of the electrospinning equipment for the production of the nanowires, he proceedes with the experimental design based on three series of experiments for different concentrations of polymer obtained through experiments whose design corresponds to the analysis of samples and their results through response surface spaces; The processing of the results of the samples for purposes of validation is structured through the procedure of superposition of the image obtained from the samples and the calculation by engineering in nanotechnology supported in the quantum model validated through the software Molecular Workbench [19].
The experimental design based on surface response considers the factors involved in obtaining the samples including the estimation of the quantum models through the contour graphs and the metods for the analysis of the obtained surfaces. According to the experimental design of three series of experiments for different concentrations (6% , 8% 10% ), for each of these were performed between 5-7 tests for a total of 15 -17 samples, the statistical analysis of the samples obtained can be seen later .
The tests performed for three different concentrations took into account the variables of operation of the electrospinning equipment and were taken as significant displacement factors between the injector and the collector and additional to this the voltage of the power supply that guarantees the electric field of high voltage for the obtaining of nanowires to develop by the technology of real-time monitoring of the content of phenols in industrial wastewater, which allows to know this parameter in line, either in pipelines, in treatment tanks, in stabilization pools in the open sky and / or directly in the discharge of the dumping, with a limit of detection of 0.1 mg / l. ; The data obtained from the tests performed appear in the tables and the images of the samples obtained refer to the images [20].
For the processing of the results of the realized tests, calculations were carried out by image superposition, where the original image corresponds to the sample obtained with the electrospinning equipment and the superposition image corresponds to the modeling obtained with the software Molecular Workbench, the results obtained from the analysis of the samples according to the tests performed are shown below the samples of the polymer by superposition (Figure 21,22 and 23) [21].
For the determination of the electrical properties of the samples obtained by electrospinning, the ISO standard TC 213 corresponding to the methodology established by nanometrology for applications in nanoscale devices is applied based on the standard data for the validation of nanostructures with nanowires established as a product of the electronic spinning process. (Nanotechnology Standard). Electrical characterization of polymer fibers obtained by electrospinning through the I / V curves obtained by modeling and simulation by computational nanotechnology for 1D in longitudinal conductivity.
The use of the genetic mapping allows the design of quicker teams for the sequencing and with computer development the creation of the databases is possible to transmit, to store, to analyze and clone this information.
The artificial neural networks are able to manage complex and not linear problems, they can process information very quickly and they reduce the required computers effort in the development intensive computer of model, finding functional forms for empiric models as shown by that of our case with the cloned sensor.
In an alone artificial neural networks entrance exit data are needed so that the net recognizes a pattern wrapped in the mapping from the entrance variables to the answer of the exit. It is true that the neural networks have been described as a black box to solve problems, but the ability of the neural networks to give quick and precise values for the case of the process engineers makes them a very useful tool. Its ability to execute the inverse problem easily of exchanging the entrance vectors and the exit of the neural networks is also constituted in another advantage for the analysis and diagnosis of a given system.
One can obtain an excellent genetic mapping with neural networks in advance with only a layer of non-lineal neurons taking the activation random values, continued by a training of the values of having left by ordinary minimum square. Static and dynamic examples show the feasibility of this approach. As in any non-lineal identification, care should be taken to make sure that the excitement entrance used for identification, be in the same range of frequency and width like in the application. Later improvements they can be obtained for regularization of the values activation.
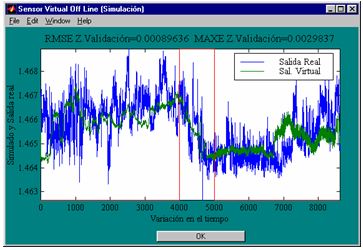
As a result, the software tool elaborated for such an end, can be used in the training of any system (entrance-exit) that seeks to be solved applying neural networks of this type. It has all the intermediate steps required as the attendance in the selection of variables for statistical methods that use the mathematical one required for the treatment of this class of stochastic processes, prove of possible linear, sign treatment to filter noise eliminate false data, training-validation and tests for simulation off line and on-line with the real process. The measurement of the RMS error is used and the Maximum opposing Error, mainly in the validation phase to be used as the comparison parameter that allows for the evaluation of the acting of the obtained pattern [22].
In the experimental validation, the electrical characteristics of the samples of the conducting polymer are considered in concentrations of 6% , 8% and 10% where it was established that as defined for the application in the manufacture of nanosensors by ISO standard TC 213 Which takes into account the geometric structure of the nanostructured nanomaterial and its main longitudinal dimension the spatial distribution of the obtained sample (lattice) determine its electrical conductivity in spite of its electrical anisotropy, the assembly on the surface of the nanowires is defined for conductivodad at distances Greater than 200 nm being the nanoe structura obtained for the nanowires with 6% concentration of the polymer.
The modeling and simulation of the design of nanostructures surfaces with conductive polymer nanowires was done with software Molecular Workbench version where the runs of the quantum model were realized through the design based on response surfaces and the calculation of Engineering in Nanotechnology of The quantum energy characteristics of the samples based on the equivalent circuit where Modeling the electrical behavior of conducting polymer nanostructures where a voltage is applied to the nanowires (source voltage) and to the surface (gate voltage) for the electrical characterization of polymeric fibers Obtained by electro-silting through the I / V curves obtained with computational nanotechnology for 1D in longitudinal conductivity [23].
It is recommended to carry out the implementation of the nanosensors through development of functional replication based on stem cells and intelligent systems for manufacturing that allows replicas of imitation reproduced by generations of “ chromosomes”, representations of configurations of evolutionary algorithms, clustering in fuzzy sets And distributed control with deep neural networks of the initial population, information on performance functions of the equipment and / or installation, ordered according to a multiobjective function supported in the quantum model, with “ genetic operators” , tools that alter the composition Of the new chromosomes generated by the parents (initial population), during reproduction and includes: Mutation (generation of new information in a system), Crossing (information exchange between two systems), Investment (exchange information in the same system); In this way with the Model of evolutionary circuits can have the basic structures for the design of stem cells as a solution for the characterization of evolutionary circuits of micro- and nano-automats where mutation switching is substituted as a result of the change in the circuit of configurable logic blocks By mutable logic blocks.
Using the Bottom Up methodology for the implementation of adaptive nanosensor systems in fusion of sensor technologies and actuator functions in intelligent materials has resulted in a new technology: adaptronics or adaptive materials. The idea of this new technology is to use intelligent materials that act as sensors to detect, for example, changes in the environment such as pressure, temperature, humidity, and can respond to these changes in a controlled way by means of actuators i adaptronic, the sensor and the actuator are integrated in the same structure. The sensor detects changes in its environment, and sends this information to the control system, which produces a response signal and sends it back to the actuator. This device is, finally, in charge of performing the commissioned action.