Diabetic Retinopathy, Classification and Clinical Impact
Introduction
Diabetic retinopathy maybe defined as the presence and characteristic evolution of typical retinal micro-vascular lesions to a patient with diabetes. DR usually manifests as a gradual, painless progression of vision loss; however, visual loss may occur with vitreous hemorrhage or macular edema.
Aims
To ascertain the prevalence of diabetic retinopathy (DR) based on the duration of the diabetes mellitus (DM) and to compare it with data from relevant literature and other referent clinics. This exploratory research was conducted to evaluate the clinical experience of DR, its impact of the other disease and health related quality of life.
Material and Methods
In this study are included the patients with diabetes mellitus type I insulin dependent (DMID) and diabetes mellitus type II non-insulin dependent (DMNID). The duration of diabetes in the examined patients varied from 5 till 30 years. We have applied examination by ophthalmoscope, slit lamp bio-microscopy with Volk and Goldman lens, optical coherence tomography - OCT as well as fluorescent angiography - FAG. Have been included for focus groups (n = 450) the treated patients with DR, from December 2016 - 2020.
Results
Participants described a range of evaluate symptoms and clinical impact. In suffering for a period of 5 years, the prevalence of DR is 12,5%. In diabetic patients suffering over 30 years, the prevalence of DR is over 90,5 %. After the test of PDR impact the comlications results by the X2 -test, the difference was found to be statistically significant for p<0.05.
Conclusion
Diabetic retinopathy, undertakes a multidisciplinary approach in all patients with diabetes. Always should be assessed visual acuity, the loss of independence and mobility associated with decreased visual functioning based on NPDR and PDR associated with visual impairment have a significant impact on health related quality of life, in patients with DR.
Keywords: DR; Visual Acuity; Health Related Quality of Life
Diabetes mellitus as characterized by chronic hyperglycemia secondary to defects in insulin secretion or to insulin resistance, leading to long-term multi-organ complications [1, 2]. A fasting plasma glucose of ≥ 7,0 m.mol/l is usually the diagnostic laboratory threshold for diabetes [3, 4]. Two common types of diabetes (types 1 and types 2) are recognized, and have some overlap in age at onset [5, 6]. Diabetic retinopathy maybe defined as the presence and characteristic evolution of typical retinal micro-vascular lesions in an individual with diabetes [7, 8]. For the purpose of this report, retinopathy in association with diabetes is considered DR. Epidemiology, the global prevalence of diabetes among adults aged ≥ 20 years in 2000 was around 171 million (2,8 – 3,5% of the world population), and is expected to rise to 366 million (4,4% of the estimated world population) by the year 2030. DM is an increasing health problem that currently is expected to affect ˃200 million people by the years 2025, [1,6]. The prevalence of sight-threatening retinopathy varies principally with the known duration of diabetes mellitus [10].
With some influences from age of the patients and type of diabetes. On the most frequent complications of diabetes is diabetic retinopathy (DR), which is the patient’s age 25-85 years in the USA. DR usually manifests as a gradual, painless progression of vision loss; however, visual loss may occur with vitreous hemorrhage or macular edema followed by general blurred and double vision, spots in the field of vision [11]. PDR depends on the duration of diabetes mellitus-DM [1.2]. Whereas, risk factors are: uncontrolled glycemia, AHT (arterial hyper tension), the period before the puberty, pregnancy, obesity and extra-capsular extraction at the cataract [1, 5, 8].
The infra-clinical stage of the diabetic retinopathy is connected to the micro-angiopathy that affects capillaries, arteries, veins with small calibers and is characterized by a thickness of the basic membrane, peri-cells loss that leads to a growth of the capilaries permeability. PDR-complications are as follows: vitreous hemorrhage - (VH), retinal detachment – (RD), cataract, glaucoma, blindness, which are linked to the development of fibro-vascular tissue [1, 6].
The treatment is dependent on clinical presentation. In pre-proliferative diabetic retinopathy (PPDR) is indicate and anti-vascular endothelial growth factor (A-WEGF) in cases when we have a reduction in visual acuity, either as a result of macular edema or other retinal structures, [6,10]. To macular edema are laser grid photocoagulation and for PPDR, in the severe cases of proliferative diabetic retinopathy (PDR) with vitreous hemorrhage and detachment threatening or involving the macula, the vitrectomy surgery treatment is indicated. Visual impairment has been to reduce health-related quality in people with cataracts, glaucoma and retinal detachment that patients with DR or low vision from any cause [7, 9]. The objective of this research was to evaluate the symptoms of DR and the impact of DR on patients [11, 12].
To ascertain the prevalence of diabetic retinopathy (DR) based on the duration of the diabetes mellitus (DM) and to compare it with data from relevant literature and other referent clinics, to determine the clasification of diabetic retinopathy according to the findings in the retina, impact on daily activities and creating conditions for the clinical impact and management of DR.
In this study are included the patients with diabetes mellitus type I insulin dependent (DMID) and diabetes mellitus type II non-insulin dependent (DMNID). The duration of diabetes in the examined patients varied from 5 till 30 years, or otherwise complications from both types of diabetes, to include in this study. The duration of diabetes in the examined patients varied from 5 till 30 years. We have applied examination by ophthalmoscope, slit lamp bio-microscopy with Volk and Goldman lens, optical coherence tomography - OCT as well as fluorescent angiography - FAG. Have been included the treated patients with DR, for focus groups (n = 450) from December 2016 - 2020. There were conducted the PRP-laser treatment and that one of microsurgical like cryo-therapy and vitrectomy Patients were identified and screened by board – certified ophthalmologists from their clinic patient populations (Vision Eye Clinic & HUC “Mother Theresa” in Tirana, Albany, UCC and Living Pharmacy in Prishtina and Faculty of Stomatology, UBT College in Prishtina, Kosovo.Data processing was done with the Statistical Package for Research to the Social and Medical Sciences, version SPSS 22. The obtained data are presented through tables and graphics. In the statistical processing as the parameters are used:
As Statistical analyze has been used for the structure’s index (%), an arithmetical average and standard deviation, while differences between the data have been tested by the X2 -test, the difference was found to be statistically significant for p<0.05.
In this study are included the patients with diabetes mellitus insulin-dependent - DMID and diabetes mellitus non-insulin-dependent – DMNID, patients with type I diabetes and those with type II diabetes, but only those who had diabetic retinopathy (DR) as a complication. The duration of diabetes in the examined patients varied from 5 till 30 years. Have been included the treated patients with DR, from December 2016 - 2020.
Participants described a range of evaluate symptoms and clinical impact. In diabetic patients suffering for a period of 5 years, the prevalence of DR is 12,5%. In diabetic patients suffering over 30 years, the prevalence of DR is over 90,5 % (Table 1).
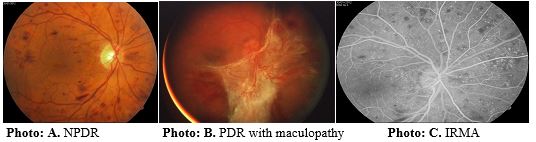
There are 4 forms of the DR: 1. Diabetic angiopathy - DA, 2. Nonproliferative diabetic retinopathy - NPDR, 3. Preproliferative diabetic retinopathy - PPDR and 4. Proliferative diabetic retinopathy – PDR. With some clinic’s subforms of the DR, wich can be found after the examination of retina (Table 2)
In our results as more the frequently complications are evidenced: vitreous hemorrhage, retinal detachment, cataract, glaucoma and blindness (Table 3). After the test of the PDR impact of the comlications the results by the X2 -test, the difference was found to be statistically significant for p<0.05
Impact on daily activities. The impact of visual impairment was prominent in the participants’ thoughts, activities and lives. Driving a car was the most frequently affected activity, then hunter activity and in third place are the cases with inability or difficulties in reading with 70 or (15,9%) patients
According to the Early Treatment Diabetic Retinopathy Study – ETDRS, there are two forms of the DR: NPDR and PDR. According to the authors of this study there are four forms of the DR: DA, NPDR, PPDR, PDR with some clinic’s subforms. After the examination of the retina with ophthalmoscopy or OCT, we have clasified the DR stages (Table 2 and Photo A, B, C). Wessing on 1974 has come to the conclusion that the patients who were suffering about 5 years from DM have presented 15-30% of DR, while the others with DM who were suffering about 10 years have presented 35-50% of DR, those with DM about 15 years have presented 55-65% of DR, the others with DM about 20 years presented 65-85% of DR, while those over 30 years with DM, frequence of the DR varied from 75 to 90%. Whereas Perlemuther on 1985, has come to the conclusion that the patients who were suffering about 5 years from DM have presented > 10 % of DR. While the others with DM who were suffering about 20 years have presented 47-70% of DR. Author Unger, on 1982, concluded that the patients who were suffering about 2 years from DM have presented 2-23% of DR. While the author Carmen M., on 2004, concluded that patients who were suffering about 5 years from DM, have presented 8,5 % of DR, those with DM about 10 years have presented 33,5% of DR, the others with DM about 15 years have presented 74,2 % of DR, while those over 20 years with DM, the frequence of the DR was 88.8 % of DR and the patients who were suffering 30-35 years with DM, the frequence of the DR varied up to 99 %, depending on their general clinical state. The main cause of reducing the visual acquity at the type 1 DM is PDR, while the main cause of reducing the visual acquity at the type 2 DM is diabetic macular edema. Duration of the diabetes based on the years and prevalence of DR according to our searching made during the period of time from 2000-2010, in the diabetic patients with duration up to 5 years, the prevalence of DR is over 12,5 %, in the diabetic patients with the duration up to 10 years, the prevalence of DR is more than 30 %. In diabetic patients with duration up to 15 years, the prevalence of the DR is more than 57 %, in the diabetic patients with duration over 20 years, the prevalence of DR is more than 75 % and in diabetic patients with duration over 30 years the prevalence of the DR is 90,5 % (Table 1). Duration of DM type 1 and 2 as well as the risk factors determine the prevalence of DR. The treatment: medical treatment including the appliances with mechanism actions of anti-vascular endothelial growth factor (A-VEGF), afterwards laser treatment – PRP and microsurgical like vitrectomy, depending on evolutional stage of the DR (Table 2).
In our study the most frequently complications were evidenced: vitreous hemorrhage in 170 cases or 38.6%, retinal detachment in 80 cases or 18.2%, cataract in 60 cases or 13.6%, glaucoma in 40 cases or 9.1% and then blindness in 90 cases or 20.5%, (Table 3). After the test of the results completed by the X2 -test, the difference was found to be statistically significant for p<0.05% (X2 = 11.23; df = 4). And the other authors; share the same stand.
Losing one’s independence as a result of visual mpairment was devastating for those who experienced DR. While most participants were not as affected as the above participants, they did have negative experiences from visual impairment associated with DR on their daily activities.
The impact of visual impairment was prominent in the participants’ thoughts, activities and lives. Driving a car was the most frequently affected activity with 120 or (27,27%) cases, then hunter activity with 80 or (18,18%) cases followed by the inability or difficulties in reading with 70 or 15,9%) cases until difficulties recognizing faces with 40 or (9,0%) cases, (Table 4). None of the participants felt that their relationships with friends and family had been negatively affected by DR.
This study was designed to quantify correlate patient-related issues with disease severity, visual impairment fluctuations or psychosocial impact. Although the sample size of this study vas not small, this exploratory and qualitative study illustrates the thoughts and concerns of people with DR regarding their diagnosis, vision, daily activities and treatment. In summary, the impact of DR on health-related quality of life cannot be undervalued, particularly in the independence, mobility, leisure and self-care activities.