Diet of the Invasive Lionfish Pterois sp. in Broward County, Florida
The geographic range of invasive lionfish Pterois sp. currently extends throughout the Greater Caribbean in the western North Atlantic, prompting concerns about the impacts of its predation on local ecosystems. We focused on dietary habits of lionfish in Broward County, Florida, where there is only limited, anecdotal information on the species’ prey selection. Diet was determined using percent number, percent occurrence and percent weight, as well as the composite index of relative abundance (%IRI). A high percent teleost diet was documented during the third quarter (July-September) and a high crustacean diet in the fourth quarter (October-December), but seasonal effects by quarter or wet-dry analyses were insignificant. We observed an ontogenetic shift from a mainly crustacean diet to one consisting of mainly teleost fishes: the smallest lionfish size group (5-10 cm) had a 100% crustacean diet, whereas the largest size group (35-40 cm) had a 77% teleost and 23% crustacean diet. Our study results found no evidence that lionfish consumed commercially or recreationally targeted teleost species in these nearshore reef habitats.
Keywords: Diet; Lionfish; Stomach Content Analysis; Reef Fish; Ontogenetic Shift
The occurrence of lionfish on the southeast U.S. coastal shelf represents one of the first documented permanent additions of Indo-Pacific marine fish species into the western North Atlantic Ocean [1]. Within the western North Atlantic and Caribbean Sea, invasive lionfish are a combination of the western Pacific Ocean red lionfish Pterois volitans, and the Indian Ocean devil firefish Pterois miles the term “lionfish” in this region therefore refers to both species [2,3]. Both lionfish species have been documented in the western Atlantic, with P. volitans comprising approximately 93% of the invasive population [4]. Due to uncertainty regarding the taxonomic status of the species, we refer to lionfish herein simply as Pterois sp. The invasive range of lionfish currently extends from Brazil north to Cape Hattaras in the United States, as well as into U.S. New England waters seasonally. In addition to nearshore reef environments, lionfish have also been found in Bahamian inshore mangroves and low-salinity Florida Rivers [5-7].
The impact of invasive lionfish on local native ecosystems in the western North Atlantic remains relatively unknown, but several researchers have speculated that they may have catastrophic impacts on commercially and ecologically important teleost species [8,9]. Lionfish have very few documented predators in their native range, except for other lionfish and serranid groupers [10]. In the Greater Caribbean region, Bernadsky and Goulet reported that coronetfish Fistularia commersonii at least occasionally consumes lionfish, and two lionfish have been found in the stomachs of native groupers in the Bahamas Islands [10,11].
Hovering behavior during hunting, ambush predation, and the flushing of prey from the benthos enable lionfish to employ a diverse array of feeding strategies well-suited for feeding on benthic associated and cryptic fauna [9]. Lionfish in the Bahamas Islands have a diet consisting mostly of teleosts (78% by mass) and crustaceans (14% by mass) in their new environments [9]. Similarly, lionfish in Bermuda feed on both teleosts (73% by mass) and crustaceans (23% by mass). Snappers (Family Lutjanidae), and groupers (Family Epinephlinae) are naturally the predominant reef piscivores throughout the Greater Caribbean. However, because these native species are often heavily exploited by regional commercial and recreational fisheries, Morris and Whitfield suggested that lionfish could become the dominant piscivore in Caribbean reef communities [12].
We assessed dietary habits of lionfish collected from spring 2011 through summer 2012 at predetermined sites in Broward County, Florida, near the location that lionfish were first reported (anecdotally) in 1985. Specifically, we investigated the relationship between predator and prey size in order to determine if there is a preference for certain teleost or invertebrate taxa. Depth was also recorded to determine if this parameter influenced dietary habits. Finally, we collected lionfish in order to determine if diet composition included any seasonal variation. This study, while moderate in scope, presents the first comprehensive examination of diet composition for lionfish within the Florida reef tract.
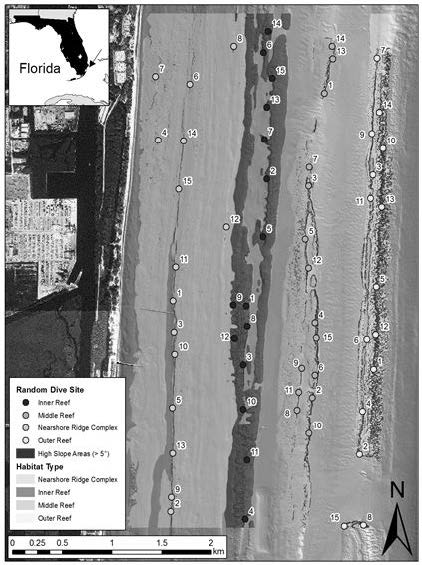
Specimens were collected from a 6 km cross-shelf corridor between Port Everglades and Hollywood, Florida that included each major reef system (inner, middle, and outer reef, and the near ridge complex) as defined by Walker, et al. (Figure 1) [13]. High-resolution bathymetric LIDAR data (4 m x 4 m) were interpolated by nearest-neighbor methods in ArcGIS (version 10.2; ESRI Inc: Redlands, CA), to create a digital elevation model (DEM). The bathymetric DEM was then analyzed for slope. A computer-generated random number system was used to select 15 sites in the high slope areas (greater than 5 degrees) for each of the four reef systems, yielding a total of 60 pre-selected dive sites for lionfish collections.
Lionfish were collected monthly between May 2011 and June 2012 using SCUBA and pole spears. Trips were conducted by boat and directly from the shore in order to reach the pre-determined collection sites. Once at the site, volunteers searched either north or south depending on prevailing currents. The capture depth was recorded for each lionfish. Specimens were transported to the Nova Southeastern University Oceanographic Center campus in Dania Beach, Florida whole on ice. The total length and wet weight were recorded in the laboratory prior to the processing of stomach contents.
In addition to these specific research collections, lionfish were also obtained from the 1st Annual Broward County Lionfish Derby in June 2012. For these specimens, whole lionfish were retained on ice by the capturing vessel, then transported to the weigh-in station in Fort Lauderdale, Florida. At this station, individual lionfish were weighed and measured, then stomachs removed on site following the protocol described below.
A vertical incision was made directly behind the pectoral fin along the anterior ventral side of the specimen. The stomach was removed intact and fixed in 5% neutral buffered formalin for one week to minimize post-capture digestion and harden prey tissue [14]. After fixation, the stomach was transferred to 30% ethanol for at least one week to remove residual formalin [15]. Full stomach wet weight was measured, all contents removed, and then the empty stomach was weighed again. All contents were searched for discernible organisms and identified to the lowest possible taxon.
Percentage by number, volume, and occurrence, and the index of relative importance were determined for each taxon found [16]. Percent frequency of occurrence (%O) quantifies the diet by compiling a total list of prey items found, and then comparing it to the total number of stomachs [15]. Percent composition by number (%N) is determined by the number of individuals of each prey type found, compared to the total number of prey items found. Percent composition by volume (%V) analyzes the weight of each prey item as a percentage of the total weight of prey items found, the equation for the index of relative importance (IRI) is [16]:
IRI= %N (%V + %O)
Since the %O is a non-additive index, the values for higher taxonomic levels could be greater than 100%, which affects the IRI. In order to compare specific prey categories, the IRI was converted to a percentage for broad diet taxa using the following equation [16]:
%IRIi = 100*(IRI /ΣIRIi)
Comparisons between size bins for percentage of teleost prey used two-sample t-tests. A linear regression was used to assess depth with individual lionfish length. Analyses were conducted in JMP 12.1.0 (SAS Institute Inc.; Cary, NC). Statistical significance was determined at α = 0.05, except for the seasonal comparisons, where a Bonferroni correction to α = 0.025 was applied for the multiple tests.
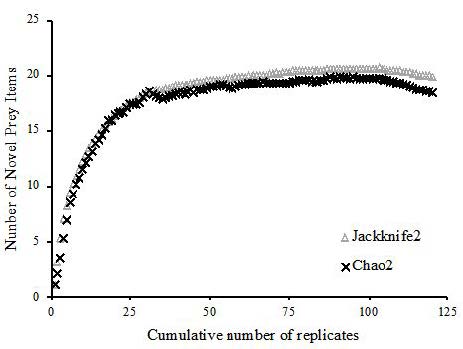
Cumulative prey curves were used to determine whether an adequate number of stomachs had been examined to sufficiently describe the diet. Using the Chao 1 and Jackknife estimators in Primer 7 (PRIMER-E Ltd.; Ivybridge, UK), the mean number of new prey categories found in the stomachs (using the family taxonomic level for prey categories as listed in Table 1 and Table 2) was plotted against the total number of stomachs analyzed. Randomizing the order of 120 stomachs to minimize potential bias, 999 bootstrap simulations of cumulative prey curves were constructed using the major categories of identifiable prey items. Per Ferry and Caillet, the asymptote of each curve (defined as a 1% rate of increase for new prey items) indicates the minimum sample size required to adequately describe the diet [17].
Due to uncertainties regarding local abundance at the preselected sites, all lionfish observed at each site were collected, resulting in a total of 229 individuals with a size range from 8 to 40 cm. Whole lionfish were placed on ice immediately upon return to the shore or dive vessel (ca. 15-20 mins), with stomach removal and fixation of the iced specimens within ca. 3 hrs of initial capture.
The cumulative prey curve analyses showed a well-defined asymptote, and the associated bootstrap analysis in PRIMER 7 determined asymptotes at only 99 (Chao 2) and 102 (Jackknife) individual lionfish (Figure 2). We therefore conclude that the total sample size of 229 individuals for this study was adequate to describe the diet of the lionfish in our geographic location.
Of the 229 stomachs collected and analyzed, 434 individual prey items were identified, comprising nine families of teleosts and seven families of crustaceans (Table 1 and Table 2). Teleost fishes dominated the overall diet, comprising 83.9% weight (%W), 69.3% number (%N), and 56% occurrence (%O). Crustaceans represented 16.1%W, 30.7%N, and 44%O. Of all stomachs collected, 59 (26%) were empty.
Teleost prey consisted of 23 identified species. The most represented families included: Gobiidae (6 species), Labridae (5) and Serranidae (4). The highest percentage of overall weight (%W) was found in Lutjanidae (22.3%), Gobiidae (16.7%) and Serranidae (7.9%). The families found to have the highest percentage of the overall number (%N) were Gobiidae (16.2%), Lutjanidae (5.2%) and Blennidae (4%). The percent occurrence (%O) showed similar results as the percent number. “Unidentified teleost” accounted for 39.4%O, 37.3%N, and 21.7%W. The majority of the crustacean prey consisted of the red night shrimp Cinetorhynchus manningi: 19.7%O, 15.01%N and 5.04%W. Other crustacean families represented included hippolytid, alpheid, and palaemonid shrimps, as well as portunid and pilumnid crabs. “Unidentified crustacean” accounted for 12.4%O, 9.2%N, and 2.7%W.
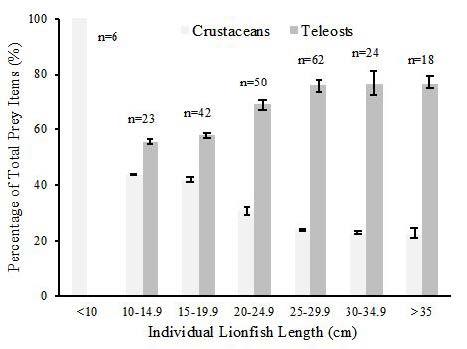
The %O, %N, and %W of crustaceans and teleosts per individual lionfish were also calculated. For analysis, the lionfish data were divided into size categories of 5 cm increments: <10 cm, 10-14.9 cm, 15-19.9 cm, 20-24.9 cm, 25-29.9 cm, 30-34.9 cm, and >35 cm. The total amount of crustaceans and teleosts was then added for all individuals found in each size range and the percentage calculated (Figure 3). The percentage of the diet consisting of teleosts increased as the size increased. In the first size category (<10 cm), no teleost remains were found. The relationship between the size of the individual lionfish versus collection depth was positive weak (adj. R2=0.2321), but significant (ANOVA; F-ratio 68.7069, p<0.0001).
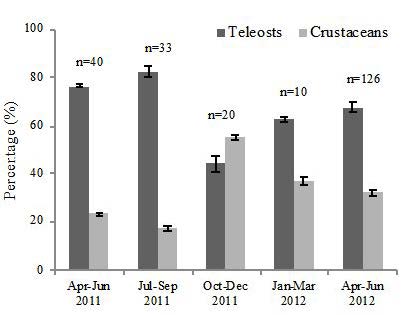
Comparisons of observed diet versus seasonality were used to determine change in the amount of teleost or crustacean prey consumed throughout the year. We used two methods: one, four calendar seasons due to local fish spawning times, which vary throughout the year, and two, the wet (June through September) versus dry (October through May) seasons that typically dominate terrestrial and inshore subtropical cycles, especially in southeastern Florida [12,18]. Qualitatively, the data indicated a high teleost diet during the third quarter months (July-September) and a higher diet of crustaceans during the fourth quarter (October-December). The other quarters (January-March and April-June) showed numbers that shifted back towards a high teleost diet as the year progressed (Figure 4). However, analyses by size classes for individuals with stomach contents showed no significant difference in the percent teleost prey between the April-June 2011 and April-June 2012 periods (<10 cm: only 2012, 10-14.9 cm: p=0.6182, 15-19.9 cm: p=0.7382, 20-24.9 cm: p=0.0415, 25-29.9 cm: p=0.1301, 30-34.9 cm: p=0.3578, and >35 cm: only 2012). Similarly, the analyses by size classes for individuals with stomach contents showed no significant difference in the percent teleost prey between wet and dry seasons (<10 cm: only dry season, 10-14.9 cm: p=0.7564, 15-19.9 cm: p=0.5710, 20-24.9 cm: p=0.2824, 25-29.9 cm: p=0.1289, 30-34.9 cm: p=0.3901, and >35 cm: p=0.1526).
The IRI and %IRI was calculated for all prey items. Teleosts were the most important dietary prey having an IRI of 8567.14 (80.57 %IRI) followed by crustaceans at 2,065.63 (19.43 %IRI). The IRI reflects the incorporation of percent weight, occurrence, and number, and indicates which prey items were the most abundant in all three categories. The most prevalent prey items were the families Gobiidae (407.58), Rhynchocinetidae (385.01), Lutjanidae (213.54), and Blenniidae (46). “Unidentifiable teleosts” had an IRI of 2323.44 and “unidentifiable crustaceans” at 147.60.
The results for lionfish in Broward County, Florida show them to have a diet consisting primarily of crustaceans and teleost fishes. With increased size, diet changed from primarily crustaceans (particularly red night shrimp) to one that was more teleost-dominated. Crustaceans were still present in the larger-sized individuals (lionfish greater than 40 cm), but only constituted about a quarter of the overall diet.
Lionfish are capable of consuming large prey on rare occasions (maximum observed prey: lionfish length ratio ca. 0.45) [19]. There is likely a reduction in predation risk with larger prey body-size, and undoubtedly, some upper size limit (i.e., gape width) at which length individual fish are likely no longer potential prey [19]. In this study, the number of prey increased with lionfish size but not necessarily the individual prey size. The largest prey item found in this study (a haemulid) measured 10.6 g and 8 cm TL within a lionfish that weighed 755.2 g and 15.5 cm TL, resulting in a length ratio of ca. 0.52.
The index of relative importance (IRI) for all prey items showed three teleosts and two crustaceans in the top five families identified: Gobiidae (407.58), Rhynchocinetidae (385.01), Lutjanidae (213.54), Blenniidae (46), and Palaemonidae (9.16), although “unidentifiable teleosts” had an IRI of 2323.44 and “unidentifiable crustaceans” 147.60. The IRI is determined by placing equal weight on %N and %W with a higher weighting on %O for each prey item. This study suggests that even though lionfish feed on almost 75% teleost prey in later life stages, crustaceans still represent a high relative importance in the overall diet. In this sense, our results are very similar to those of Eddy, et al. in Bermuda, which also found a high dietary dependence on red night shrimp, small serranids, and labrid wrasses [20].
In the Bahamas, Morris and Atkins, observed the top five IRI families as Gobiidae, Labridae, Grammatidae, Apogonidae, and Pomacentridae [9]. This study showed a more dominant teleost diet and shared the same teleost family in the top rank (Gobiidae). Morris and Atkins only found four families of crustaceans versus 21 teleost families, whereas our study found nine teleost and seven crustacean families. Similarly, the results of Layman and Allgeier in the Bahamas, Rojas, et al. in Cuba, and Sandel, et al. in Belize also found many more species of fishes than invertebrates [9,21-23]. However, all of these are tropical regions of high teleost biodiversity.
Most of the prey in this study consisted of teleosts and crustacean species whose individuals are normally found on the reef in crevices or perched on corals, including Blenniidae and Gobiidae. The large variety of prey found in the stomachs is consistent with prior reports of lionfish as opportunistic predators, including Côté, et al., Morris & Akins, and Muñoz, et al. (2011) [9,24,25]. Large numbers of certain teleosts and crustaceans found in the stomachs during this study were also observed to be abundant in the area and further support this hypothesis.
Initially, we hypothesized that the haemulids (grunts) would be the most prevalent item in the stomach contents due to the large number of this family in nearshore reef habitats. This hypothesis was based on visual observation and previously conducted studies that determined they were the most abundant species in Broward County reef systems [26]. However, only four haemulids were found in lionfish stomachs during our study. Lionfish predation on any given taxon is therefore more than simply a function of availability of the respective prey in the local environment. Côté and Smith reviewed prior lionfish diet studies, observing that predated teleosts tended to be “small, shallow-bodied, solitary fishes that live on or just above reefs,” which also describes many of the fishes observed in the stomachs in this study [27].
Lionfish in North Carolina showed different dietary preferences. In that region, prey items found were mostly teleosts (99%, versus 59.66 %O here) and consisted of 16 fish families and five invertebrate families [25]. Other prey items included crustaceans, cephalopods, bivalves, and echinoderms. Although North Carolina lionfish diets consisted of mostly teleosts, Muñoz, et al. were able to show a relationship between lionfish size and prey size: as the individual lionfish size increased, so did the size of individual prey items and overall diet variety [25]. The higher teleost percentage seen in Muñoz, et al. (2011) may be due to lessened abundance of local invertebrate prey species, especially shrimps [25].
In Bonaire, McCleery reported correlation between lionfish total length and prey preference [28]. As individual lionfish increased in size the diet shifted from a crustacean dominated diet to one that was teleost dominated, mirroring the pattern seen in Dahl and Patterson for lionfish from the northern Gulf of Mexico [29]. The top IRI families found in Bonaire also contained Gobiidae and Blennidae. These observations help support our conclusion that lionfish diet does show an ontogenetic shift at the early growth stages.
In the western North Atlantic Ocean, lionfish have been found not only on coral reefs but also in Bahamian mangroves, low-salinity Florida rivers, Honduran seagrass beds, and shallow, hard bottom sponge communities in Belize (J. Thomas, pers. obs.) [6,7,30]. Only 22 lionfish were collected in the Bahamian mangrove study and they all had similar prey items that corresponded with common mangrove teleost species, again supporting the opportunistic feeding pattern [6].
This study found a correlation between depth and increased size of lionfish. There are two possibilities for these results. First, lionfish could be moving to deeper waters as they age for dietary or other reasons. This habitat shift could possibly correlate with larger prey items being located at deeper depths and could be answered with a directed study of lionfish diet at depths greater than ca. 40 m, the usual limit for most recreational SCUBA divers. The second reason could result from lionfish removal in the shallower areas by local dive operations and individuals, an increasingly popular activity within the diving and conservation communities that ironically made collections in the study area difficult.
We compared our observed lionfish diet results in two ways: one, through the traditional four seasons due to local fish spawning periods, which vary between species throughout the year, and two, through the tropical wet versus dry seasons. The data indicated a high teleost diet during the third quarter months (July-September) and a higher diet of crustaceans during the fourth quarter (October-December). The other quarters (January-March and April-June) showed numbers that shifted back towards a high-percentage teleost diet as the year progressed. A large shift between third quarter 2011 and fourth quarter 2011 from 82% to 44% teleost diet was noted. With more lionfish stomach data during those specific quarters, the percentages may have decreased in range, but not enough to account for a 38% differential. This leaves possible depletion in the teleost population as a potential rationale; assuming that lionfish are opportunistic predators, they would consume more crustaceans if the teleost population was less abundant. Further comparisons for multiple years are suggested to address the problem of missing annual replication across seasons.
Possible impacts on local reef communities remain speculative and relatively unknown. There have been studies that are starting to institute yearly fish surveys in invaded areas, but the data collection is still small and poorly standardized between research groups. There are also other factors that would have to be considered when investigating variation in fish abundance, including changes in environmental factors and removal rates by humans. Fish surveys are important in order to determine changes in reef communities, but are needed over a long period of time to make more concrete assessments of lionfish impacts over time. The concerns raised by regarding decreases in overall fish populations are warranted, especially including otherwise threatened species, such as the critically endangered social wrasse (Halichoeres socialis) in Belize [31,32]. However, the results seen here run counter to the commonly voiced concern that lionfish are consuming large numbers of commercially or recreationally important species in the southeast Florida region, such as the lutjanid yellowtail snapper Ocyurus chrysurus or the labrid hogfish Lachnolaimus maximus. Future studies should assess lionfish diet in locations of high and low anthropogenic impacts to evaluate whether fishing pressure affects prey composition. The long-term monitoring recommended by Albins, et al. is clearly warranted to track changes over time, and our work here could provide a historical baseline for future assessments [19].
This study presents the first dietary assessment of the invasive lionfish complex in Broward County, Florida – the putative location of the initial invasion [33]. Determining depth, individual size, and seasonal impacts on lionfish dietary preference is important in understanding their impact on local coral reef communities. We observed an ontogenetic shift from a mainly crustacean diet to one consisting of mainly teleost fishes as the lionfish grew in length. Although reported previously in the northern Gulf of Mexico by Dahl and Patterson, this shift in trophic preference in relation to size was the first documentation of this trend on the South Florida reef system [29].
We would like to thank the American Dream dive charter company which allowed free use of their boat when doing field collections. This study was funded by the donation of collection gear from Divers Direct and received collection assistance to the authors from J Guerra (NSU), R Vigneau, J Fredrick, and the Reef Environmental Education Foundation (REEF).