Economic Performance of Sardinary Fishing Units in Algiers Coastline
On a global scale, the almost total over-exploitation of fishing resources has weakened the economic situation of fishing fleets, which becomes problematic. In Algeria, fish stocks are mainly represented by small pelagic fish, notably sardine. The economic performance study of sardine fishing units of the central coast of the country reveals a downward trend since 2007 of the profits made by this fleet. Revenues recorded from this date, are degrading; Even so, the turnover achieved still covers the operating and non-operating expenses borne by all the shipowners in the study sector. The average overall rate of return of the various boats is getting closer and lower every year. The highest level is found in the lowest engine, and ranks the latter as the most performing. While, in terms of capital productivity, the high-purse seiners are the least productive. As for staff productivity, it is steadily declining. Thus, taking advantage of the new strategy of encouraging fishing, advocated by those responsible for public action, it seems more appropriate to move towards the substitution of vessels with strong motorization by smaller boats.
Keywords: Economic Performances; Mediterranean Sea; Algeria; Sardine Fishery
In Algeria, a Mediterranean riparian country, the coastline of 1600 kilometers of shoreline contains various fishery resources (small pelagics, molluscs, demersal fish, crustaceans and large pelagics) and a fish stock estimated to 500 000 tonnes of which more than 220 000 usable. However, 187 000 tonnes are represented by pelagic fish, mainly sardines and anchovies. “Sardina pilchardus” (Walbaum, 1792) alone constitutes 74% of this fishable stock it dominates 80% of the national catch and provides 83% of the actual consumption of fresh fish. With the economic recovery of fishing sector towards the end of the 1990s, the State is trying to increase fish production by increasing fishing fleet [1]. Thus, the number of all types of vessels (sardine boats, trawlers and small trades), and various engines (from less than 250 hp to more than 1500 hp), tripled and increased from 1548 to 4583 fishing units between 1990 and 2013 that is, a 296% of index evolution.
In 2014, the maximum sustainable yield (MSY) of sardines is estimated to 77 182 tonnes, while the fishing effort f (MSY) seems exceeded [2]. Although in 2006, national landings peaked at 156,000 tonnes of fish; nevertheless, since then, the quantities fished have been falling steadily (MPRH) and yields have recorded negative annual evolution rates [3].
Apparently, the Algerian coastline is not immune to the phenomenon of overexploitation of the world and Mediterranean known fishing resource. Therefore, management measures are recommended at the national level to limit fishing effort on existing fish stocks, and thus ensure the professional future of fishers. The assessment of the economic situation of the various fishing vessels informs the manager of the real opportunity to invest in the activity and thus enables the investment to be directed towards the best production tool, in this case, towards the most powerful category of power.
Like the situation at the national level, the sardine fishery in the central sector of the country is deteriorating and producers are increasingly confronted with a scarcity of the resource and fear a perfectly apparent risk on their fishing operation. Thus, the analysis of the economic performance levels of the latter, according to the different engines present, makes it possible to limit the regional investment to the most efficient category of motive power.
In Algeria, the narrowness of the continental shelf amplifies the fishing activity in the bays, where the physicochemical characteristics favor fish production, especially that of small pelagics. Thus, in the central region of the country, the Bay of Bou-Ismail connected to that of El-Djemila, appears as one of the most important of the national coast. The four berths of these bays, namely Tipaza, Bouharoun, Khemisti (Bou-Ismail) and El-Djemila (El-Djemila) were subject of this work.
In this sector, in the absence of national economic databases on the operation of fishing vessels, we conducted surveys of sardine boat owners. The questions addressed deal with the economic and financial aspects of the different categories of vessels (cost of acquisition of vessels, type of financing, operating costs, price of fish, quantities fished, receipts ...) and cover the period from 1998 to 2013.
Continuous monitoring of this population has made it possible to count up to 108 individuals, while in 2013 (the year of survey discontinuation), only 77 remained in actual activity.
Even if all are sardines, the technical characteristics of each unit make it possible to draw up a typology of this fleet, in order to exclude any inclination to consider “the boats of a fishery as a homogeneous whole in view of their economic results, which appear variables “[4]. Compared to the motive power, we distinguish three categories of boats in the study area that are defined according to common characteristics; these are the following power classes: [<250 hp], [250 to 500hp] and [500 to 1500 hp].
In fact, the information collected was gathered into a set of data and processed with the Excel software in order to calculate the various indicators and economic ratios that are appropriate for studying the performance of the different categories of fishing vessels, namely:
* Overall profitability ratio: which in economic terms is defined as a comparison between the income obtained by the company (profits made) and the capital employed in production, regardless of their origin. This report answers the question of improving overall profitability and the acceptability of operating profitability. It is of the form: Net Result / Value Added [5].
- Net operating results represent profits from fishing activity or losses incurred. They are the product of subtracting all operating and non-operating expenses and expenses from the total sum of revenues earned by the sale of fish. However, they cannot be addressed without taking into account the seasonality of the fishing activity; even if towards the last analysis exercises, the seasonal difference is not obvious. The observed seasonal variations grow at weighting equivalent to coefficients of 63% for the high season and 37% in the reduced season to total of 240 days per year of actual fishing; at 5 months of spring / summer and 3 months of autumn / winters.
Added Value is a concept of economics that measures the value created by an economic agent. It represents the difference between production and intermediate consumption, which are all the goods and services purchased and then destroyed during the production process or incorporated into the product. The difference between the value of fish sales and the total value of expenditures on goods and services processed to obtain them represents the added value generated by the activity of producers in the study area.
* Ratio of yield: it is the image of all the material and financial means used. They compare definitively acquired results with permanently available capital. The overall yield ratio is in the form: Net Income / Total Assets.
- Total assets reflect the value of all fixed assets (investments, inventories, receivables and cash); in this case, it is represented by the only immobilization that is the armed fishing boat. Indeed, the nature of fishing activity in the study area, and in Algeria, does not generate any storage of raw material or small tools, let alone finished products (sardine). In addition, all transactions are cash-based and do not give rise to the writing of receivables and cash balances between fishermen and other fishery actors such as agents. In addition, there is no account or cash register specifically dedicated to the fishing business.
* Productivity ratio: it measures the efficiency of a process to transform into a result, one or more incoming factors. It is the ratio of the production of goods and services to the quantity of factors of production or inputs (capital and labor) used.
- Capital productivity ratio (added value / total assets)
- Labor productivity ratio (added value / number of hours worked or added value / workforce)
The analysis of the economic survey data of the sardine fishing enterprises of Bou Ismail and El Djemila bays revealed the following results:
The following paragraphs summarize the calculations leading to the estimation of the different economic ratios of the fishing vessels studied.
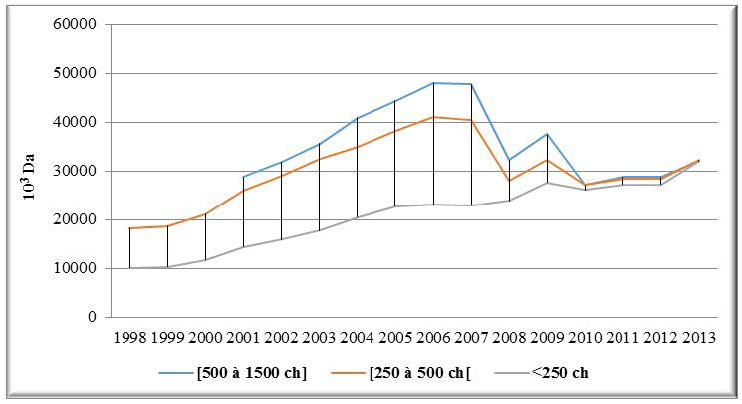
The revenue from the fishing activity is calculated on the basis of the average annual sales of all engines identified in the study area. This is the volume of catches of sardine by its transfer price (Table 1 and 2).
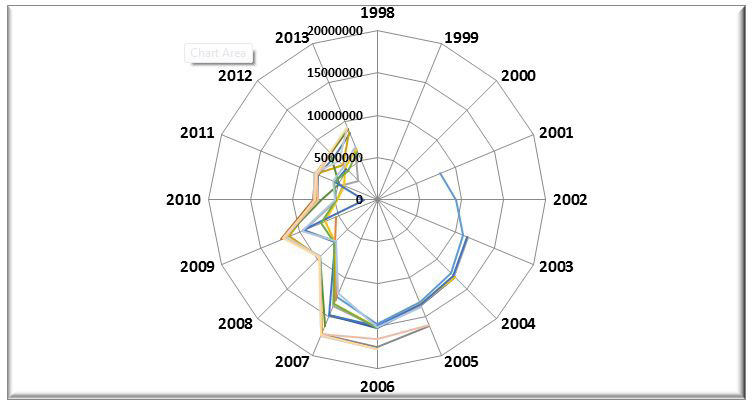
For the various engines studied, the revenues show an increase in the amounts recorded between 1998 and 2006; and mark a steady fall from 2007, except for the weaker power that maintains relative growth (Figure 1).
The constant increase in the value of sales is due not only to the higher unit selling prices of sardine trap applied uniquely to all armaments; but also, to the even slight increase in annual catches. The offer even more important, prices do not decline in the Center region (Bouharoun, Cherchell, Algiers ...) as in the rest of the country. The global offer still falls short of the needs expressed. In addition, the significant increase from 2002 of the sardine fleet by new acquisitions had practically no impact on the prices of the sale of fish. Indeed, the market value of sardines is constantly increasing throughout the study period and even beyond during the following years.
On the other hand, the depreciation of profits from 2007 is explained by the significant decrease in the volumes caught by fishermen in the study area. But, the backlash is differently felt according to the motorization categories. The strong and the average motorizations appear the most penalized with a fall of the recipes estimated on average to 6% and 3% respectively. The low power meanwhile, sees its revenue grow by an average of 1% which nevertheless, according to some fishermen, fishing in the breeding areas.
This situation pleads again the scarcity of the fishery resource, which from 2007 begins to be felt through the slowdown in the rate of revenue growth, but even more accentuated in the higher power boats which now, achieve levels of revenue almost identical to those of the average power. They thus lose their comparative advantage of the largest hold. Unlike other low-power boats, in the other categories, the increase in selling prices of fish does not seem to compensate for the decrease in catches and therefore causes a decline in average annual revenues.
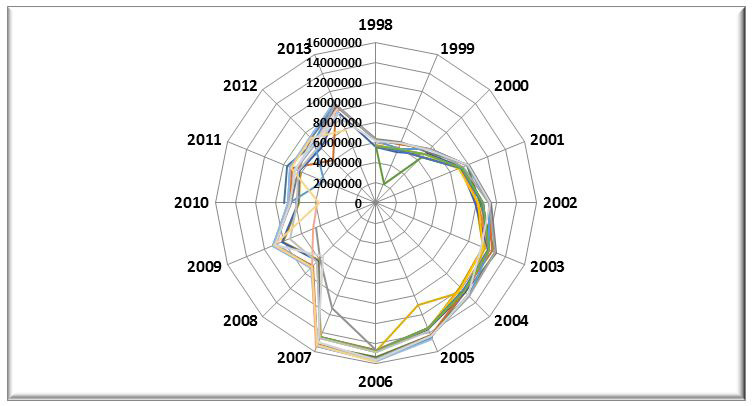
Input flows in the study area are constantly increasing, regardless of the type of boat. Several expense items experienced increases during the study period, while others were introduced outright on specific dates. The following summarizes the operating cost levels for each of the three categories studied by vessel.
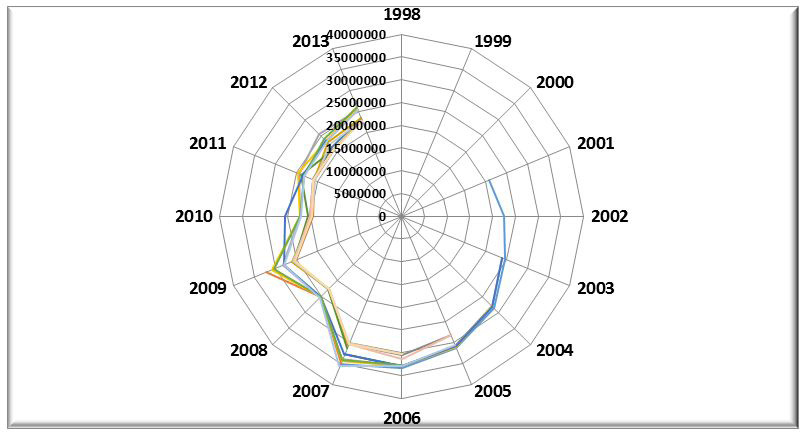
Category of [500 to 1500 hp]: It is only in 2001, that the boats with high motive power appear in the zone with operating expenses exceeding 20 million dinars. Between this date and 2013, these costs continue to grow to reach 35 million dinars, especially during the period of full activity (2004 - 2009), corresponding to an average evolution ratio of 1.23% annually (Figure 2).
Before 2010, operating expenses were higher and exceeded 35 million dinars for some vessels where the cost of the major overhaul is relatively high (between 2 and 4 million Da / year). However, a boat stopped operating just before that date. This is the case of two other boats that have been shut down since 2008 for bank repayment difficulties. One vessel converted to tuna and another was sold. In 2013, five (5) boats, or 31% of the workforce, are to be counted on purse seine vessels. Apparently, the profitability of this category of motorization is questioned, especially from 2010, when the decline in the resource significantly reduces the number of trips to sea.
Compared to the expense items, almost half of the costs (48%) consist of the remuneration of the work force. The share of the agent occupies the second place of the total spent with proportions close to 11%. The financial costs resulting from the bank credit contracted for the acquisition of the ship when this is the case, can take the upper hand by 17%; while the fuel captures 9%.
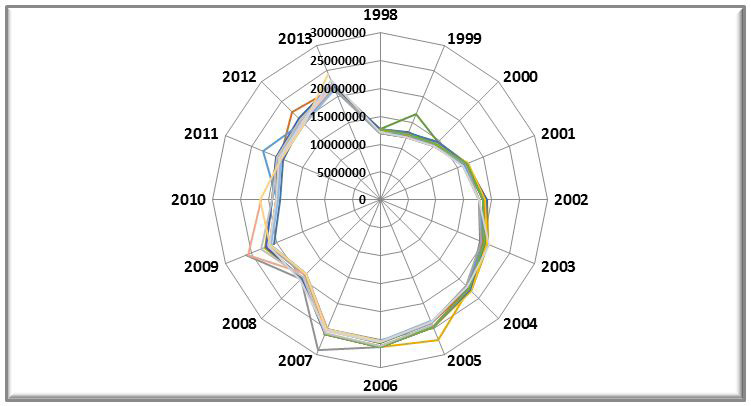
Category of [250 to 500 hp]: Unlike high power, medium-sized boats have always existed in the study area. Their operating expenses fluctuate between a minimum threshold of 12 million dinars in 1998 to reach 29 million dinars in 2007 (Figure 3). The average annual rate of change over the entire period analyzed is 4%.
For this category of boat, the payroll premiums over other total expenses at 62%. The remuneration of the agent is of the order of 14%, while the diesel levies 7%. For some boats, it is the financial expenses that increase their total expenses; for others, fuel consumption appears excessive, because of the brand of the engine more consuming diesel.
In 2013, 11 vessels out of 27 surveyed (41%) were missing. Five are sold to owners of Arzew, BeniSaf and Mostaganem. According to their peers, the scarcity of the resource and the race for fish that has become more exacerbated by the multiplication of fishing boats are pushing some owners to lose interest in the activity. Four other vessels are at a standstill for various causes, mainly related to inheritance problems or outright abandonment following disagreements between partners. Two finally, could not be relocated in the last periods of investigation.
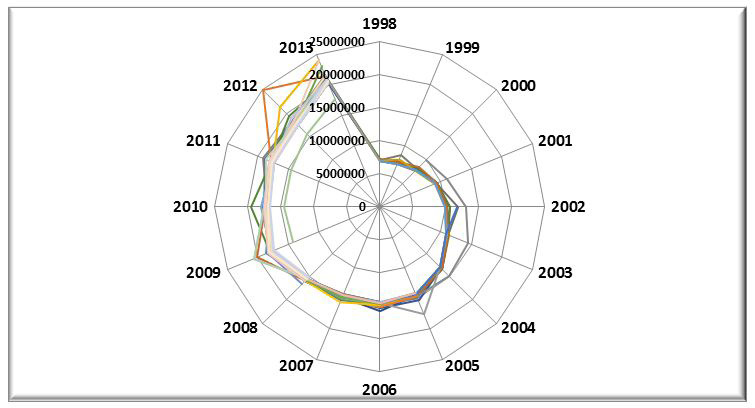
Category of [<250 hp]: Like high-powered boats, low-powered boats double the number of their registration in the study area, with the revival of the fisheries sector by the action of the public authorities, to reach the number of 65 boats. Their inputs move between floor values of 6 million dinars in 1998 and ceiling values of 25 million dinars in 2012, an average growth rate of 7.5% (Figure 4).
Among low-level motorists, like the average category, the most important load item is the remuneration of seafarers (62%); it is followed by the share taken by the agent, at a rate of 14%. Fuel represents 4% of the total costs incurred by a boat. Even in this category, and after 2007, 15 vessels are forced to stop while the majority of the owners have some seniority in the fishery. For some, the age of retirement pushes them to yield the ship (6 boats sold to Annaba, Skikda, Bejaia, Cherchell and Tenes), and for others constraints such as bank seizure, disagreement between partners, non-compliance administrative system, prevent them from exercising their profession. On the other hand, after this date, 26 new units were added to the landing stages studied.The distribution of fixed and variable costs in the Mediterranean fisheries shows that the most important items are those of fuel and lubricant, which account for 40% of total costs followed by salaries at 23% and maintenance which captures 10% [6].
For shipowners, gross profit is the result of subtracting variable costs (including crew members’ shares) from realized turnover. It is an essential indicator of the profitability of fishing units. R. and U. Hilborn state that income depends on catches and costs depend on fishing effort [7].
According to Diaw if the gross profit is negative in the short term, the boat operates at a loss; the shipowner must therefore cease these operations. In addition, if this profit is positive or equal to zero, the boat produces enough, at a given production cost, to maintain her activity [8]. However, to account for the capacity of the ship, it is important to take into account the fixed costs (depreciation, opportunity cost ...) that are not taken into account in the calculation of the gross profit. The operating results of purse seiners in Bou-Ismail Bay and El-Djemila Bay represent profits from fishing activity or losses incurred. They are the product of the subtraction of all operating and non-operating expenses and expenses from the total sum of revenues earned by the sale of sardines. They are taken up according to the different classes of motive power in the following figures.
Category of [500 to 1500 hp]: Until 2007, the profits made by boats with high motive power could reach almost 18 million Dinars. Beyond this year, they are decreasing to less than 2 million dinars (Figure 5).
A 50% decrease is reported between average 2007 and 2013 results, due to a drop in captured volumes and increased operating costs. Over the entire period analyzed, the rate of change is stagnant, except that it has dropped by 6% on average, between 2007 and 2013.
Apparently, the overall earnings trend is strongly related to changes in catch levels since both sets of values have a correlation index of 76%. Also, the interdependence with respect to the operating expenses seems still very accentuated with an index of 92%. Consequently, the profitability of this category of vessel remains highly dependent on the quantities fished and the margin of maneuver to influence the costs of production.
Category of [250 to 500 hp]: The results achieved by medium motorization boats vary in the study area between 5 and 15 million dinars (Figure 6). Between 1998 and 2007, their growth recorded an average ratio of 4%. After 2007, these profits shrink by an annual average of -3%.
The maximum gain reached before the years of fish crisis, by these companies is close to that of high-powered vessels, which presupposes an optimal use of fishing potential in this category or a low exploitation in the other.
In fact, the sardine sale prices being the same for all categories does not compensate in the same way for the decrease in landings, especially since 2007, given that operating expenses among powers are significantly higher.
The overall variation in the operating results for this category of vessel is only weakly related to changes in catch levels since both sets of values show a correlation index of just 23%. Conversely, the interdependence with respect to operating expenses is significant and is confirmed by an index of more than 90%.
As a result, the profitability of this type of engine can be improved by greater control of operating and investment costs to limit the impact of lower landings. Thus, since the general evolution of revenue appears even stronger than that of the operating expenses, this category of ships confirms more the hypothesis of the influence of the level of the charges on the determination of the receipts (fixing of the prices) and therefore profits.
The professionals of the sea use all the means at their disposal to guarantee their income in a sector where the risk is permanent (climatic hazards, market, equipment, etc.), they act in such a way as to always exceed as much as possible the reference threshold corresponding to the estimation of the charges.
Category of [<250 hp]: The profits of the small motor power evolve on average during the study period from 2 to 11 million dinars (Figure 7); a single boat exception is reached the figure of 14 million dinars. The average rate of change is 9% over the entire period; it is limited to 2% between 2007 and 2013.
The operating results of these vessels are 66% correlated with production levels, which indicates a rather paradoxical fact of saying that the more the production decreases, the better the results. This suggests that the leveling by the selling price, the same for all, perfectly suits this category of power. By their greater number, their fishermen exert a stronger pressure on the fixing of the selling prices which happens to exceed proportionally the shortfall in terms of catches. Their profits are therefore better because they are generated by the increase of the transfer prices according to their desire.
The dependency on operating costs turns out to be very significant with an index exceeding 99%. The profitability of low power is also very strongly linked to the control of operating and investment expenses.
The same thinking developed above remains valid as regards the actions of the various actors in the fishery to ensure sufficiently high levels of income in order to sustain their exploitation. Apparently, the smaller the boat, the better the growth of these benefits.
In fact, after analyzing the level of operating results achieved by the various engines, whether they are strong, medium or low, the turnover generated covers the operating and non-operating costs borne by the shipowners. As a result, it becomes important to measure the degree of profitability of each class of vessel through the calculation of economic profitability ratios.
In general, the average overall rate of return of all surveyed sardines is approaching (see tables in Annex 1). It records 42% for low and medium motorization and 37% for strong mechanization.
Compared with the average evolution, the overall profitability decreases annually by 1% for the category of [500 to 1500 hp], stagnates at [250 to 500 hp], and increases by 1% for the [<250 hp [. Fishing units of the lowest category appear to be the most successful in terms of profitability of input consumption; they reach maximum ratios of 56% against 44% and 45% for high and medium power.
The minimum recorded is 11% for the highest power, followed by 15% for the lowest, while the intermediate engine marks a rate of 30%.
Notably, the maximum rates for the high and middle class are displayed before the fish crisis period, prior to 2007, when the low power reaches it later. The minimum levels, however, are announced for all companies in times of crisis.
The investment in sardine fishing activity in the Bou-Ismail and El-Djemila bays seems more interesting for the lowest type of engine that manages to maintain relatively stable rates of return over a long period. Thus, this type of purse seine, manages to guarantee the creation of new wealth (added value). The same goes for average motorization, except that the trend of this one does not plead for the maintenance of its production rhythms in the long term. The fact remains that a profitability of 42% on average indicates acceptable performance compared to industrial or agricultural activities for example where the transformation of raw materials into finished products does not reach or with difficulty such ratios.
In general, the rate of return of the fishing units recorded in the study area varies between very wide ranges from 0.19 to 577 (see tables in Annex 2). The importance of this amplitude is explained by the fact that some seiners whose acquisition dates back to the early 1970s are already depreciated from an accounting point of view and therefore the value of their total assets is almost zero. On the contrary, the new boats mark a rate not exceeding in general, the figure of 51 among the average power, against 3.71 for the weak and 0.76 for the strong motorization.
This situation favors the efficiency of the production resources, namely the sardine fishery exclusively, insofar as, even after having been fully depreciated, the latter continues to generate added value and profits.
Over the entire period analyzed, the overall trend in the yield ratio is up for all boats (3%, 5% and 8% respectively for high, low and medium power). Rather, this growth reflects the overall decrease in the ratio determinant, in this case the non-replaceable investment that is notionally amortized, primarily to the middle class, and thereby offsets the decrease in the profits generated. by decreasing catches. Nevertheless, from 2007, this rate drops considerably to -8, -9 and -6% in the same order of categories. In fact, landings are falling, especially in 2010, to the point where fish selling prices and the intrinsic value of total assets do not offset the deterioration in net operating results.
Estimation of the capital productivity ratio: Very large differences between the productivity ratios of the vessels surveyed, even if they belong to the same category, are found through the results of calculations reported on the table in Annex 3. The values have intervals, greater than 1500, whereas the lower interval is barely 0.20.
Compared to the class of ships, the high power shows the lowest capital productivity, with indices varying between 0.20 to 3.44 with a standard deviation of 0.28. It turns out that the minimums obtained are found each time among the most “expensive” sardines while the maximums are displayed among those acquired at the lowest price. The difference in the purchase cost results from the difference in tonnage and motive power. In addition, the recent acquisition of this type of boat, whose depreciation is still in its infancy, reduces the importance of the calculated ratio but also refers to the idea that productivity will only be improved in the long run. Term, provided of course that the fishery resource is available.
Thus, compared to the potential level of production of the region, it is not very interesting in terms of productivity to acquire larger or larger vessels.
As for the average and small motorizations, their productivity ratios vary respectively between 0.99 to 95 and 0.90 to 91, with standard deviations of 3.10 and 2.30. Indeed, 8 purse seiners of average power and 6 of the weak present in order, ratios up to 1494 and 838, because already amortized, some remain in service while others have been reformed since 2007 or 2010.
The specificity of the fishing activity in Algeria means that equal level of added value is created in boats of different duration of use; in the bays of Bou-Ismail and El-Djemila, sardines of more than 40 years old are mixed with those of one to two years of exploitation. The regeneration of capital does not necessarily determine better productivity.
The creation of value added in this activity is not so much dependent on the quantity of inputs or raw material consumed. With the exception of fuel, no input is required to obtain production, it is just a catch of fish “ready to use”. According to Mr. Parkin, the dominant thinking in economics is that natural resources, including the fishery resource, are “the non-produced inputs that are allocated to us” [9].
In fact, the productivity ratio is significant only in terms of the size of the fixed assets. In this case, investment in a boat is an activity whose productivity indices can be exceptionally high as the vessel continues to create wealth even after its total amortization and liquidation from an accounting point of view and in despite its obsolescence. Unlike extractive industries that are more reducible to the action of companies and where production depends more on technical solutions.
Estimation of the labor productivity ratio
Added Value / Workforce (hour): Over the entire period analyzed, the results of the labor productivity ratio reported in the table in Appendix 4 show an average annual change of 1%, 4% and 8% for the three categories of boats in the order of the most strong to the weakest. On the other hand, if the analysis is restricted to the 2007-2013 phase, the high and the average power record average annual decreases of -6% and -4% respectively, while the low keeps an increasing rate of 5%.
Compared to the new wealth created, the differences in ratios appear much more between the categories of ships. The highest powers produce between 9 931 and 16 629 Da / hour; against 6,031 and 14,587 Da / hour for the average class and 2,629 and 10,294 Da / hour for the lowest engine.
In contrast to previous findings, the most powerful vessels appear to be the most productive by adding more new value compared to the time devoted to the activity (at least until 2013 given the annual decline in the ratio). The lowest category, on the other hand, seems to be the worst performer per unit of fishing time.
Boats with strong engines emerge above the others as long as they are not counted the positions of loads which encumber the activity and end up reducing the importance of added value created. Indeed, the more expensive maintenance, the number of larger seamen, the banking depreciation and higher equipment, ... decrease in their final operating result and at the same time lose this advantage.
Production / Workforce: The estimated fishing effort productivity rate calculated in weight terms for each fishing vessel in each category of vessel shows that, as of 2007, the productivity per fisherman is constantly decreasing for all classes of motorization (Table 3).
As the number of fish on board has not changed in number but has been better qualified (training), this drop in the ratio is only due to the continued fall in fish stocks. In good fishing season, the seafarer of the middle class appeared as the most productive with 28 T/ year, followed by that of the strong power with 25 T/ year. These ships were clearly distinguishable from the low power which records a difference of 10 T/fisherman/year. In 2013, and following the continued collapse of sardine catches, the differentiation between the three types of boats lost its meaning and the performance of the surveyed personnel seemed almost identical.
The study of economic performance in the Algerian coast reveals a downward trend since 2007, profits made by the sardine fleet. The fall in catches is the main cause, to which is added the rise in operating expenses.
Revenues recorded from this date, are degraded; even though the category of low power vessels is maintaining its relatively increasing levels. Because, it manages to compensate for the decrease of the catches by the price increase, which is not the case for the other classes of motorization. However, the turnover achieved still covers the operating and non-operating expenses incurred by all surveyed ship-owners.
The overall average rate of return of the three categories of boats is getting closer and lower every year. The highest level is found in the lowest engine, and ranks the latter as the most powerful. The rate of return, on the other hand, tends to increase for all the boats, because the sardines, even after their amortization and their liquidation from the accounting point of view, continue to exercise the activity. In terms of capital productivity, the largest and most expensive purse seiners are the least productive. Rather, it depends on the importance of fixed assets that can not sufficiently make the quantity of inputs or raw material consumed (mainly fuel) profitable. If we look at the level of potential production, it is no longer interesting to invest in such a type of boat. Staff productivity has been steadily declining since 2007, while the numbers on board have not changed in number. It is rather the drastic drop in landings that affects the ratio.Thus, for a better preservation of the fishing activity in Algeria and in terms of management of the sardine fishery at the level of the Algerian center, it is advisable to stop the acquisition of vessels with high motive power, more expensive and less expensive profitable. It is necessary to direct the investment towards the most efficient boats, in this case of low motorization; while taking into account the assessments of the Mediterranean Fisheries Management Commission (GFCM), which considers that the stocks of small fish in the western Mediterranean are clearly overexploited, whereas in the rest of the region, are fully or, at best, moderately exploited [10].
We would like to thank the professionals of the sea of Bou Ismail area and El Djemila who helped us in carrying out the economic surveys, by providing the information useful for this work. Our thanks also go to the Ministry and Directorates responsible for fisheries who provided us with the necessary data.