Effect of HPMC K4M Polymeron Gastroretentive Floating Tablets of Venlafaxine Hydrochloride
The objective of the present investigation has developed a gastroretentive floating tablets for sustained release of venlafaxine hydrochloride by direct compression method. Venlafaxine hydrochloride having a short biological half-life of 4 hrs. eliminated quickly from the body leading to low therapeutic efficacy. Therefore a controlled release medication was advantageous so as to achieve the prolonged therapeutic effect. The tablets were evaluated for thickness, weight variation, hardness, friability, drug content; in vitro buoyancy test, in vitro drug release and Fourier transform infrared (FT-IR) spectroscopy. Formulation F3 can be considered as an optimized formulation for gastroretentive floating tablet of venlafaxine HCl. The results of in vitro release studies showed that optimized formulation F3 could sustain drug release 99.18% for 12 hours and remain buoyant for more than 12 hours. This formulation best fit model as matrix and it shows non-fickian type of drug release.
Keywords: Venlafaxine hydrochloride; Direct compression; Gastro retentive drug release; HPMCK4M
Retention of drug delivery systems in the stomach prolongs the overall gastrointestinal transit time, thereby resulting in improved bioavailability [1]. The floating dosage form has been used most commonly. This technology is suitable for drugs with an absorption window in the stomach or in the upper part of the small in testine, drugs acting locally in the stomach [2]. The controlled gastric retention time of solid dosage forms may be achieved by the mechanism of Floatation, Mucoadhesion sedimentation Expansion or by the simultaneous administration of pharmacological agents that delay gastric emptying [3-7]. The principle of buoyant preparation offers a simple and practical approach to achieved increased gastric residence time for the dosage form and sustained drug release [8-11].
Improvement of bioavailability and therapeutic efficacy of the drugs and possible reduction of dose can be achieved with floating drug delivery system [12]. Thus, control of placement of a DDS in a specific region of the GI tract offers numerous advantages, especially for drugs exhibiting an absorption window in the GI tract or drugs with a stability problem [2]. Overall, the intimate contact of the DDS with the absorbing membrane has the potential to maximize drug absorption and may also influence the rate of drug absorption. These considerations have led to the development of oral controlled-release dosage forms possessing gastric retention capabilities. Dosage forms that can be retained in stomach are called gastro retentive drug delivery systems. Gastro retentive drug delivery systems can improve controlled delivery of drugs that have a proximal absorption window by continuously releasing the drug for a prolonged period of time before it reaches its absorption site, thus ensuring its optimal bioavailability. Drugs having narrow absorption window are mostly associated with improved absorption at jejunum and ileum due to their enhanced absorption properties e.g. large surface area, or because of enhanced solubility in stomach as opposed to the more distal parts of the GIT [13].
Venlafaxine is a unique antidepressant, and is referred to as a serotonin-norepinerphrine-dopamine reuptake inhibitor [18]. Venlafaxine and its active metabolite, O-desmethyl venlafaxine (ODV) inhibit the neuronal uptake of norepinephrine, serotonin and to a lesser extent dopamine [19]. Hence it lacks the adverse anticholinergic, sedative and cardiovascular effects of tricyclic antidepressants [14]. The biological half-life of venlafaxine is 5 hours reading to more dosing frequency [15]. Hence, it is necessary to develop a sustained release formulation of venlafaxine HCL.
In this context, it was interested to prepare and evaluate gastroretentive tablets of venlafaxine HCl based on semi synthetic polymer using various concentration of hydroxy propylmethyl cellulose (HPMC) which will retain the dosage form in the stomach and provide the sustained drug release.
Venlafaxine HCl was purchased from Yarrow chem. Products, Mumbai. HPMC K4M from Balaji drugs, Surat. All other reagents were of analytical or pharmaceutical grade.
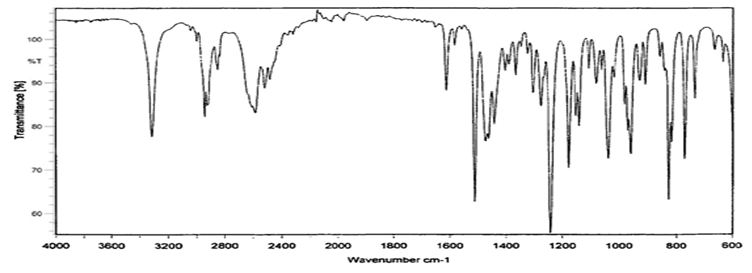
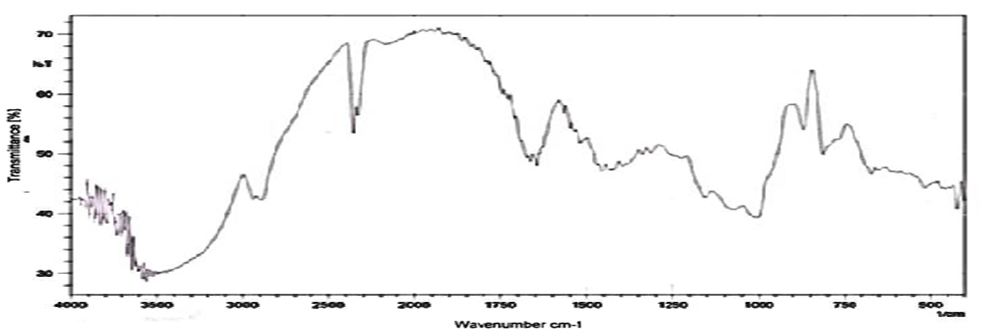
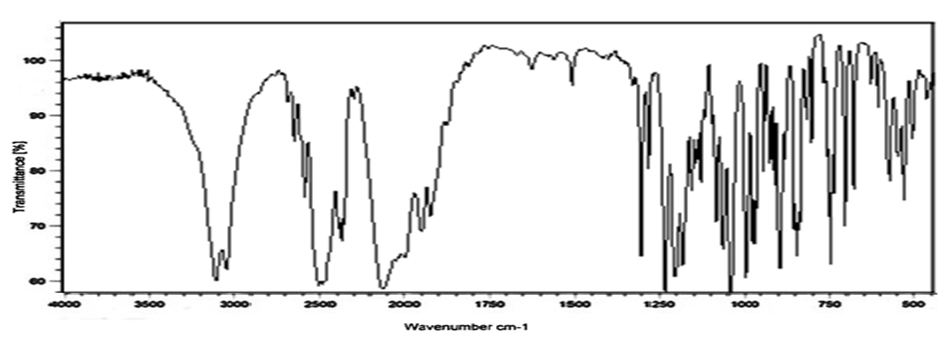
Compatibility studies (Fourier Transform Infrared Spectroscopic studies): The drug-excipient interaction study was carried out using by KBr pellet method. To study the compatibility of various formulation excipients with Venlafaxine HCl, solid admixtures were prepared by mixing the drug with each formulation excipient separately in the ration of 1:1 and it was filled and characterized by using Fourier transform infrared spectroscopy (Figure 1, 2 and3).
Preparation of Venlafaxine HCL Floating Tablets Method: Direct Compression Method Tablet containing 75mg of venlafaxine HCl were prepared according to the design depicted in Table 1 by direct compression method. The weighed quantity of respective powders, namely the active ingredient Venlafaxine HCl; release modifying polymer HPMC K4M; effervescent producing agents sodium bicarbonate and tartaric acid; ethyl cellulose binder; lactose diluent were passed through sieve no:60, seperately. Mixing of powder was carried out using a pestle in a mortar for 10 minutes. Magnesium sterate and talc were then added to the mixed powders. Mixing was continued for another 5 min. Finally 400 mg of the powdered mixture was weighed approximately and fed manually into the die of a multistation rotary tablet press to produce the desired tablets [14-16] (Table 2 and 3).
In Vitro Evaluation of Prepared Tablets:
Thickness: Control of physical dimension of the tablet such as thickness is essential for consumer acceptance and tablet uniformity. The thickness and diameter of the tablet was measured using Vernier calipers. It is measured in mm [17,20-22].
Hardness: Hardness indicates the ability of a tablet to withstand mechanical shocks while handling. The Monsanto hardness tester was used to determine the tablet hardness. The tablet was held between a fixed and moving jaw. Scale was adjusted to zero; load was gradually increased until the tablet fractured. The value of the load at that point gives a measure of hardness of the tablet. Hardness was expressed in Kg/cm2.Three tablets were randomly picked and hardness of the tablets was determined.
Friability: Tablet strength was tested by using Roche Friabilator. 20 tablets were weighed and placed in the friabilator and operated at for 100 revolutions (4min), taken out and were dedusted. The percentage weight loss was calculated by,
Weight variation: Ten tablets were selected randomly from each batch were weighed individually and together in a single pan balance. The average weight was noted and standard deviation calculated. The tablet passes the test if not more than two tablets fall outside the percentage limit and none of the tablet differs by more than double the percentage limit.
Where, PD = Percentage deviation,
W avg = Average weight of tablet,
W initial = individual weight of tablet
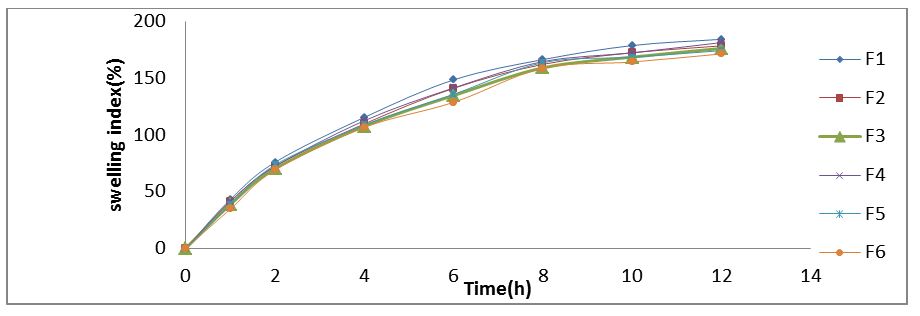
Swelling Index:Measurement of swelling rate of the floating matrix tablet was carried to gain insight the observed phenomenon of drug release with the rates of polymer hydration. Swelling index of the dosage form is conducted by using USP dissolution apparatus-II in 900 ml of 0.1N HCl which is maintained at 37±0.5 °C, rotated at 50 rpm. At selected regular intervals, the tablet was withdrawn and the excess water was blotted with tissue paper and the swelling index was calculated using following formula (Table 4).
% Swelling Index = {(Wt) – (Wo)/ (Wo)} x 100
Where, Wt = weight of the swollen tablet
Wo = of the initial weight tablet.
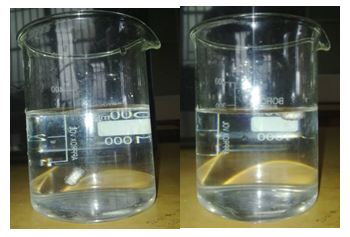
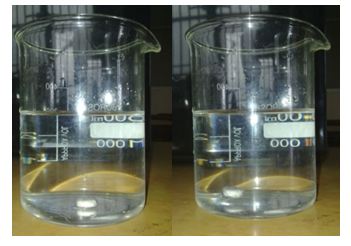
Buoyancy studies: The in-vitro floating behavior (buoyancy) of the tablets was determined by floating lag time. The tablets were placed in 100 ml beaker containing 0.1 N HCl (pH 1.2). The floating lag time and total floating time were determined (Table 5) (Figure 4a and Figure 4b).
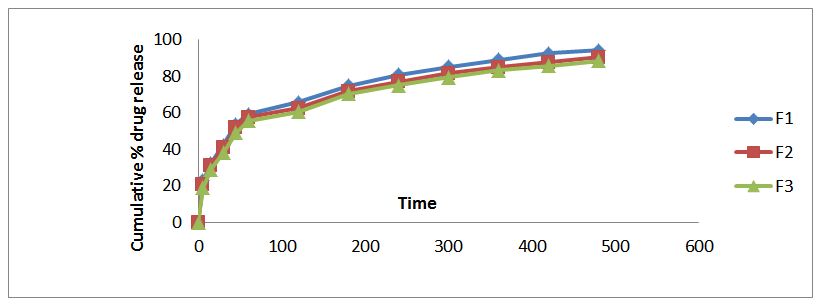
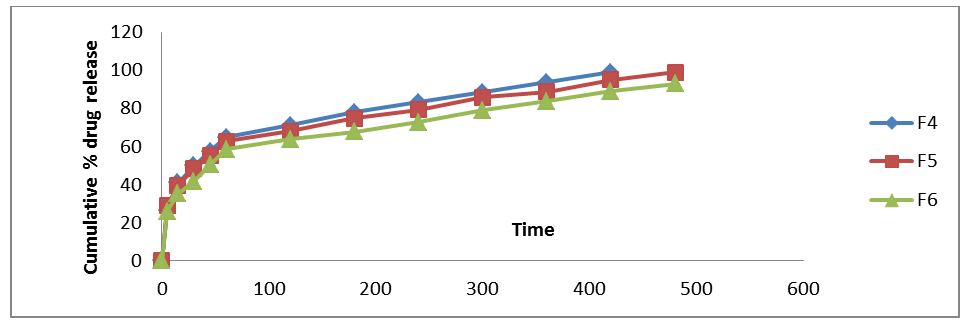
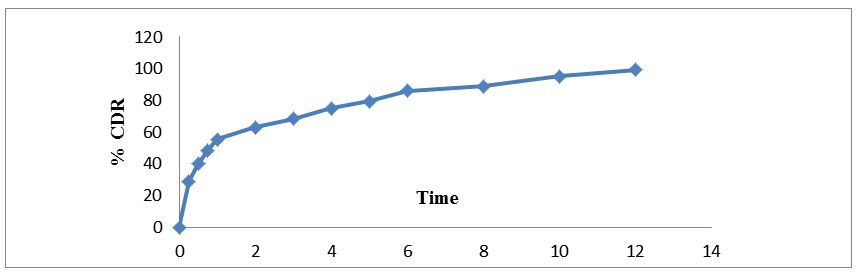
In-Vitro release studies for floating tablets: The drug release rate was determined using USP dissolution apparatus II. Dissolution media was 900 ml of simulated gastric fluid (pH 1.2) maintained at 37± 0.1 ˚C and stirred at 50 rpm. Samples were withdrawn at suitable time intervals and compensated with fresh dissolution medium and assayed spectro photometrically at 225nm in Shimadzu U.V. Samples were assayed in triplicate. %Drug release, order and mechanism of the release were determined by the absorbance values obtained [20-22] (Table 6) (Figure 5 and6).
Venlafaxine HCl is a highly effective antidepressant was used as a model drug to develop a controlled release formulation. Venlafaxine HCl exhibits pH dependent solubility. It is more soluble in acidic pH and slightly soluble at neutral or alkaline condition (intestinal environment). Venlafaxine HCl which increased the bioavailability of Venlafaxine HCl and also to reduce frequency of administration, thereby improving patient compliance and therapeutic efficacy.
Six different formulations were prepared by direct compression, incorporating polymer HPMC K4M as swelling polymers, sodium bicarbonate as gas generating agent, ethyl cellulose as a diluents, talc used as glidant and magnesium stearate used as lubricant.
The compatibility studies confirmed that the absence of chemical interaction between drug and the polymer. The results showed that there was no significant dug-polymer interaction.
Hardness of the tablets ranged from 5-6 kg/cm2 indicating good integrity of the tablets and the friability of all formulations were in the permissible range of less than 1%. All formulations were within permissible limits of weight variation. Thus all the physical parameters of compressed tablet are practically with in control.
Evident from the in vitro dissolution data that increase in HPMC K4M concentration decreases the release rate this might be due to increase in diffusion path length, which the drug molecule may have to travel. Thus the formulation F5 was selected as the optimized formulation.
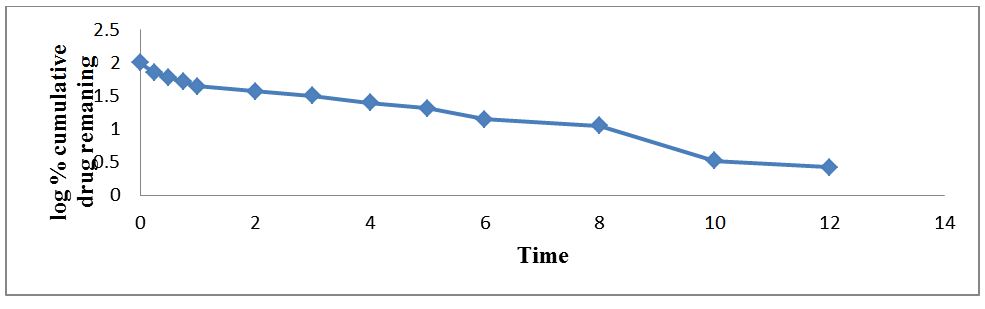
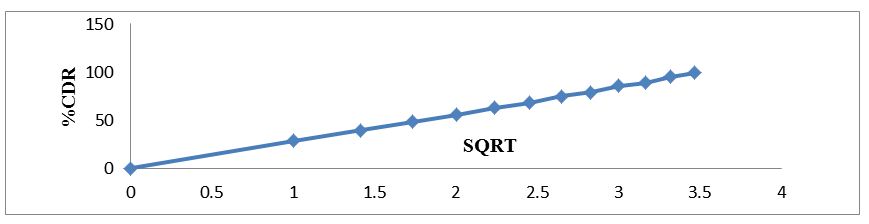
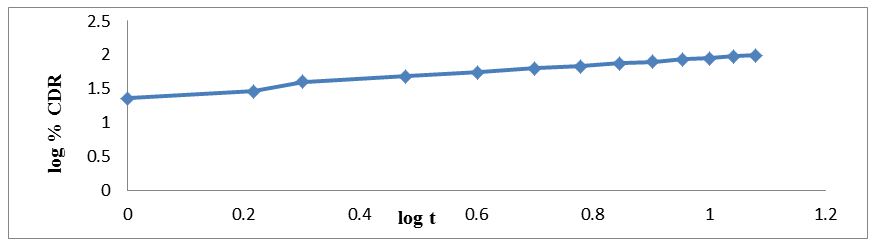
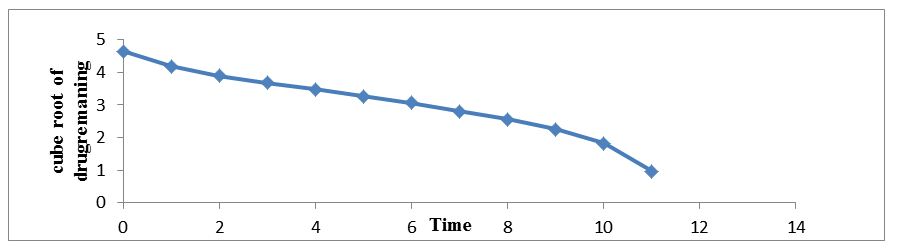
The regression coefficient value for Zero order, First order, Higuchi’s, Hixon-crowell and Korsmeyer Peppa’s models for optimized formulation F5 was found to be 0.929, 0.996, 0.997, 0.994 and 0.962 respectively (Figure 7,8,9,10 and 11). The optimized formulation F5 followed Higuchi’s kinetics, since the regression coefficient is 0.997 also plots were found to be linear, which indicates that the drug release depended on the square root of the time and predominantly controlled by diffusion process. The mechanism of drug release was predicted using Korsmeyer–Peppa’s equation. The n value of optimized formulation F5 is 0.55 respectively and is between"0.45 to 0.85". This indicates that the drug release depends on swelling, diffusion, and erosion. All formulations follow non-Fickian/anomalous type of diffusion.
Floating tablet of venlafaxine HCl was formulated as an approach to increase gastric residence time and there by improve its bioavailability. Formulation F5 showed better controlled drug release in comparison to the other formulations, the extent of drug release was found to be 98.05% at the desired time 12 hrs. The drug release pattern of formulation F5 was best fitted to Higuchi model and first order kinetics. Further the results reflect that release of drug from the tablets by non-fickian diffusion or anomalous diffusion. Drug- excipients interaction of formulations F5 was carried out by using FT-I spectroscopy in this analysis drug excipients interactions was not observed. Hence it was concluded that formulation F3 can be taken as an ideal or optimized formulation of gastroretentive tablets for 12 hours as it fulfils all the requirements for extended release tablet.
The authors acknowledge National College of Pharmacy, Manassery, Kozhikode, Kerala for necessary support.