Effect of NPKS on Growth and Yield of Naga Chili (Capsicum Chinense Jacq.)
The experiment was conducted at Spices Research Sub-station, CRS, and Jaintiapur in Rabi season of 2014-15 for selecting proper dose of NPKS for naga chilli Production. There were 14 treatment combinations comprising four levels each of N (0, 80, 100 and 120 kg/ha), P (0, 50, 75 and 100 kg/ha), K (0, 100, 120 and 140 kg/ha) and S (0, 10, 20 and 30 kg/ha). The experiment was laid out in Randomized Complete Block Design with three replications. There were significant variations among the treatments with plant height (cm), canopy spreading (cm), stem diameter (cm), Number of fruits per plant, fruit weight (g), fruit length and diameter (cm), pericarp weight (g), number of seeds per fruit, 1000 Seed weight (g), and fruit yield (t/ha) of naga chilli. The taller plant, highest stem diameter and canopy spreading of naga chilli plants were achieved from the treatment N100 P50 K120 S20 (T6) while the control (native nutrient) exhibited the lowest. The maximum yield were obtained from N100 P50 K120 S20 (25.77 t/ha) followed by N100 P75 K120 S20 (24.83 t/ha) and N80 P75 K120 S20 kg/ha (24.40 t/ha) where as the control plots yielded the minimum (8.75 t/ha). Application of N100 P50 K120 S20 kg/ha (T6) appear to be the best treatment for maximizing the growth and yield of naga chilli for Sylhet region. The application of N100 P50 K120 S20 (T6) t/ha (T6) also showed significantly higher gross return (910 Tk./m2) and Marginal increase in Gross return (253.75 Tk./m2) over rest of the treatments. While Marginal rate of return was significantly higher (33833.33%) with the application of N100 P50 K120 S20 kg/ha (T6) over rest of the treatments. The minimum gross return (395.06 Tk/m2) was received in control.
Keywords: Growth; Yield and Naga Chilli (Capsicum chinense Jacq.)
Naga Chilli (Capsicum chinense Jacq.) are the member of the Solanaceae family (tribe Solaneae, subtribe Capsicinae), also known as the world’s hottest chilli entered in the Guinness book of world record (2006) with a pungent level of 879,953 to 1,001,304 SHU (Adriana, et al., 2008) [1]. Naga chilli is traditionally cultivated in hilly orchard along with citrus. Due to its extra-ordinary pungency level, oleoresin powder extracted from Naga chilli is predicted to dominate the world market in coming years as the mainstay for riot control (Ritesh, et al., 2000) [2].
The Naga Chilli plant is wonderful gift of nature as it possesses a pleasant and palatable aroma. The crop is native to the North eastern part of Bangladesh, growing in Brahmaputra flood plain (Bhagowati, et al., 2009) also known as Naga Morish or Dorset naga (that derivative from Bangladesh) [3]. Naga Chilli is an interspecies hybrid, mostly Capsicum chinensis with some Capsicum frutescens genes. The plant grows to a height of 57-129 cm at 6 months. It may even grow taller in semi-perennial situation. The leaves have a characteristic crinkle look. Flowers are greenish white with a touch of light brown. The anthers are blue while the filaments are purple. Fruits are light green, creasy white and dark green which turn bright red at maturity. The fruit posses 4-5 locules and bears about 25-35 slightly rinkled seeds. There are at least three distinct colours found like light red, dark red and orange (Bhagowati, et al., 2009) [3].
Naga chilli is grown successfully in North-eastern region of Bangladesh during the Rabi season (Rashid, 1999) [4]. But the acreage is not satisfactory due to the unawareness of the growers on production technology. The average yield of Naga chilli in Bangladesh was 4.5-5.5 ton/hectare (personal experience). This yield is relatively low compared to that of other Naga chilli producing countries like, UK (51.88 t/ha), Sweden (54.35 t/ha), Austria (56.70 t/ha) and Israel (64.20 t/ha) (FAO, 2010) [5]. Production of Naga chilli could be increased in many ways; of which the most important one is the judicious nutrient management; for healthy growth of plants and optimum yield (Grewal and Trehan, 1979) [6].
The effect of the individual nutrient on the plant development has another major impact on the fertilizer requirements. Nitrogen, phosphorus and potassium are critical for chilli growth and development (Jones, 2008) [7]. Nitrogen is associated with vegetative and biomass accumulation (Rai, 1981, Haque, et al; 2015, Maksudul Haque, et al; 2015, Haque, et al; 2014), phosphorus to seed and root development (Mitra. et al., 1990) and potassium is associated with fruit development, quality and manufacture of sugar and starch; important in a multi-nutrient fertilizer application (Brady, 1995) while sulphur is associated with synthesis of amino acids, co-enzyme, thiamine and chlorophyll (Tisdale, et al., 1984) [8-14]. Thus, the synchronization of nutrients availability through right dose of fertilizer application is recommended to optimize yield, fruit quality, and mineral nutrient efficient use without threatening sustainability. Therefore increasing the yield of this crop by judicious application of optimum rate of nutrients especially N, P, K and S is an urgent need and has sufficient scope (A.A. Yusuf and H.A. Yusuf, 2008, R. Biswash, et al., 2015) [15,16].
There is a great possibility to improve its production and quality through proper nutrient management. The present study was, therefore, undertaken to find out the proper combination of fertilizer nutrients (NPKS) for higher and sustainable yield of Naga chilli.
The experiment was conducted at spices research sub-station, CRS, Jaintiapur. The experimental plot was located under AEZ 22 with sandy loam soil having extremely acidic (5.9) pH. The experiment was conducted using a randomized complete block design with 14 treatment combination and replicated thrice. The combinations were: T1 = N0 P75 K120 S20 kg/ha, T2 = N80 P75 K120 S20 kg/ha, T3 = N100 P75 K120 S20 kg/ha, T4 = N120 P75 K120 S20 kg/ha, T5 = N100 P0 K120 S20 kg/ha, T6 = N100 P50 K120 S20 kg/ha kg/ha, T7= N100 P100 K120 S20 kg/ha, T8= N100 P75 K0 S20 kg/ha, T9= N100 P75 K100 S20 kg/ha, T10= N100 P75 K140 S20 kg/ha, T11= N100 P75 K120 S0kg/ha, T12= N100 P75 K120 S10 kg/ha, T13= N100 P75 K120 S30kg/ha, T14= N0 P0 K0 S0 kg/ha (Native Nutrient). Naga chilli advanced line CC Jai-018 was used for this experiment. The plot size was 1.2m×2 m. The experimental field was ploughed and laddered for preparing the beds. The experimental area was divided into three blocks each consisted of 1.2×2 m sized 14 unit plots. The blocks and plots were spaced at 0.5 m which was used as drain. The seeds were sown in 15th December, 2014 and 45 days old seedlings were planted in the experimental field on 31st January 2015 maintaining 60×50 cm spacing. A blanket dose of 10 ton cow dung, 4 ton dolomite lime, 2 kg B and 4 kg Zn per hectare were applied. Chemical fertilizers were used as per treatment. Dolomite lime was applied after first ploughing and the plots were left for fifteen days. A general application of Cow dung @ 10 t/ha, full dose of TSP and Gypsum, half dose of MoP was applied during final land preparation. Urea and one third of MoP fertilizer were applied in four equal installments after 25, 50, 75 and 100 days after transplanting. Two times flood irrigation was provided in February and March and two hand weeding were performed at 25 and 50 days after transplanting (DAT). Harvesting of green chillies were started at first week of April and continued up to June. Data was recorded on growth characteristics, yield and yield contributing characters, incidence of pests and diseases. All the data collected was statistically analyzed by MSTAT-C package program for interpretation of results (Gomez and Gomez, 1984) [17].
All the growth parameters showed significant variation among the treatments. T3 (N100 P75 K120 S20 kg/ha) was superior in case of plant height, stem diameter and canopy width (Table 3). Lowest plant height, stem diameter and canopy width was recorded in absolute control T14 treatment.
Qualitative fruit characters as affected by different levels of NPKS were measured in 2014-15 and significant variation was found. The maximum fruit size (6.63 cm × 3.03 cm) was obtained from T3 (N100 P75 K120 S20 kg/ha) followed by T9 (N100 P75 K100 S20 kg/ha). The highest pericarp weight (4.99 g) was obtained from T4 (N120 P75 K120 S20 kg/ha) which was statically similar with T12 (N100 P75 K120 S10 kg/ha) and T13 (N100 P75 K120 S30 kg/ha) while lowest (2.97 g) was found from control. Treatment T3 (N100 P75 K120 S20 kg/ha) produces maximum number of seeds per fruits (39.54) and minimum was found from control. Highest (12.20 g) 1000 seed weight was obtained from T3 (N100 P75 K120 S20 kg/ha) while lowest (9.07 g) was found from control (Table 4).
The maximum number of fruits per plant (208) was found from the treatment T3 (N100 P75 K120 S20 kg/ha). The highest Individual fruit weight (4.56 g) was obtained from T9 (N100 P75 K100 S20 kg/ha) treatment. The maximum yield per plant (927.8 g) was recorded from T3 (N100 P75 K120 S20 kg/ha). Similarly highest yield per hectare (25.77 t/ha) was obtained from T3 (N100 P75 K120 S20 kg/ha) which was followed by T6 (N100 P50 K120 S20 kg/ha) (24.83 t/ha) and T2 (N80 P75 K120 S20 kg/ha) (24.40 t/ha) while the lowest (8.75 t/ha) were found from control (T14) treatment) (Table 5).
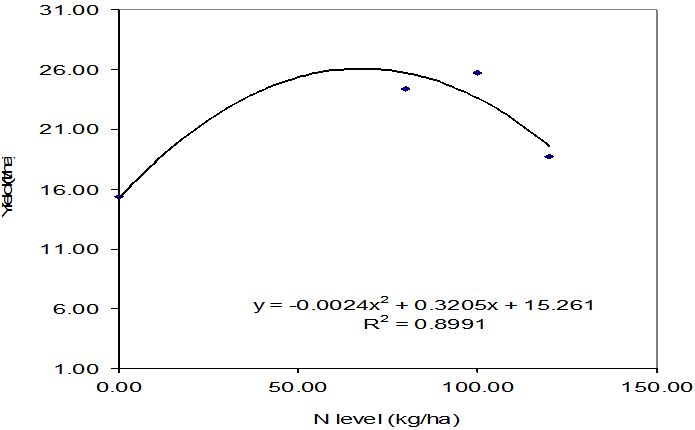
Nitrogen, phosphorus, potassium and sulphur markedly influence the fruit yield of Naga chili (Table 6). All fertilizer treatments significantly increased the fruit yield over the control. Fruit yield increased progressively with the increasing rates of N up to 100 kg /ha. Nitrogen application @ 80, 100 and 120 kg /ha increased Fruit yield by 58.96, 67.89 and 21.95% over the N control treatment.
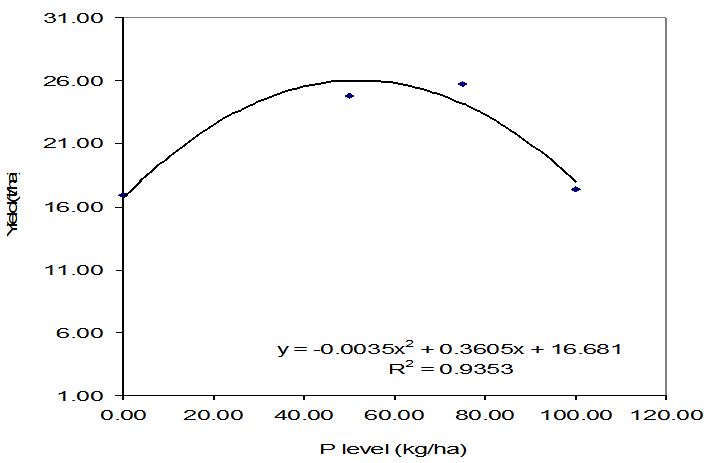
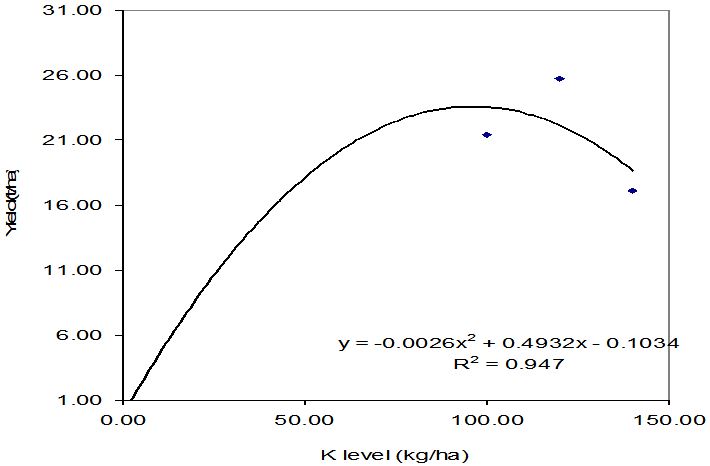
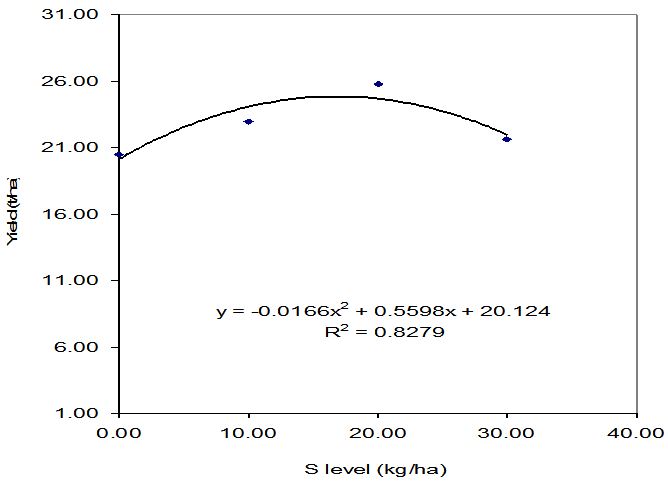
Progressively significant increase in fruit yield was observed for the additional rates of phosphorus up to 75 Kg/ha. The application of 50, 75 and 100 kg/ha increased the fruit yield by 47.10, 52.67 and 3.08% over P-control (Table 6). Potassium increased fruit yield significantly up to 120 kg /ha. The highest increase in Fruit yield over K-control due to K application was 92.31% (Table 6). Addition of 20 kg /ha S increased 25.77% fruit yield over S-control treatment.
Positive but quadratic relationship was observed between fruit yield of Naga chili and added nutrients (N, P, K and S) (Figure 1,2,3 and 4). Regression analysis showed a quadratic relationship between yield and applied nitrogen, phosphorus, potassium and sulphur. Positive but quadratic relationship was observed between fruit weight of Naga chilli and added nutrients (N, P, K and S). (AKM Shalahuddin, et al., 2018) [18,19].
From the regression equation, the optimum dose of Nitrogen and Phosphorus were 66.7 kg/ha and 51.5 kg/ha. In case of potassium, the optimum dose was worked out as 94.9 kg/ha. Similarly, the optimum dose of sulphur was found to be 16.9 kg/ha1. Beyond the said optimum dose, there is a possibility of loosing certain amount of yield of higher level of nutrients were applied (Table 7).
Gross return was calculated from the price of naga chilli. Variable cost was calculated from the costs involved for fertilizer used for the experimental treatments. The partial budget analysis of fertilizer showed that the gross return from the control plot was Tk. 395.06 /m2 and the application of fertilizer increased the gross return up to Tk.910.00/ m2. The gross margin ranged from Tk. 395.06 /m2 to Tk. 907.99/m2. The maximum mean gross margin of Tk. 907.99/m2 was achieved with the treatment of N100 P50 K120 S20 kg/ha (Table 5).
Dominance analysis shows that the treatments ofN0 P75 K120 S20 kg/ha, N80 P75 K120 S20 kg/ha, N100 P75 K120 S20 kg/ha, N120 P75 K120 S20 kg/ha, N100 P75 K100 S20 kg/ha, N100 P75 K0 S20 kg/ha, N100 P75 K100 S20 kg/ha, N100 P75 K140 S20 kg/ha, N100 P75 K120 S0 kg/ha, N100 P75 K120 S10 kg/ha, and N100 P75 K120 S30 kg/ha are cost dominated irrespective of this experiment.
Marginal analysis (Table 6) showed that the highest marginal rate of return (MRR) of 33833.33% was obtained from the treatment of N100 P50 K120 S20 kg/ha (T6) followed by that of N100 P75 K120 S0 kg/ha 20729.37%. Hence, application of N100 P50 K120 S20 kg/ha would be economically acceptable for the naga chilli production in the hilly region of Piedmont plains soil (Table 8 and Table 9).
From the regression analysis, it can be concluded that about 66.7 kg N, 51.5 kg P, 94.9 kg and 16.9 kg S per hectare was found optimum for Naga Chili cultivation in Spices Research Sub-station, CRS, Jaintiapur, and Sylhet.