Effectiveness of Innovative Bimanaual Therapy for the Children with Hemiparetic Cerebral Palsy –A Randomized Control Trail
Background: Hemiplegic or ‘Unilateral’ Cerebral Palsy affects the muscle tone and movement on one side of the body in which the upper extremities are more affected than the lower extremities. Children with hemiparetic cerebral palsy often have difficulty in performing activities which rely on the coordinated use of both hands because of movement difficulties of the affected hand. This study aims to compare the efficacy of Conventional Physiotherapy and Innovative Bimanual therapy to improve the bilateral upper limb functions among the children with hemiparetic cerebral palsy.
Methods:20 children with hemiparetic cerebral palsy were randomized to the Conventional and Bimanual group. Interventions lasted for 12 weeks, 2hrs/day. Children Hand arm use Experience Questionnaire (CHEQ) was used to assess the bilateral upper limb functions before and after the intervention.
Results: Both groups showed significant improvements on bilateral upper limb functions. When comparing both interventions significant difference was observed in Bimanual therapy group than Conventional Physiotherapy group.
Conclusion: Bimanual therapy is an innovative technique to improve the upper limb functions for the children with hemiparetic cerebral palsy through Play way method.
Keywords: Cerebral Palsy; Bimanual Therapy; Conventional Physiotherapy; Children Hand Arm Use Experience Questionnaire
Cerebral Palsy (CP) is a static neurologic condition resulting from brain injury that occurs before cerebral development is complete. Because brain development continues during the first two years of life, CP can result from brain injury occurring during the prenatal, perinatal or postnatal periods. The term “Cerebral Palsy” describes a group of disorders of movement and posture due to a defect or lesion of the immature brain. The incidence of cerebral palsy is 2.0 to 2.5 per 1000 live births [1].
Children with CP may experience many issues due to their physical limitations. Spastic hemiparesis is a unilateral paresis with upper limbs more severely affected than the lower limbs. Hemiplegic cerebral palsy affects around 1 in 1300 live births [2].
Hand functioning requires the integrity of the central nervous system and therefore may be disturbed by brain disorder of cerebral palsy. As a result, skilled hand movements do not develop normally and several daily activities requiring the use of the hands are difficult or even impossible to carry out. Their movements may jerky, exaggerated and poorly coordinated. They may be unable to grasp objects with their fingers. If they try to control, they may become even more jerky. Children with unilateral spastic CP seldom use their paretic hand spontaneously in daily activities [3].
The children with hemiplegic CP rarely use their impaired hand for unimanual tasks. This hand is typically used when they need it, i.e. during bimanual task performance. Bimanual actions are more complicated than unimanual actions as the movements of both arms and hands must be coordinated temporally and spatially to complete a task or achieve a desired goal. With many everyday tasks requiring cooperative use of both hands, poor bimanual Performance is often the greatest functional impairment for Children with Hemiplegic Cerebral Palsy [4].
Conventional Physiotherapy is the therapy that is widely used and practiced method which includes passive movements, active exercises, passive stretching, resisted exercises and weight bearing activities etc. [5].
Bilateral or Bimanual Training is a new class of interventions aimed to increase the efficiency of movement in context of using both hands together. Bimanual upper limb therapy consists of carefully planned practice of two-handed or bimanual games and activities to facilitate child’s ability to use their hands together. Unlike unilateral impairments, these bimanual coordination problems may underlie some of the functional limitations such as dressing, eating and playing sports and this logic forms the basis for new bimanual assessments [6].
Bimanual training is given through play way method. Playing is the activity that brings the most joy into the young lives of children. It’s an activity that allows children to build self-confidence, interact with other children and learn about him or her [7].
A Randomized control trail
The Universe consisted of 45 Children with different types of Cerebral Palsy who received therapy from 4 Rehabilitation Centres in and around Coimbatore. Out of this Universe 20 Hemiparetic Cerebral Palsy subjects were selected based on inclusive and exclusive criteria. They were divided in to 2 groups Group A (Control Group) and Group B (Experimental Group) each group consists of 10 samples. The written consent was obtained from their parents after giving clear instructions regarding the treatment procedure and its implications.
➢ Diagnosed hemiparetic cerebral palsy
➢ Both gender with children aged 8 to 12 years
➢ Moderate levels of muscle tone (i.e. 1-2, modified Ashworth scale)
➢ Able to actively perform reach and grasp/release activities with verbal prompting.
➢ Sufficient co-operation and cognitive understanding to participate
➢ Prior upper limb surgery
➢ Uncontrollable seizures
➢ Botulinum toxin injection in the upper limb within 6 month prior to study
➢ Visual and cognitive problems
The Children’s Hand Experience Questionnaire (CHEQ) is a 29-item questionnaire of independence in typical daily bimanual activities using the affected/hemiplegic hand with good reliability and item validity reported. The Children’s Hand-use Experience Questionnaire (CHEQ) is a questionnaire designed for children between 6 to 17 years of age with functional limitations in one hand. The CHEQ describes the use of the assisting hand during various activities that are typically completed with two hands. The CHEQ records if a client performs the task; if yes, do they use two hands to complete the task? If two hands are incorporated in performance than the questionnaire uses a four-point scale to describe three components of use: how effective is grip or support of the assisting hand, how does the time to completion compare with peers, and how bothered by the use of the affected hand? This questionnaire can be completed by apparent or child [8].
20 hemiparetic cerebral palsy children were selected for the study and divided in to 2 equal Groups; Group A and Group B. Group A received Conventional Physiotherapy and Group B received Bimanual Training for a period of 12 weeks. Consent was obtained for the participation of the child from the child’s parent prior to enrolment. Pre evaluation was done by CHEQ. Both the group children were treated for 2 hours daily and that was continued for 12 weeks. Post intervention readings were taken after 12 weeks on the same outcome parameter. In conventional group, children were treated with passive movements, stretching exercises, active exercises, weight bearing activities and resisted exercises [9]. Bimanual activities were selected and directions were given to the child before the start of each task in order to specify how each hand would be used during the activity and to avoid use of non-involved extremity only. If a child attempted to use the non-involved hand, the task was paused and the child was reminded of the task rules, at the same time avoid urging the child to use his/her involved hand. Task difficulty was graded by speed and accuracy.
The principle of bimanual therapy is to promote intensive practice and repetition in part- and whole-task movements, increasing complex bimanual skills, in timing, accuracy and fine manipulation. The training includes Bottle and marbles, activities, Dough activities, Throwing or catching different sized balls, Transferring cube from non-affected to the affected hand and towering cubes, Stacking rings, Stringing beads, Alternate banging and clapping movements, Fastening clothing, button and unbutton buttons, open and close zip, Twist the lid of the jar, Twist and press a lock and its key and Cutting of paper by scissors.The data were collected from the samples and they were processed with the application of paired t- test for pre and post intervention; unpaired t- test was used to compare the outcome measurement.
The aim of the study was to find and compare effectiveness of Conventional Physiotherapy and Bimanual therapy in the management of bilateral upper limb functions among children with hemiparetic cerebral palsy.
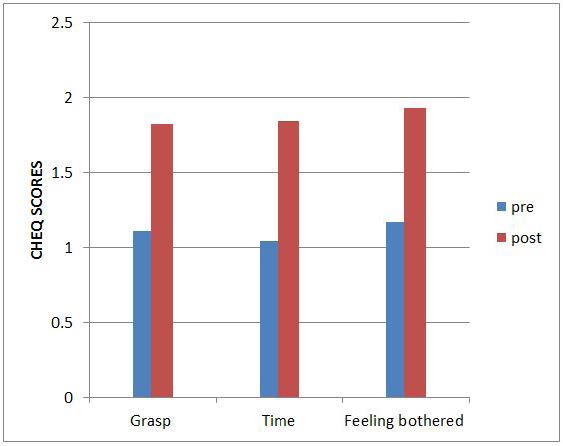
The table 1 shows the pretest mean, posttest mean, mean differences, standard deviation and paired ’t’ value of CHEQ variables grasp, time and feeling bothered. The calculated paired ’t’ value for grasp, time and feeling bothered are respectively 17.25, 12.16 and 13.34. Hence the calculated spaired ’t’ values are more than ‘t’ table value 3.25 at 0.005, it is concluded that there is significant difference between all the pre and posttest values of CHEQ variables following conventional physiotherapy. That is conventional physiotherapy is effective in improving bilateral upper limb functions among children with hemiparetic cerebral palsy.
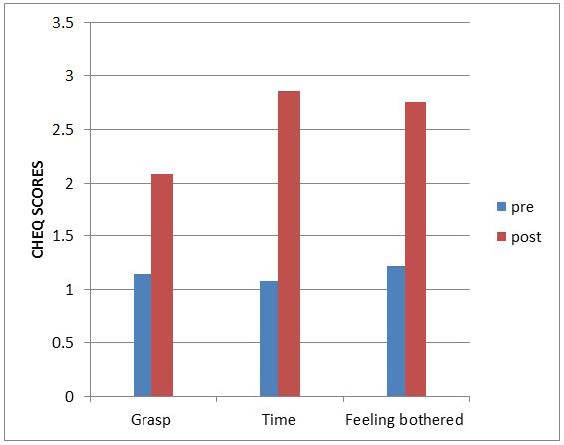
The Table 2 shows the pretest mean, posttest mean, means differences, standard deviation and paired ‘t’ value of CHEQ variables grasp, time and feeling bothered. The calculated paired ‘t’ value for grasp, time and feeling bothered are respectively 23.57, 22.49 and 20.27. Hence the calculated paired ‘t’ values are more than ‘t’ table value 3.25 at 0.005, it is concluded that there is significant difference between all the pre and posttest values of CHEQ variables following bimanual therapy. That is bimanual therapy is effective in improving bilateral upper limb functions among children with hemiparetic cerebral palsy.
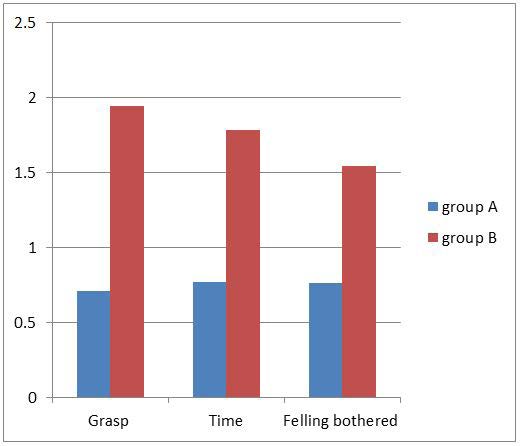
The Table 3 shows mean values, mean differences, standard deviation and unpaired ’t’ value of CHEQ variables grasp, time and feeling bothered. The calculated unpaired ’t’ value for grasp, time and feeling bothered are respectively 11.45, 9.40 and 8.07. Hence the calculated unpaired ’t’ values are more than ’t’ table value 2.878 at 0.005, it is concluded that there is significant difference between conventional physiotherapy and bimanual therapy in the managemen of CHEQ variables.
When comparing the mean values of group A and B, group B subjects treated with bimanual therapy shows more difference in CHEQ values than group A subjects treated with conventional therapy, hence it is concluded that bimanual therapy is more
Present study was done to find out the effectiveness of conventional therapy versus bimanual therapy to improve the bilateral upper limb functions in children with hemiparetic cerebral palsy.
The conventional physiotherapy had been proven to be effective in improving functional activities of upper limb. The result came in agreement with [5,10,11]. Most conventional treatments endeavor to reduce hand impairments by normalizing movement patterns, stretching spastic muscles, strengthening weakened muscles etc., assuming that body impairments are largely responsible for the difficulties experienced in daily activities.
However, the ICF stresses the importance of addressing the impact of CP on the child’s hand functioning beyond the body level. The ICF has contributed to a recent shift away from body functions and toward the activities and participation perspectives. Recent neuro rehabilitation concepts have emphasized what children do in their actual environment, rather than what they can do in a standardized environment [12].
Bimanual Training or hand–arm bimanual intensive therapy (HABIT) is newly developed activity-based interventions, provide evidence for the improvement of hand functioning. The bimanual therapy had been proven to be effective in improving upper limb functions in hemiparetic cerebral palsy. The result came in agreement with [13-16]. Functions of damaged brain areas can be taken over by other, non-affected, regions of the brain. This process is known as cortical reorganization and is based on the principle of brain plasticity.
Brain plasticity and cortical reorganization are thought to be strongly correlated with movement intention and appropriate proprioceptive feedback. Therefore, it is important to target both pathways simultaneously during rehabilitation. By strictly focusing on the execution of the movement pattern, conventional approaches fail to meet these criteria. Recently an alternative approach is surging, based on the idea that the execution of the movement pattern should agree with the motion as intended. Bilateral practice may result in changes in cortical representations and excitability in the undamaged hemisphere [17].
Bimanual therapy is an effective innovative treatment than conventional physiotherapy to improve the bilateral upper limb functions among the children with hemiparetic cerebral palsy.