Epidemiological Study of TB as Major HIV-AIDS Co-Infection
Background: India having less than 1 percent of the global land mass, houses more than 16 percent of the world’s population, which is more than that of South America, Africa, and Australia, combined. Exceedingly large population coupled with lack of education, poverty and subhuman living condition makes India vulnerable to the epidemics of HIV and its associated co-morbidity especially tuberculosis. This threat is looming large on one of the state of India, i.e. Madhya Pradesh that houses one of the largest tribal populations.
Methods: This chapter investigates the HIV-TB epidemics in the four sub-divisions/blocks of Anuppur district of Madhya Pradesh. The epidemiological investigation includes trend, prevalence, distribution and management related issues. Data was collected as secondary data from all four subdivisions/blocks of district Anuppur through inventories and records from Anuppur district hospital and subjected to Chi square summary statistical analysis like Pearson Chi square, Likelihood ratio and Linear-by-linear association. Pearson Chi square is utilized to ascertain the relation between observed and expected data with and its relation with given variables. Likelihood ratio was utilized to compare the Goodness of Fit of Null model and Alternative model. While Linear-by-linear association to analyze the strength of linear relationship between the variables. Analysis also investigates the relationship between the distribution of HIV and HIV+TB in different blocks and sub-divisions of Anuppur district and also the gender (male, female ANC and female non ANC) based distribution of HIV and HIV+TB.
Results: Results show that number of cases of HIV+TB and HIV-TB varies in different blocks of Anuppur. HIV positive cases also vary in different blocks of Anuppur district. Number of HIV+TB and HIV-TB cases were found to be more in female ANC as compared to non-ANC females and males. Result was discussed in terms of viral spread through hetero- and homosexual relation, pregnant females, migrant workers, injectable drug users and labourer’s socio-economic dynamics.
Conclusion: De-escalation of HIV-TB epidemics requires dispelling the myth and stigmas associated with it, so that people with infection may come out in open and seek the palliative therapy.
Keywords: MDR-TB; Mycobacterium; RNTCP; HAART; DOTS; Trend Analysis
“HIV is not something that “guilty” people get. It is not a punishment for cheating, lying, using drugs or alcohol, having more than one partner, or not asking the right questions. It is a virus whose transmission is fuelled by poverty, ignorance, racism, sexism, homophobia, fear, violence, and many other factors – not by people with HIV.”
— Positive Women’s Network of the United States of America
Tuberculosis manifests in the resource limited set-up of under-developed and developing nations. These regions are plagued by poor or malnutrition, disease and infections1. Weakened immunity due to tuberculosis might lead to Acquired Immunodeficiency Syndrome (AIDS) infection by Human Immunodeficiency Virus (HIV). Tuberculosis and HIV-AIDS happens to be the cause and effect of each other, acting as a major co-infection of each other. HIV associated with TB is more frequent in Pattern II and Pattern III countries that includes India as well [1,2]. Among the organs, lungs are one of the most affected by tuberculosis as well as HIV-AIDS. Breathing difficulties due to Tuberculosis, Pneumonia, Phlegm and blood in sputum and chest pains are common features. Infection of the gut leading to gastrointestinal symptoms is common in particularly poor environmental conditions.
Geographically, differences have been noted for several AIDS- associated illness. For instance, bacterium Mycobacterium tuberculosis is most frequently seen in patients in the industrialized Western World, while in Africa and other countries of Patterns II and III, bacterial infection are more common (Table 1). Similarly, tuberculosis associated with HIV are much more common in the countries of Patterns II and III including India, whereas other members of the same group of bacteria- mycobacteria a typical variety is more frequent in the countries of Pattern I(1).
AIDS is a set of symptoms and opportunistic infections, Tumors and other infections that manifests on account of damage to the human immune system caused by HIV. The process is gradual ultimately leading to the absolute depletion and collapse of body’s defense mechanism. The weakened immune system is not competent enough to offer resistance to even a milder infection and patient may die out of an infection that is otherwise absolutely curable and controllable under normal situation. These infections, which sets in due to weakened immune system are called ‘Opportunistic infections’. Diversity of opportunistic infections leading to mortality due to varied reasons make AIDS a syndrome rather than a disease of unitary clinical entity [1].
The emergence of AIDS can be traced back to 1980s in USA, Europe and Australia when patients were reported with two unusual symptoms, namely Pneumonia caused by a protozoan parasite Pneumocystis carini and unusual skin cancer called Kaposi’s sarcoma. These symptoms further found correlation with aberrant sexual behavior of individuals usually ‘Gays’. Association of infection with Gay people has given it the name ‘Gay related infectious disease’ (GRID). Little later, AIDS was also reported from Intravenous Drug Users (IVDUs). Over the time another group of patients emerged that have received the infection due to transfusion of blood or related products or children born of infected mothers. Its varied association with diversity of people with different origin, race, caste and creed has given it the name of ‘4H disease’ (Haitians, Homosexuals, Hemophiliacs’ and Heroin users).
AIDS is the result of deficient immune system. However, immunodeficiencies were known in humans since the time immemorial. Before the emergence of AIDS as immunodeficiency syndrome, three different types of immunodeficiencies were recognized in humans. These were Genetic or hereditary immunodeficiency that transmits from parent to progeny; Medically induced immunodeficiency as in case of kidney transplants to avoid rejection and finally Genetically acquired immunodeficiency prevalent in African and Asian continents. Additionally, immunodeficiency could result due to nutritional factors as well. However, retrovirus induced immunodeficiency was entirely new and no reported or documented case was known till 1980s.
The causative agent for AIDS remained undiscovered till 1983, when Dr. Luc Montagnier’s group at the Pasteur Institute in Paris first isolated a retrovirus from the lymph nodes of a lymphadenopathy patient [3]. This virus was subsequently named Lymphadenopathy Associated Virus (LAV). Montagnier and Françoise Barré-Sinoussi were awarded Nobel Prize in Physiology and Medicine for their discovery. Another human retrovirus named HTLV-III (Human T-cell leukemia virus) was reported by Dr. Robert Gallo’s group at University of Maryland. This virus was isolated from peripheral blood mononuclear cells (PBMC) of a patient suffering from AIDS [4]. Later, both LAV and HTLV were found to be the same, which led International Committee on Taxonomy of Viruses in 1986 to discard the previous names and come out with the new nomenclature as Human Immunodeficiency Virus (HIV) [5]. Subsequently, two new subtypes of the virus as HIV-I and HIV-II were reported [6,7].
There are number of theories regarding the origin of HIV in primates and its zoonotic transmission to humans around late 19th or early 20th century. First documented case of HIV dates back to 1959 in the Democratic Republic of Congo from where it spreads to USA in 1966 and India in 1986 [8]. Since then, it has expanded its area of influence encompassing almost the whole globe and assuming a Pandemic proportion. According to the 2011 UNAIDS report, 34 million people are currently living with HIV with approximately 2 million new infections happening every year. The situation is alarming for the under-developed and developing nations with resource limited setup and sharing the maximum global burden of the infection [9,10].
The first HIV case was reported in female sex workers in Chennai in 1986. This was followed by a rapid increase in other states (Table 2). Currently the national prevalence is 0.26 percent as compared to global 0.2 percent. However, the prevalence rate in high risk group like female sex workers is 7 percent. HIV epidemics in India are characterized by low prevalence in general population and high prevalence in high risk groups. HIV in India spreads through four main routes, i.e. through commercial sex workers, promiscuous heterosexual transmission, intravenous drug users and finally among homosexuals or gay men [11].
Beginning of HIV-AIDS epidemics have seen high prevalence in south Indian states like Tamil Nadu, Andhra Pradesh, Karnataka, Mumbai (Maharashtra) and North eastern states like Manipur and Nagaland. Populations among the age group of 15-49 years were among the worst affected, around 39 percent of the women including both sex workers and housewives [12-14]. However, currently the infection is most prevalent in drug users (7.14 percent) followed by men having sex with men (MSM), 4.4 percent, and migrant workers and their wives (2.7 percent) [11].
Management and control strategies focus on the education, information and awareness to prevent the transmission. It has not yet included the pre-exposure prophylaxis (PrEP) [15]. Fortunately, HIV-AIDS is now on downward spiral, thanks to the economical generic antiretroviral therapy (ART) drugs manufactured by Indian pharmaceutical companies and free disposal of these generic drugs to the patients from government of India. This has led to the sharp decline in the AIDS related deaths in India. Currently, all known mode of viral spread have been identified. In early 1990, an explosive epidemic of HIV in North-Eastern state of India was recognized among thousands of intravenous drug users (Table 2). The virus might have started late; but is racing rapidly to create a large scale epidemic situation, especially in some metropolitan cities of India. Only few countries started surveillance to detect HIV infection at a time when the number of AIDS cases was very low. In other countries because of complacency and lack of implementation, the cost effective strategy for sero-surveillance is followed by education and intervention programme directed only to those at high risk situation.
According to National AIDS control Organization (NACO), Mumbai (erstwhile Bombay), Chennai (erstwhile Madras) and Imphal are the three major epicenters of HIV infection in India. AIDS is spreading from these regions to the other parts of the country chiefly via transporters, migrant workers and paid blood donors. Promiscuous multipartner hetero- and homosexual life style are the major contributors to the infection. Majority of HIV-AIDS cases from Imphal in Manipur is due to IVUDs and to lesser extent by hetero- and homosexual relationships. This is because of the easily available drugs (Heroin) from the ‘Golden triangle’ through Myanmar (Burma) border. Mumbai and Chennai being the major metropolitan cities of India attract number of migrants and hence higher probability of promiscuous sexual relationships followed by intravenous drug abuse [1].
As given in Table 2, first case of HIV-AIDS was reported in 1986, which was due to the transfusion of infected blood to the patient during a cardiac surgery in USA. Another case also traced its origin to USA when a Hemophilic was given infected blood product.
These two cases along with many other cases has generated a myth and irrational misconception among Indians that HIV-AIDS is a ‘foreign disease’; has mostly a foreign origin and Indian by and large are immune to it. Subsequently, cases were reported from amongst the Indians as well (Table 2). The number of HIV-AIDS cases reported from among Indians has outnumbered the cases reported in foreigners thus dispelling the notion and tag of HIV-AIDS being a foreigner’s disease. With less than 1 percent of the global land mass, India has more than 16 percent of the world’s population, more than that of South America, Africa, and Australia combined [16].
About one-third population of the world population is infected by Mycobacterium tuberculosis. In 2006, approximately 9.2 million new cases were identified of Tuberculosis with nearly 70,000 were infected with HIV [17]. In 2006 there were 1.7 million TB deaths, including 23,000 infected with HIV [18,19]. These deaths comprise 25 percent of all the avoidable deaths in developing countries. Ninety- five percent of TB cases and 98 percent of TB deaths occur in developing countries. Three-fourths of TB cases in developing countries occur among the economically productive age group, i.e. 15 to 40 years.
This situation is further complicated by rapidly spreading HIV pandemic [20]. According to the recent World Health Organization (WHO) and the Joint United Nations Programme on HIV-AIDS (UNAIDS) update on AIDS epidemic, the revised global estimate of people living with HIV-AIDS (PLHIV) has been calculated to be 33.2 million (range 30.6 to 36.1 million), a reduction of 16 percent compared with the estimate of 39.5 million in 2006 [21,22]. The major contribution to this new estimate has been from the revised figure for the India. According to the new estimate, 2.5 million people ( range 2 to 3.1 million) or about 0.4 percent of adult population in India are HIV- seropositive and these estimates are less than half the earlier reported figure of 5.7 million (range 3.4 to 9.4 million) people [23]. In light to these data, it is likely that the estimates related to HIV-TB co-infection will be revised in near future.
The HIV epidemic has reached a generalized stage at the national level in three countries of Asia, i.e. Cambodia, Myanmar and Thailand [17,24]. In 2003, in Cambodia the prevalence of HIV infection among those aged 15 to 49 years was estimated to be 2.6 percent, in Myanmar the prevalence was 0.7 percent and in Thailand the prevalence was 1.4 percent. The HIV epidemic is generalized in five states of India, namely Andhra Pradesh, Karnataka, Maharashtra, Manipur and Nagaland [14,24].
The clinical presentation of TB in HIV infected patients varies depending on the severity of immunosuppression. In patients with earlier stages of HIV infection, clinical presentation of TB tends to be similar to that observed in persons without immunodeficiency. Pulmonary disease is most common, often with focal infiltrates and cavities. Diffuse pulmonary disease without cavitation’s often involving the lover lobes and prominent meditational or paratracheal adenopathy is seen in patients with advanced HIV infection [25-28].
TB in HIV-AIDS background is difficult to diagnose as routine TB diagnostics may not detect TB bacterium. Sputum smear rarely reveals Acid-Fast Bacilli (AFB) in HIV-seropositive patients with pulmonary TB [29-33]. In HIV-seropositive patients, the histopathological appearance of lymph nodes shows cessation lesions with few or no AFB. In such a situation, other clinical specimens like bronchoscopy and biopsy specimens from HIV-seropositive should be subjected to mycobacterial smear and culture examinations [34-37]. Therefore, TB in HIV-AIDS background requires modern state-of-art DNA based molecular diagnostics like Nucleic acid amplification test (NAAT). However, this becomes a big limitation for the resource limited setups of under-developed and developing countries [35,38-40].
As in the case of adults, clinical presentation of TB in HIV infected children with early HIV disease is similar to that observed in immune competent children without HIV infection. However, TB bacilli are more likely to disseminate to other part of the body in a child who has HIV infection. Tuberculosis meningitis, military TB, and generalized enlargement of lymph nodes are more likely to occur. HIV-seropositive children may have other opportunistic infections apart from TB. In India, provisions are available under the Revised National Tuberculosis control programme (RNTCP) and the National AIDS Control Programme to evaluate patients with TB for HIV infection and vice versa to maximize the case detection rates [41].
Effective diagnosis and targeted therapeutics are the first essential pre-requisite for the effective management of diseases like TB and HIV-AIDS. HIV seropositive patients may develop TB while on antiretroviral therapy (ART) due to weakened immune system. This may aggravate either of the infection thus, complicating its treatment. Untreated or partially treated cases may act as a reservoir of infection that may spread the infection to others. In India, RNTCP employs thrice weekly Directly Observed Treatment (DOTS) in initial intensive phase and in the continuation phase of chemotherapy. New cases are treated with category I treatment while relapse cases are treated in category II [42-45].
Different HIV related infections like Pneumocystis jiroveci, pneumonia and other bacterial infections leads to the considerable morbidity during the treatment of HIV-TB co-infection [46]. Effective and targeted therapy against these inter-current infections might pave the way to reduce morbidity and mortality in HIV-TB patients [14].
HAART has revolutionized the treatment of HIV-AIDS since its introduction in 1996. HAART includes six classes of drugs that are used in the combination to treat HIV infection. These drugs depend on the life cycle of a retrovirus, patient’s viral load, CD4+ cell count and strain of the virus [47]. ART does not eliminate the virus but it leads to near or complete suppression of HIV and reduction in transmission. This is achieved by impairment of viral replication with simultaneous restoration of immune function [47]. Although, benefits of HAART is aplenty but there are obvious limitations like potential side effects of the drug, required to be taken in bulk and also the huge cost of the drug involved, which may not be affordable in resource limited set-up of developing and under-developed nations [40,48,49].
Majority of HIV seropositive patients with pulmonary TB responds to the standard treatment regimen. However, chances of relapse or re-infection of TB is more in HIV-seropositive patients than HIV-seronegative patients. In such a situation, prolonging the continuation phase of treatment may reduce the chances of relapse. In case of poor IVDU compliance, a fully supervised regimen is recommended. Additionally, sterilization of syringes or use of disposable syringes and its complete destruction to prevent its reuse is highly recommended [50].
Anti-retroviral therapy has dramatically reduced the morbidity and mortality associated with HIV-AIDS. However, ART initiation is plagued with irresolvable complications like HIV-associated immune reconstitution inflammatory syndrome (IRIS) particularly in the first six months of initiation of ART. This usually manifests in the form of considerable mortality and morbidity particularly in patients who start ART with advanced immunosuppression. In such a situation, immune recovery following ART initiation is associated with pathological inflammatory response directed towards microbial antigen [51,52]. Timing of ART initiation is crucial to reduce IRIS associated morbidity. Improved understanding of overall pathophysiology of IRIS may lead to the evolution of diagnostic protocols that will equip us with better and improvised therapeutic strategies [14,52,53].
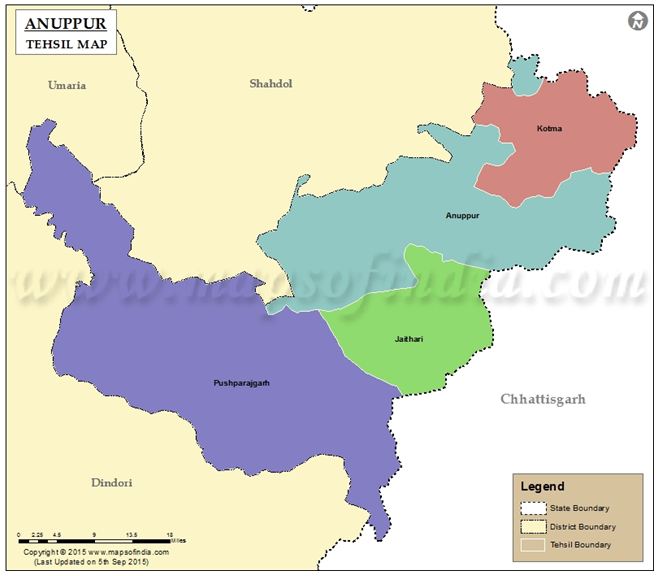
Data was collected as secondary data from all four subdivisions/blocks of district Anuppur through inventories and records from Anuppur district hospital (Figure 1). The collected data was further organized into categories like HIV positive (HIV+) and HIV negative (HIV-) status, HIV with TB (HIV+TB) and HIV without TB (HIV-TB), HIV+ among male, female with antenatal case (ANC) and female without antenatal case (ANC) (Table 3a,Table 3b,Table 3c,Table 3d,4a,4b,4c,4d,5,6,7a,7b,7c,,7d).
CROSSTABS-1
CROSSTABS-2
Collected data were initially entered into an electronic database machine using Sybase Central Software (Sybase, Inc. Dublin, CA). To ensure confidentiality, it was expunged to create a secondary data set that was used for the final analysis.
CROSSTABS-3
Patients with symptoms like weakness, unexplained loss of body weight, loss of appetite and diahorrea etc for long time were referred for HIV testing. HIV kit (ELISA) for testing anti-HIV antibody or Plasma HIV RNA and Western blot analysis were employed as tests for HIV diagnosis. Anuppur district hospital served as a nodal center for testing HIV from all the four blocks/sub-divisions, i.e. Anuppur, Jaitahari, Kotma and Pushparajgarh.
Chi-square (χ2) test: Chi-square (χ2) test was employed to compare the observed results with the expected results. This was done to ensure if the difference between the observed and expected data is due to some chance event or it is due to the relationship between the variables. Lower the Asymptotic value (p value), less likely are the chances that two variables are independent. Chi-square does not provide the strength of association between the variables.
Likelihood ratio was used to compare the Goodness of fit of Null model and Alternative model. This test is based on the Likelihood ratio, which shows the likelihood of data to fit less than one model than other. Likelihood ratio is the ratio of likelihood of an observed outcome under the null hypothesis and maximum likelihood of an observed outcome varying parameters over the whole parameter space. Likelihood ratio ranges between 0 and 1. Low value means that observed results are less likely to occur under Null hypothesis as compared to the Alternative hypothesis, while higher value means that observed results are more likely to occur under Null hypothesis than Alternative hypothesis. This is used to calculate the p value or critical value to accept or reject the Null model.
It provides the chi-square statistics with one degree of freedom (df=1). This tests the Null hypothesis that there exists a non-linear relationship between the variables and provides a powerful tool against a more restricted null hypothesis. This test is applied for the ordinal (ordered) categories and assumes equal and ordered intervals. The Linear-by-linear association is usually applied for the cases larger than 2x2 Tables. The Linear-by-linear test is best suited for ordinal (ordered) data and assumes equal and ordered intervals.
Chi-Square was calculated using cross-tabulation (crosstab). Crosstab forms two-way table and provides the Chi-square test of association. This gives the frequencies of co-occurrences between two variables. The first hypothesis tested here is whether there is relationship between the sub-divisions/blocks of district Anuppur and number of HIV+TB and HIV-TB cases. The null hypothesis is that there is no association between the two variables, the alternative being that there is an association of some sort (crosstab 1). Second hypothesis tested is, if there is relationship between the sub-divisions/blocks of district Anuppur and number of HIV+ cases of the total diagnosed cases. The null hypothesis is that there is no association between the two variables, the alternative being that there is an association of some sort (crosstab 2). Third hypothesis tested is whether there is relationship between the number of HIV+TB and HIV-TB cases amongst male, female (ANC) and female (non-ANC) in district Anuppur. The null hypothesis is, there is no association between the two variables; the alternative being, there is an association of some sort (crosstab 3). Hypothesis was tested using a value of alpha (α) = 0.05. Test was run in the following order: Analyze – Descriptives – Crosstab.
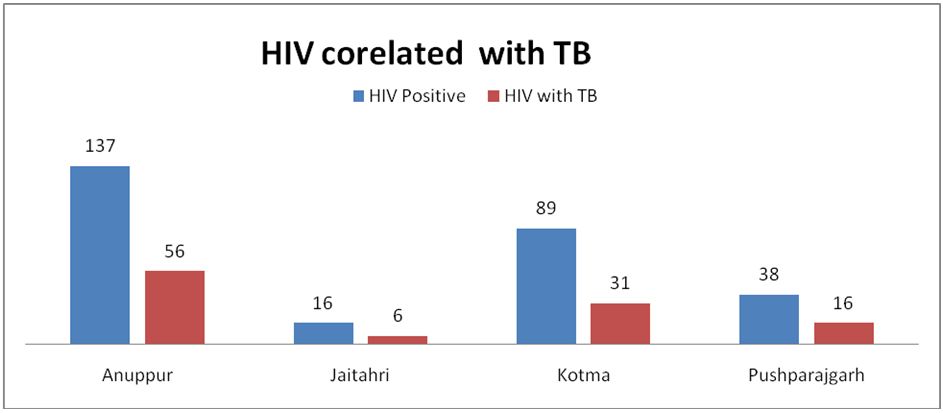
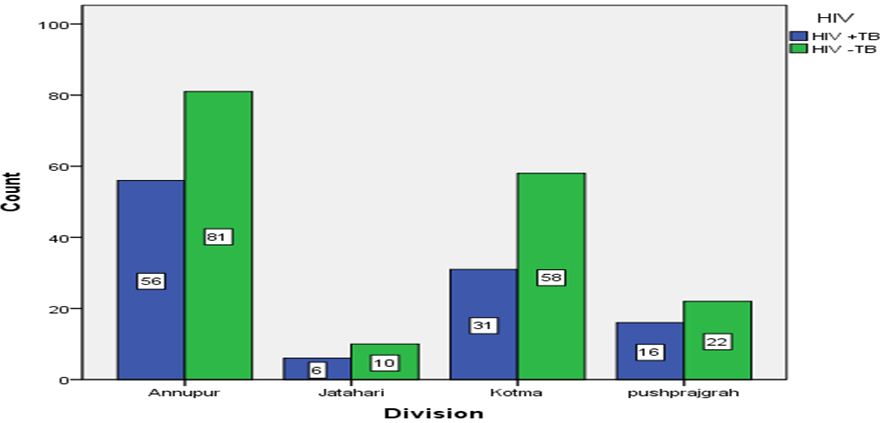
The HIV data from April 2013 to March 2017 was collected from all four blocks (sub- division) of district Anuppur, Madhya Pradesh and categorized into two groups, HIV with TB (HIV+TB) and HIV without TB (HIV-TB) (Figure 1). As given in Table 3a, total 280 cases (HIV without TB and HIV with TB) were reported from all the four sub-divisions of Anuppur district. Anuppur shows the maximum number of cases in both the categories, while Jaithari shows the minimum (Figure 2). In all the sub- divisions, cases of HIV-TB (HIV not associated with TB) are more than HIV+TB (HIV associated with TB). However, Anuppur shows maximum number of HIV+TB and HIV-TB cases followed by Kotma and Pushprajgarh while Jaithari shows the minimum. Same is depicted in bar chart (Figure 3) showing HIV+TB in blue and HIV-TB in green. Table 3b provides the sum of valid cases of all four sub-divisions (280, 100% diagnosed) and no missing cases. Sub-division wise HIV +TB and HIV-TB were counted separately and their percentage calculated by dividing from the vertical sum of given data which are 109 (HIV+TB), 171 (HIV-TB) and 280 (total) respectively (Table 3c). As evident from Table 3c, in all the cases, percentage abundance is almost similar for both the categories (HIV+TB and HIV-TB) in all the four blocks. Column 1 of table 3d shows the summary statistics of Chi-square that includes Pearson Chi-square, Likelihood ratio and Linear-by-linear association. The Likelihood ratio test can be interpreted in a similar way as to Chi-square test. Column 2 shows the value of different test statistics as mentioned above and column 3 gives the degree of freedom (df). Column 4 gives the p value, here referred to as ‘Asymptotic significance’. Here p value for Pearson Chi-square is 0.796 (χ2 = 1.022; p > 0.05; df=3), which means relationship between the two variables are statistically insignificant. Same is true for Likelihood ratio, p value is 0.794 (1.028; p > 0.05; df=3) and Linear-by-linear association, p value is 0.680 (0.170; p > 0.05; df=1).
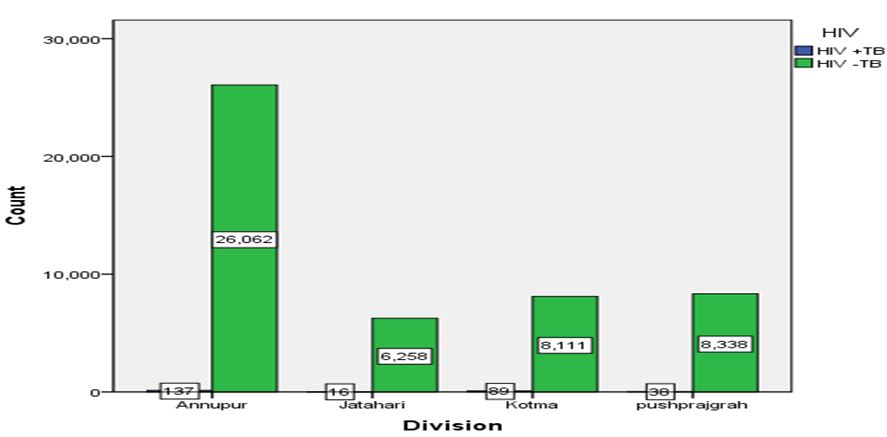
Similarly, table 4a gives the sub-division / block wise number of HIV positive (HIV+) cases among the total tested irrespective of their causal relation with TB. Here also, the total number of suspected cases is maximum for Anuppur followed by Kotma and Pushparajgarh while Jaitahrai shows the minimum number of suspected cases (Figure 4). Table 4b provides the total number of valid cases from all the four blocks /sub-divisions and no missing cases (49049, 100 % diagnosed). Table 4c gives the HIV+ cases along with their percentage from different sub-divisions/blocks. As evident from the Table 4c, Anuppur records the maximum number of HIV+ cases while Jaitahri records the minimum. Table 4d gives the summary statistics of Chi-square that includes Pearson Chi-square, Likelihood ratio and Linear-by-linear association. Asymptotic significance (p value) for Pearson Chi-square is 0.00 (χ2 = 52.357; p < 0.05; df=3); for Likelihood ratio p value is 0.00 (47.391; p < 0.05; df=3) while p value for Linear-by-linear association is 0.074 (3.201; p > 0.05; df=1) indicating statistically significant relationship between the variables.
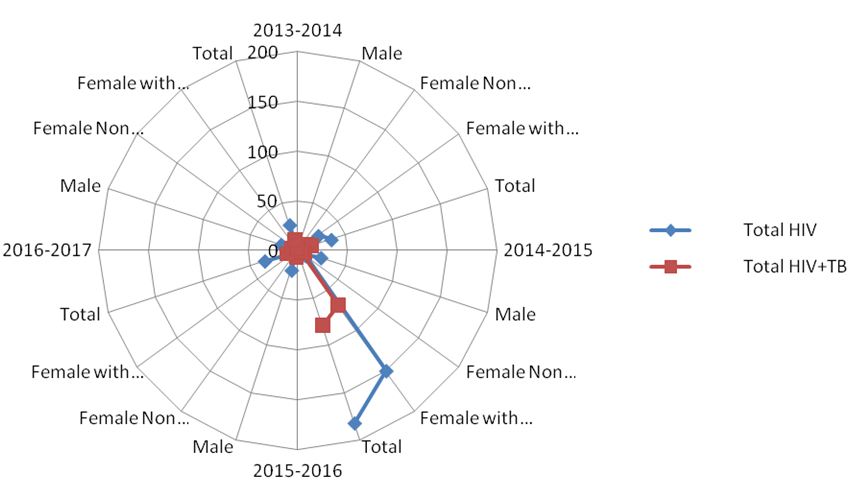
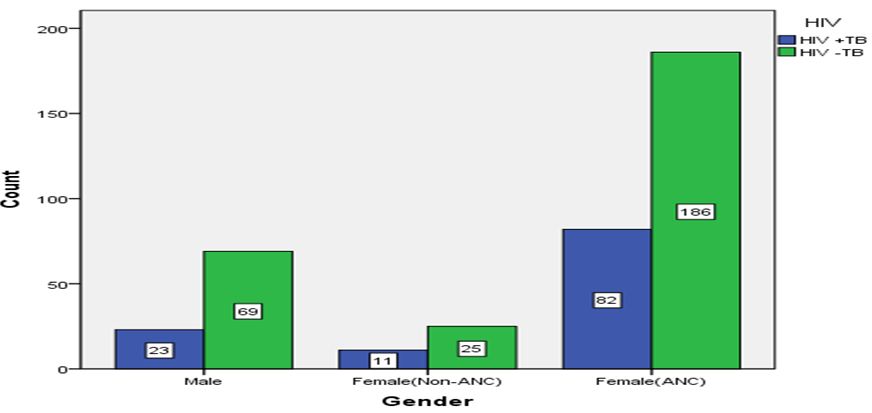
Table 5, 6, 7a provides the gender based data of HIV with TB (HIV+TB) and HIV without TB (HIV-TB) for the study period (2013-17). For females, this data is further bifurcated into females with antenatal case (ANC) and those without antenatal case (ANC) having HIV+TB and HIV-TB. As evident from the table, females (ANC) shows the maximum number of HIV+ cases off which HIV+TB constitutes half of the HIV-TB cases. Similar trend follows for the female (non ANC) and males where HIV+TB measure half of the HIV-TB cases. However, female (ANC) records the maximum total number of HIV cases followed by males and female (non-ANC) (Figure 5, 6). Table 7b provides the total number of valid cases that includes HIV+TB and HIV-TB cases amongst the male, female (ANC) and female (non-ANC) (396, 100% diagnosed cases; no missing case). Table 7c provides the counts and percentage of HIV+TB and HIV-TB cases from amongst the male, female (ANC) and female (non-ANC). As shown in the Table 7c, female (ANC) records the maximum percentage of HIV+TB cases while female (non-ANC) shows the minimum. Table 7d provides the summary statistics of Chi-square, which includes Pearson Chi-square, Likelihood ratio and Linear-by-linear association as earlier. Asymptotic significance (p value) for Pearson Chi-square is 0.587 (χ2 = 1.066; p > 0.05; df =2); for Likelihood ratio p value is 0.580 (1.090; p > 0.05; df =2) while p value for Linear-by-linear association is 0.330 (0.947; p > 0.05; df=1) indicating statistically insignificant relationship between the variables.
In many part of the world, TB is the most common opportunistic infection among HIV infected people [13,17]. As per WHO/UNAIDS estimates 2004 upto 50 percent of people with HIV or AIDS develop TB. Off the 3.6 million adults with HIV infection in the South-East Asian region, nearly half are likely to be infected with TB [17]. In Myanmar, 80 percent of AIDS patients have pulmonary TB, 75 percent in Nepal, 60 percent in Thailand and 56 percent in India [54]. In the Chiang Rai province in northern Thailand, a case control study between 1990 and 1998 has shown that the proportion of TB cases Attributable to HIV rose to 72 percent in male patients and 66 percent in female patients [55]. This continuing increase in TB cases attributable to HIV has occurred even when there is marked reduction in HIV prevalence in the area [39].
HIV pandemic has entered both the epidemiology of TB and the measures of approaches to its control in populations at high risk of TB and HIV infection, particularly in developing African and Asian nations. HIV related TB continues to increase even in the countries with well- organized national TB control programme that are successfully implementing DOTS, the internationally recommended strategy for TB control [54].
Females constitute 40 percent of HIV/AIDS burden in India and the rate is only increasing. Major contributors among females are paid sex workers engaged in unprotected sex with random multiple partners. Unequal power equation and relatively low status in society when compared to males weakens the ability of women to negotiate about using protection during sex both within the marriage and outside marriage. This increases their vulnerability towards AIDS. Data available through various studies also suggest that females get majority of HIV infection through their husbands or male partners working as truck driver, migrant labourer or through male sexual infidelity [10,56]. A study by Lucas (2015) has shown that females taking injectable drugs are several times more vulnerable to contract HIV infection than males [57]. Additionally, nose or ear piercing practices among female both in urban and rural areas also push them towards risk of getting AIDS.
Data related to HIV related opportunistic infection is scarce. Till date, there is no proof that demonstrates differential CD4+ T lymphocyte counts in pregnant and non-pregnant females. However, CD4+ T lymphocyte counts may fall down during pregnancy due to dilutional effect of increased plasma volume. CD4+ T lymphocyte serves as an index of immunosuppression during pregnancy [58,59]. Further, physiological changes occurring during pregnancy might impact the opportunistic infections. These changes includes, increased cardiac output with simultaneous increase in glomerular filtration rate and renal clearance; increased plasma volume and relatively less increase in red blood cell volume thus leading to dilutional anaemia; increase tidal volume and pulmonary blood flow leading to the absorption of aerosolized medications; placental transfer of drugs, increased renal clearance, increased gastrointestinal absorption and metabolism by fetus might influence the maternal drug levels. All these factors may affect the pharmacokinetics of the drug taken to cure the opportunistic infection. Hence, the increased cases of HIV+ and HIV+TB cases in female with ANC [60].
10, 75 percent of women having a husband who is a migrant laborer tested positive for HIV while 1 percent of people who have migrated from rural to urban area tested positive for the disease [10]. This indicates HIV-AIDS to be largely an urban phenomenon. Migrant workers, both male and female are engaged in high level of extra-marital promiscuous sex without using protection thus inflating the percentage of HIV amongst them [61]. According to National AIDS control organization (NACO) estimates, around 2.5 percent of 2 million truckers are living with HIV [56]. Truckers are usually engaged in unprotected sex with sex workers getting infected or transmitting infection, thus spreading the infection to the general population. NACO (2015) has also reported lower testing rate among truck drivers as they are grossly unaware that HIV could be transmitted through a heterosexual act [56,62].
Males with sexually transmitted disease (STD) having sex with affected partner or having STD himself increases the propensity towards AIDS. Males having homosexual tendencies and male sex workers are particularly vulnerable of contracting AIDS. A study has shown that 70 percent of males suspected with HIV infection are engaged in male prostitution. Males engaged in prostitution show 43 percent of HIV infection as compared to the males engaged in homosexual acts (18 percent) [63,64]. Transgender also show very high prevalence of contracting HIV infection. This is largely due to high risk behavior, alcohol and substance abuse and low literacy rate [10,65]. Additionally, there are cases of drug users, particularly those using injectable drugs, show the prevalence of around 10 percent. These people usually exchange needles, syringes or Opioid substitution therapy. Injectable drugs usually used are buprenorphine, pentazocine, diazepam and heroin. Injecting drugs forms the major transmission route of HIV in north eastern states [66,56]. A study has shown that female taking injectable drugs are more likely to get HIV infection as compared to the males taking injectable drugs [57].
The HIV sentinel surveillance carried out among TB patients in many countries of the world shows that HIV prevalence rates are increasing quite rapidly. The HIV-seroprevalence among TB patients in different regions of India varies. Clinical and surveillance data show that TB is the major life-threatening opportunistic infection associated with the HIV in Asia. There is a need to decriminalize and de-stigmatize the disease as stigma associated with disease leads to the denial on the part of patient hence hiding the infection, refusing or delaying the treatment thus making a person reservoir of infection, infecting others. Overall prevalence rate of HIV infections in India remains low. But even slight increase in HIV infection rates in a country of more than one billion people may translate into large numbers of people getting infected.
Financial support from UGC Startup grant (F.20-3(9)/ 2013(BSR)) and DST-NRDMS grant (NRDMS / 01 / 105 / 015 (G)) is gratefully acknowledged.