Evaluation of Genxpert Real Time PCR POC in the Diagnosis of Multidrug Resistant TB Among Patients Attending NTBLTC Saye-Zaria Nigeria
Rationale: Xpert MTB/RIF is a novel automated molecular diagnostic platform recently endorsed by the World Health Organization. However, performance-related data from high HIV prevalence settings are limited.
Objectives: To evaluate of GeneXpert MTB/RIF assay for the rapid diagnosis of pulmonary and multidrug resistant tuberculosis in patients and to compare its sensitivity, specificity, positive and negative predictive values against those of the conventional methods.
Methods: Xpert MTB/RIF was evaluated using single sputum samples from 400 routine microscopy and culture laboratory investigations for ambulant patients with suspected TB.
Measurements and Main Results: The performance outcomes of GeneXpert MTB/RIF for the detection of Mycobacterium tuberculosis compared with direct and concentrated TB smear microscopy using culture as gold standard was found to be of statistically high significant value. The overall sensitivity of the assay was 86.32% (77.74 to 92.51) and specificity of 91.18% (81.16 to 94.24%) at 95% CI respectively. In direct smear-positive culture-positive cases the sensitivity was 80.23% (70.25% - 88.04%), whereas in smear-positive culture-positive cases the sensitivity was concentrated smear-negative culture-positive cases it was 81.947% (71.11%- 90.02%).
The overall specificity for the diagnosis of TB using both culture negative groups (probable and non-TB) was 83.97% (79.42 - 87.87% - 94.26%) at 95% CI. Using only the non-TB group, Xpert MTB/RIF specificity was 91.18% (87.16% - 94.26%) at 95%CI. The assay was negative in all twenty four cases that were culture-positive for non-TB mycobacteria, and negative in 10 cases with sputum isolates that were contaminated by bacterial over growth while only7 (1.75%) of 400 evaluated samples yielded an indeterminate Xpert MTB/RIF result.
Xpert-MTB positive predictive value was 77.36 (68.21-84.92%) while Negative predictive value was 95.02(91.63-97.3%) using culture as a gold standard.
A single Xpert MTB/RIF assay outperformed direct smear microscopy and showed an 9% relative increase in the rapid (potentially within 24 h) TB case-detection rate (36 additional cases) compared with 75 smear-positive cases and thus detected significantly more patients than smear microscopy (75% [18.8%] of 400 vs. 111 [27.87%] of 400).
Xpert MTB/RIF is an accurate rapid diagnostic tool for tuberculosis (TB) and rifampicin resistance. The key advantage of Xpert MTB/RIF is that it diagnosed 20.7% of culture-negative TB cases, 27.7% of smear negative TB cases in a high HIV prevalence setting.
Conclusion: XpertMTB/RIF outperformed smear microscopy, established a diagnosis in a significant proportion of patients with smear negative TB, detected many highly likely TB cases missed by culture, and accurately ruled out rifampicin-resistant TB. Sample-specific factors had limited impact on performance. Performance in patients infected with HIV, especially those with advanced immunosuppression, warrants further study.
Keywords: Genxpert; Diagnosis; Multidrug resistant TBRESEARCH
Tuberculosis (TB) is a major global health priority and kills approximately 1.7 million people annually including 0.4 million among people with HIV. There are an estimated 10.4 million new (incident) TB cases worldwide, of which 6.2 million were men, 3.2 million were women and 1 million children. People living with HIV accounted for 10% of the total [1]. The incidence of multidrug resistant (MDR) TB is increasing with almost 0.5 million estimated new cases in 2008 and 0.6 million in 2016 (2017 WHO TB Report). TB ranks as the second leading cause of death from an infectious diseases worldwide, after the human immunodeficiency virus (HIV) [2]. Though most TB cases and deaths occur among men, the burden of disease among women is also high. In 2013, there were an estimated 3.3 million cases and 510 000 TB deaths among women, as well as an estimated 550 000 cases and 80 000 deaths among children.1 TB mortality is unacceptably high given that most deaths are preventable if people can access health care for a diagnosis and the correct treatment is provided (“National drug-resistant tuberculosis prevalence survey report nigeria”) [3].
Nigeria has an MDR-TB prevalence rate of 2.9% (report of Nigeria MDR-TB survey [4]. Nigeria has the world’s 3rd largest tuberculosis (TB) burden in the world with the TB incidence rate in Nigeria put at 333/100,000 population. With this, Nigeria has 3 times more TB cases than it was previously estimated by WHO. Nigeria now ranks 3rd amongst the 22 high TB burden countries in the world. This means that Nigeria’s case notification rate is 17% putting the percentage of TB cases that are un-notified at 83% [4].
Optimizing TB laboratory diagnosis/detection and new innovations like the Community based and House-to-House case search approach are needed to improve our case notification [5].
Although smear microscopy is widely used for the rapid diagnosis of TB, it does not detect drug resistance and sensitivity in individuals co-infected with HIV and varies between 20% and 50%. Results of mycobacterial culture often only become available after 2–8 weeks. This creates a diagnostic delay that hampers disease control, enhances transmission, and increases healthcare costs [2]. Tuberculosis (TB) due to Mycobacterium tuberculosis (MTB) infection remains a major public health issue: the infection affects up to one third of the world population, and almost two million people are killed by TB each year. Universal access to high-quality, patient-centered treatment for all TB patients is emphasized by WHO’s Stop TB Strategy. The status of conventional and recently introduced TB diagnostics, the newest tools that are under development, and issues involved in providing quality-assured (QA) TB laboratory services are being reviewed. This global awakening to TB’s devastating impact on vulnerable populations has been brought about in many countries by its deadly synergy with HIV. In response, the World Health Organization (WHO) has provided several key guidance documents for national TB control and laboratory programs for the use of light-emitting diode (LED) microscopes to improve the sensitivity of and turnaround time for the front-line assay, sputum smear microscopy, and for improving the accuracy of TB detection and drug susceptibility testing through the use of liquid culture and molecular line probe assays (LPAs). International and national laboratory partners and donors are currently involved in evaluations of new diagnostics that will allow the more rapid and accurate diagnosis of TB at point-of-care (POC) settings and also evaluations of alternative algorithms using new molecular tools for TB reference laboratories. Progress in the implementation of these initiatives is dependent on key partnerships in the international laboratory community and ensuring that quality assurance programs are inherent in each country’s national laboratory network.
In 2008, there were estimated 9.4 million new cases of tuberculosis (TB) globally, with most cases occurring in resource-limited or resource-poor countries in Asia (55%) and Africa (30%). Eighty percent of all cases worldwide occurred in the 22 high-burden countries, with an estimated 1.8 million deaths occurring among all cases in 2008, amounting to approximately 5,000 deaths every day.
Finally, extended treatment with multiple drugs is needed to effectively cure tuberculosis. The main reasons for this requirement are the hydrophobic cell envelope surrounding members of the Mycobacterium tuberculosis complex (MTBC) that serves as a permeability barrier to many compounds; the sequestered, non-replicating subpopulation of TB that is affected by drugs only when the cells reemerge from dormancy; and the drug target or drug-activating enzymes in TB that are altered by mutation and result in a population of drug-resistant cells. The currently used four-drug 6- to 9-month therapy with rifampin (RIF), isoniazid (INH), pyrazinamide (PZA), and either ethambutol (EMB) or streptomycin (SM) is necessary to kill actively replicating TB, eliminate most persisting organisms, and inhibit the development of resistance. However, patients who are instructed to complete the extended regimen often stop taking the pills when they begin to feel better or are noncompliant due to the high pill burden or for other reasons. The irregular taking of anti-tuberculosis often results in persisting disease and the development of drug-resistant, multidrug-resistant, and extensively drug-resistant TB, the other major influencing factors of the present epidemic.
There are several issues with the diagnosis of TB using the present diagnostic tests. There are different tests for different types and phases of TB, so multiple tests may be needed for an accurate diagnosis. A positive TB skin test or TB blood test only tells that a person has been infected with TB bacteria. It does not tell whether the person has latent TB infection (LTBI) or has progressed to TB disease. Other tests, such as a chest x-ray and a sample of sputum, are needed to see whether the person has TB disease. There is chance for false negatives due to the bacteria not multiplying yet and with many tests there are also false positives if someone has taken the vaccine or been exposed but not contracted TB. A negative result for either test means that it is likely that the person tested does not have a TB infection. However, it does not entirely rule out tuberculosis. It may mean that the person’s immune system has not responded to the antigen in the test or that it is too early to detect exposure. It takes about 6 weeks after infection before a person demonstrates a positive reaction to TB screening tests. These tests are time consuming, extensive and may not diagnose accurately. Thus, Testing TB can be expensive, ineffective and time consuming.
The Xpert MTB/RIF assay is a novel molecular, easy-to-use assay, which can lead to tuberculosis identification in less than 2 h using several types of fluids, including blood. A recent study concluded that Xpert MTB/RIF assay has high sensitivity and specificity for both pulmonary and extra-pulmonary specimens.
The rapid detection of MTB in respiratory specimens and drug therapy based on reliable drug resistance testing results are a prerequisite for the successful implementation of this strategy. However, in many areas of the world, TB diagnosis still relies on insensitive, poorly standardized sputum microscopy methods. Ineffective TB detection and the emergence and transmission of drug-resistant MTB strains increasingly jeopardize global TB control activities [6].
Effective diagnosis of pulmonary TB requires the availability - on a global scale - of standardized, easy-to-use, and robust diagnostic tools that would allow the direct detection of both the MTB complex and resistance to key antibiotics, such as rifampicin (RIF). The latter result can serve as marker for multidrug-resistant MTB (MDR TB) and has been reported in > 95% of the MDR-TB isolates. The rapid availability of reliable test results is likely to directly translate into sound patient management decisions that, ultimately, will cure the individual patient and break the chain of TB transmission in the community [7].
The proportion of multidrug-resistant (MDR) tuberculosis (TB) cases among new cases is 2.9%, that among previously treated cases is 15.5%, and that among all TB cases is 4.9%. The rapid detection of M. tuberculosis and rifampin (RIF) resistance in infected patients is essential for disease management, because of the high risk of transmission from person to person and emergence of MDR-TB and extensively drug resistant tuberculosis [8].
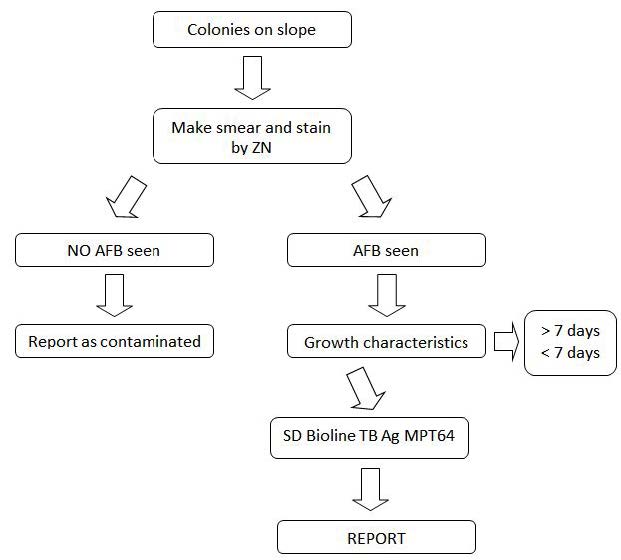
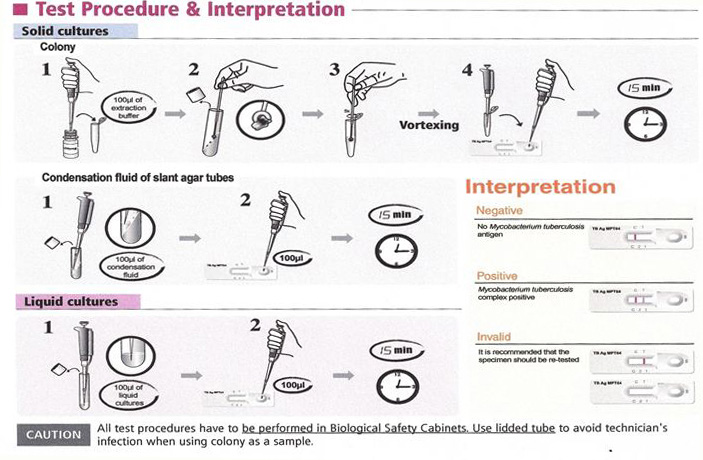
Culture is the “gold standard” for final determination, but it is slow and may take up to 2 to 8 weeks. Although smear microscopy for acid-fast bacilli (AFB) is rapid and inexpensive, it has poor sensitivity and a poor positive predictive value (PPV) (Figure 1). Conventional techniques for culture and identification of mycobacterial culture are important as the specific media not only allows the growth of MTB but also the (NTM)’s which takes a long time to grow. This in turn delays drug susceptibility tests of Mycobacterium tuberculosis by conventional method resulting in minimum of three to four months for completion of reporting after the specimens are received in the laboratory. Newer methods of culture has drastically reduced the turnaround time for culture but cannot classify the mycobacteria as MTB complex or NTM. The conventional techniques used in many of the laboratories including the reference laboratories for the identification of mycobacterial cultures are time consuming. The delay in diagnosis, identification and anti-tubercular sensitivity testing of MTB complex may be one of the important factors contributing to increase in TB cases in developing countries like India and Nigeria. Molecular tests like accu-probe assay are available for differentiation of MTB complex and NTM but require special infrastructure, trained laboratory personnel. These tests are expensive which are not advocated in resource poor settings. MPT64, a 24 kDa secretory protein, is one of the major antigens from TB bacteria. MPT64 has been shown to differentiate the Mycobacterium tuberculosis complex (MTBC) from other bacterial species including the BCG strain. Standard Diagnostics, Inc (SD) (Yongin, Korea) developed the SD BIOLINE TB AgMPT64 RAPID® test, which is a simple and rapid Immunochromatographic test using monoclonal anti-MPT64 antibody that is able to discriminate between MTBC and NTM [9].
Thus, rapid identification, which is essential for earlier treatment initiation, improved patient outcomes, and more effective public health interventions, relies on nucleic acid amplification techniques. Several molecular methods have been developed in recent years for the diagnosis of tuberculosis and rapid detection of drug resistance in clinical specimens, including line probe assays (GenoTypeMTBDRplus [HainLifescience GmbH, Nehren, Germany], INNO LIPA Rif.TB [Innogenetics, Ghent, Belgium]) and real-time PCR (GeneXpert MTB/ RIF; Cepheid, Sunnyvale, CA). Molecular assays have been established to allow the prediction of drug resistance in clinical specimens within 1 working day and are potentially the most rapid methods for the detection of drug resistance [8].
The Xpert MTB/RIF (Cepheid) represents the first assay which uses a fully integrated real-time PCR platform allowing the simultaneous detection of MTBC and resistance to rifampin (RMP) based on rpoB as target sequence. The cartridge-based system is easy to use without need of prior sputum processing, bio-safe and bears a minimized risk of cross-contamination. Both, a first multi-country evaluation study as well as a consecutive multi-center implementation study showed good specificity (99.2%) and excellent sensitivity values (92.2% and 90.3%, respectively), in particular for smear negative TB specimens (72.5% and 76.9%, respectively).
These data suggested that sensitivity might be superior to that of other commercial assays [10].
Indirect comparison of Xpert MTB/RIF with other assays by reviewing data from evaluation studies is difficult due to significant differences in the study design and the sample collection. Comparative analysis is further hampered by the fact that published evaluation data for Xpert MTB/RIF appeared very heterogeneous, for example, there was a high variation in sensitivity for smear-positive (97.7% - 100%) or smear-negative pulmonary TB (43.4% - 75.3%) in different studies. So far, studies on the direct comparison of Xpert MTB/ RIF with other commercial assays are rare [10]. Reported performance of the Xpert MTB/RIF assay, a new real-time tuberculosis (TB) PCR test, with that of the Amplified Mycobacterium tuberculosis Direct (MTD) assay using 162 respiratory and non-respiratory specimens with culture as the gold standard, the overall sensitivity and specificity for all sample types for the Xpert MTB/RIF assay were 90.9 and 89%, respectively, while for the MTD assay, the overall sensitivity and specificity were 97.3 and 87.1%, respectively. A higher proportion of total equivocal results were obtained for the MTD assay, at 10.5% (17/162), while the Xpert MTB/RIF assay generated 5.5% (9/162) of invalid reads [11].
The GeneXpert MTB/RIF test was evaluated in a large cohort of patients with suspected tuberculous meningitis. Three hundred seventy-nine patients presenting with suspected tuberculous meningitis to the Hospital for Tropical Diseases, Ho Chi Minh City, Vietnam, between 17 April 2011 and 31 December 2012 were included in the study. Cerebrospinal fluid samples were tested by Ziehl-Neelsen smear, mycobacterial growth indicator tube (MGIT) culture, and Xpert MTB/RIF. Rifampin (RIF) resistance results by Xpert were confirmed by an MTBDR-Plus line probe assay and all positive cultures were tested by phenotypic MGIT drug susceptibility testing. Overall, 182/379 included patients (48.0%) were diagnosed with tuberculous meningitis. Sensitivities of Xpert, smear, and MGIT culture among patients diagnosed with TBM were 59.3% (108/182 [95% confidence interval {CI}, 51.8 to 66.5%]), 78.6% (143/182 [95% CI, 71.9 to 84.3%]) and 66.5% (121/182 [95% CI, 59.1 to 73.3%]), respectively. There was one false-positive Xpert MTB/RIF test (99.5% specificity). Four cases of RIF resistance (4/109; 3.7%) were identified by Xpert, of which 3 were confirmed to be multidrug-resistant (MDR) TBM and one was culture negative. Xpert MTB/RIF is a rapid and specific test for the diagnosis of tuberculous meningitis [12].
Xpert MTB/RIF was evaluated using single archived spot sputum samples from 496 South African patients with suspected TB with Mycobacterium tuberculosis culture positivity and phenotypic resistance to rifampicin served as reference standards, the overall, Xpert MTB/RIF detected 95% (95% confidence interval [CI], 88–98%; 89 of 94) of smear positive culture-positive cases and the specificity was 94% (91– 96%; 320 of 339). The sensitivity in smear-negative cases was 55% (35–73%; 12 of 22) when the analysis was restricted to 1 ml of unprocessed sputum and culture time-to-positivity of less than or equal to 28 days. Compared with smear microscopy (n ¼ 94), Xpert MTB/RIF detected an additional 17 cases (n ¼ 111) representing an 18% (11–27%; 111 vs. 94) relative increase in the rapid TB case detection rate. Moreover, compared with smear microscopy, the inclusion of Xpert MTB/RIF-positive culture-negative TB cases (ruled-in by an alternative diagnostic method) resulted in the detection of a further16 cases (n ¼ 127), thus significantly increasing the rapid TB case detection rate to 35% (95% CI, 26–45%; 94 to 111 vs. 94 to 127; P ,0.01), the overall specificity to 99.1% (97–100%; 320 of 323; P , 0.001), and sensitivity in smear-negative TB to 60% (P ¼ 0.12). Performances strongly correlated with smear status and culture time-to-positivity. In patients infected with HIV compared with patients uninfected with HIV Xpert MTB/RIF showed a trend to reduced sensitivity (P ¼ 0.09) and significantly reduced negative predictive value (P ¼ 0.01). The negative predictive value for rifampicin resistance was 99.4% [2].
This study evaluated the use of the GeneXpert MTB/RIF assay for the rapid diagnosis of pulmonary and multidrug resistant tuberculosis in patients. The Xpert MTB/RIF assay, which enables simultaneous detection of Mycobacterium tuberculosis (MTB) and rifampicin (RIF) resistance, was endorsed by WHO in December, 2010. This technology has been adopted and put to use in many countries including Nigeria but there is no documented information about the evaluation of the Xpert technology in Nigeria. This study provided sufficient data after evaluation of the Xpert MTB/RIF assay as against the TB culture being the gold standard.
• The overall yield of GeneXpert in HIV-infected and uninfected in TB suspects will be higher than the yield obtained by MGIT
liquid culture under optimal conditions.
• In patients with pulmonary TB, the sensitivity and specificity of GeneXpert® MTB/RIF assay will approximate that of solid
culture.
• In patients with less severe disease, the yield of Xpert will be lower than solid culture.
The materials used for this study as relates to the methods are as follows:
Smear microscopy- the materials includes frosted end microscope slides, staining rack, microscope, Ziehl-Neelsen and Fluorescence stains, applicator stick, sputum cups, registers, worksheets, immersion oil, disinfectants
GeneXpert technique- GeneXpert cartridges, certified biosafety cabinet, disinfectants, Refrigerators, 50ml falcon tubes
Sputum culture- 50mls falcon tubes, NaOH-NALC, Refrigerated centrifuge, incubator, autoclaves,
Early morning samples from 400 patients with clinical signs and symptoms for the diagnosis of pulmonary tuberculosis were collected for this study. Each sample was aliquoted into 2, one portion for GeneXpert and the second portion for microscopy and culture.
Though samples were collected from patient as part of routine examination, ethical approval was obtained from National TB & Leprosy Training Center Saye-Zaria Research Ethics committee.
The study was carried out in the National TB Reference Laboratory of National TB & Leprosy Training Center, Saye-Zaria, located in the Northern region of Nigeria where TB is diagnosed according to the National TB Guidelines.
Four hundred (400) patients with suspected TB were eligible for inclusion into the analysis. Patient demography as stratified by sex has 229 (57.2%) and 171 (42.8%) as male and female respectively. The study group patient had their age group into < 10 years (1.8%), >40 years (37.3%), 10—17 years (6.3%) and 18-40 years (54.8%).
All patients were offered HIV counselling and testing. The HIV test results were recorded in the study register for those who consented. The results showed that 88 (22%) had unknown HIV results because they did not consent, while 161 (40.2%) and 151 (37.8%) had their HIV status as non-reactive and reactive respectively. Out of the 151 HIV reactive cases, the male and female account for 56.3% and 43.7% respectively as can be seen Table 1.
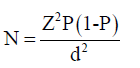
The sample size was determined using the bonnets formula:
 n = Sample size
p = prevalence rate (50%)- TB/HIV co-infection rate
Z = Standard confidence limit at 95% limit= 1.96
d = degree of error 5%= 0.05Study
The sample size was calculated using 50% TB –HIV co infection rate prevalence rate in Nigeria (National TB prevalence survey,2012) giving a total of approximately 400 samples to be collected and examined using this formula:
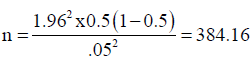 which was rounded up to 400.
The sample size of 400 samples from 400 study patients was used for the study.
All the 400 study patients had three sputum samples collected (one spot sample, one morning sample and another spot sample, out of which the early sample was used making a total of four samples for analysis) as part of routine laboratory investigations for ambulant patients with suspected TB between April 2015 and August, 2015 at the National TB Reference Laboratory of National TB and Leprosy Training Center, Saye-Zaria Kaduna State Nigeria.
The early morning sample was thoroughly mixed in an aseptic condition and aliquot into two portions (one portion for analysis using GeneXpert while the other portion for direct microscopy and culture).
Detailed patient and laboratory-specific information was recorded on a standardized case record form and captured using double data entry.
As part of the routine services of NTBLTC Saye-Zaria, all patients were offered HIV counselling and testing. The HIV test results were is recorded in the study register for those who consented.
Sample Collection: Routine freshly produced sputum samples was obtained from all the patients presenting at the TB smear microscopy centre of NTBLTC Saye-Zaria using translucent wide mouth, screwed- cap sputum cups. Patients were instructed to take in a deep breath and cough out phlegm (Sputum).
The procedure adopted was that described by WHO laboratory guidelines [13].
Semi-quantitative results were recorded according to the NTBLCP guidelines.
The procedure adopted was that described by [6]
Suspected colonies of Mycobacteria grown on L.J or culture from MGIT 960 positive tube
Incoming Quality Control: Testing of positive and negative samples was done done immediately after receipt of the SD Bioline Test kits. This allows checking if shipment conditions have damaged or not, the SD Bioline test kits resulting in decreased sensitivity. These positive and negative controls have to be repeated before each daily run.
A positive control can be:
• Proven clinical isolate of M.tb or M.tb H37RV or
• Liquid prepared by suspending an equivalent to the amount of a 1mm – diameter platinum loop in 0.2ml of 10mmol/L Phosphate
buffered saline (PBS) containing 0.1% (w/v) Tween 80 or
• Liquid culture of Mycobacterium bovis BCG* (equivalent to a McFarland No. 1 standard (3 to 6x10⁷ CFU/ml) grown in an AFB
liquid medium
A negative control is:
• Non – inoculated liquid media and
• 10 mmol/L PBS containing 0.1% (w/v) Tween 80 and
• Any NTM e.g. M. smegmatis or M. gordonae
Data was collected onto standardized formats for easy entry into statistical software that was used for the data analysis. Categorical variables will be assessed by the chi-square (_2) test.
For the analysis of assay sensitivity, culture positivity and phenotypic susceptibility to rifampicin using simultaneously obtained paired samples (Xpert MTB/RIF vs. culture) was used as the reference standards. A specificity calculation was based on paired culture-negative samples from both culture-negative groups (MTB and non-TB). Comparative specificity using the non-TB group was analyzed for those found. Test performance assessment and chi-square analyses was performed using SPSS version 20 2011 was used for the analysis of linear regression [2].
The WHO recently endorsed GeneXpert MTB/RIF; however, there are limited data about performance outcomes in high HIV prevalence settings where smear-negative TB is a formidable diagnostic challenge. The GeneXpert technology was evaluated against the existing traditional smear microscopy with culture as the known gold standard.
The HIV status of the study patients showed that 88 (22%) had unknown HIV results because they did not consent, while 161 (40.2%) and 151 (37.8%) had their HIV status as non-reactive and reactive respectively. Out of the 151 HIV reactive cases, the male and female account for 56.3% and 43.7% respectively.
A total of 75 (18.8%) and 90 (22.5%) of 400 patients had definite TB by direct and concentrated smear microscopy techniques respectively. This shows that concentrated method of smear microscopy has more diagnostic value than direct microscopy technique as it picked additional 15 definite pulmonary TB which direct microscopy could not diagnosed (Table 4).
Of the four hundred study subjects, 109 (27.3%) were culture positive with 16 (4.0%) of the study subjects had their samples contaminated by Lowenstein Jensen solid culture technique as can be seen in Table 4.
Of the four hundred study subjects, GeneXpert technique was able to pick 111 (27.8%) as positive with 282 samples were negative while 7 (1.8%) of the study subjects had their results as invalid Table 4.
The performance outcomes of GeneXpert MTB/RIF for the detection of Mycobacterium tuberculosis compared with direct and concentrated TB smear microscopy using culture as gold standard is a shown in Figure 4 and Table 5. The overall sensitivity of the assay was 86.32% (95% confidence interval [CI], 77.74 to 92.51) and specificity of 91.18% (95% CI, 81.16 to 94.24%).
In direct smear-positive culture-positive cases the sensitivity was 80.23% (70.25% - 88.04%), whereas in smear-positive culture-positive cases the sensitivity was concentrated smear-negative culture-positive cases it was 81.947% (71.11%- 90.02%).
The overall specificity for the diagnosis of TB using both culture negative groups (probable and non-TB) was 83.97% (79.42 - 87.87% - 94.26%). Using only the non-TB group, Xpert.
MTB/RIF specificity was 91.18% (87.16% - 94.26%). The assay was negative in all twenty four cases that were culture-positive for non-TB mycobacteria, and negative in 10 cases with sputum isolates that were contaminated by bacterial over growth while only7 (1.75%) of 400 evaluated samples yielded an indeterminate Xpert MTB/RIF result.
A single Xpert MTB/RIF assay outperformed direct smear microscopy and showed an 9% relative increase in the rapid (potentially within 24 h) TB case-detection rate (36 additional cases) compared with 75 smear-positive cases and thus detected significantly more patients than smear microscopy (75% [18.8%] of 400 vs. 111 [27.87%] of 400).
Out of the 75 smear positive cases by direct smear microscopy 10 (13.3%) of those with unknown HIV status with definite TB while 49 (65.3%) and 16 (21.3%) were picked from those with HIV Status as non-reactive and reactive respectively. Of the 151 with HIV status as reactive, 135 (89.4%) and 16 (10.6%) had their sputum smear microscopy direct method results as negative and positive respectively. While out of the 90 smear positive cases by direct smear microscopy 11 (12.2%) of those with unknown HIV status with definite TB while 56 (62.2%) and 23 (25.6%) were picked from those with HIV Status as non-reactive and reactive respectively. Of the 151 with HIV status as reactive, 128 (84.8%) and 23 (15.2%) had their sputum smear microscopy direct method results as negative and positive respectively as can be seen in Table 4 as in previous page.
Out of the 151 HIV positive patients 85(37.1%) and 66(38.6%) are from the males and female population respectively with a P > 0.05, hence not statistically significant. Of the 75 and 90 smear positive b direct and concentrated smear microscopy techniques respectively, 56(24.5%); 19(11.1%) are males and female population respectively while the male and female population using concentrated smear microscopy technique had 67(29.3%) and 23(13.5%). Both the direct and concentrated techniques had P<0.05 which is statistically significant as can be seen in Table 6.
The performance outcomes of GeneXpert MTB/RIF for the detection of Mycobacterium tuberculosis shows that out of the 111 cases diagnosed as MTB positive 13 (11.7%) of those with unknown HIV status with definite TB while 65 (58.6%) and 33 (29.7%) were picked from those with HIV Status as non-reactive and reactive respectively. Of the 151 with HIV status as reactive, 2 (1.3%), 116 (76.8%) and 33 (21.8%) had their GeneXpert results as invalid, negative and positive respectively.
In this study it was noted that there were more MTB, MTB RIF resistances and HIV cases in males than in females. Out of the 111 positive cases detected by GeneXpert, 82(35.8%) and 29(17.0%) are from the male and female population respectively while the 109 detected using culture, 76(33.2) and 33(19.3) are males and females respectively. out of the 18 TB Rifampicin resistant patients detected using GeneXpert MTB/RIF assay, 13(5.7) and 5(2.9) are of males and females respectively. As shown in Table 7 and Table 8, there were 23 (8.4%) Xpert MTB/RIF-positive patients who were culture-negative based on their simultaneously obtained sputum sample. Xpert MTB/RIF was able to pick 6 (37.5%) out of the 16 contaminated cultures as positives. Of the 18 MTB/RIF resistance detected 72.2% and 27.8% are from males and females respectively while the males accounted for 73.4% of the 94 drug susceptible tuberculosis as can be seen in Table 8.
Culture was able to pick 23 (8.22%) out of the 282 negative Xpert MTB/RIF samples as positives and this is statistically significant as P < 0.05. This shows the correlation and discordance between Xpert MTB and culture.
The performance outcomes of GeneXpert MTB/RIF for the detection of Mycobacterium tuberculosis compared with direct and concentrated TB smear microscopy using culture as gold standard is as shown in Table 9 and Table 10. Of the 151 study subjects that are HIV positive, 10.6% (16 of 151), 15.23% (23 of 151) , 21.85% (33 of 151) and 23.3% (36 of 151) were diagnosed using direct microscopy, concentrated smear microscopy, GeneXpert technology and culture as gold standard respectively.
From the 400 samples, LJ culture technique was able to picked 108 (27.0%) as culture positive while 16 (4%) got contaminated. From the HIV positive patients, culture by the solid LJ media technique was able to diagnosed 36 with definite presumptive Mycobacterium tuberculosis while 57of the 161 HIV negative were culture positive as can be seen in Table 6.
Performance outcome of Final LJ cultures results in the diagnosis of Mycobacteria in relation to AFB-Direct and concentrated microscopy technique shows that 10 out of the initial 108 positive LJ cultures turned out to be Non-Mycobacterium tuberculosis (NTM) after the rapid identification using SD Bioline rapid test kit as can be seen in Tables 7 And 8. This is statistically significant because: P < 0.05. The highest numbers (7 out of 11) of the NTM were from HIV positive patients.
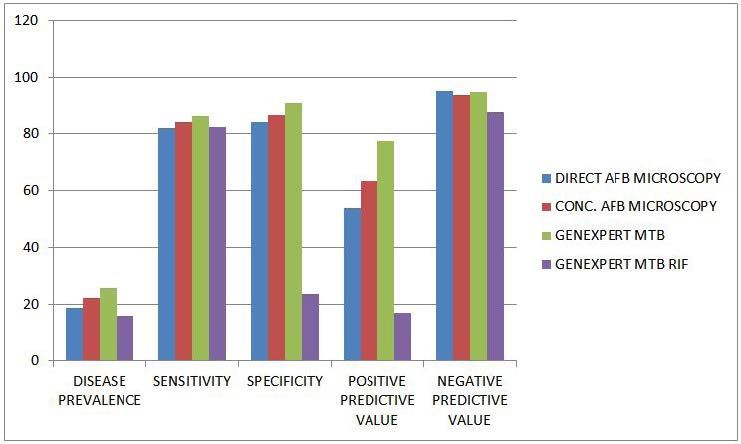
The performance of the various techniques to detect Mycobacterium tuberculosis are 18.8%, 22,4%, 25.9%, 16.2% using direct AFB smear microscopy, Concentrated AFB smear microscopy, GeneXpert MTB and GeneXpert MTB/RIF respectively with culture as the gold standard. The sensitivity of direct smear microscopy, concentrated smear microscopy, GeneXpert MTB and GeneXpert MTB/RIF are 81.9%, 84.2%, 86.3% and 82.4% respectively while their specificity are 84%, 86.6%, 91.2% and 23.9%. The positive predictive value for direct AFB smear microscopy, Concentrated AFB smear microscopy, GeneXpert MTB and GeneXpert MTB/RIF are 54.1, 63.3, 77.4 and 17.3 respectively with negative predictive values are 95.3, 93.8, 95.0 and 87.5 respectively as can be seen in Table 11. All the P Values are less than 0.05 (P < 0.05) which also translate to the fact that using the test assays are better than just guessing.
AFB-Direct: positive predictive value (PV+) – the probability that the patient actually has the disease is 54.1%, while the probability that the patient does not have the disease (negative predictive value (PV-) is 95.3%.
AFB-Concentration: the probability that the patient actually has the disease is 63.3% (PV+), while the probability that the patient does not have disease (PV-) is 93.8% respectively
GX-MTB: the probability that the patient actually has the disease is 77.4% (PV+), while the probability that the patient does not have the disease (PV-) is 95% respectively.
GX-RIF: the probability that the patient actually has the disease is 17.3% (PV+), while the probability that the patient does not have the disease is 87.55% (PV-) respectively.
This study shows that concentrated method of smear microscopy has more diagnostic value than direct microscopy technique as it picked additional 15 definite pulmonary TB which direct microscopy could not diagnosed (Table 4). Using the solid culture technique out of the four hundred study subjects, 109 (27.3%) were culture positive with 16 (4.0%) of the study subjects had their samples contaminated by Lowenstein Jensen solid culture technique as can be seen in Table 9. This is in agreement with another study [2].
Of the four hundred study subjects, GeneXpert technique was able to pick 111 (27.8%) as positive with 282 samples were negative while 7 (1.8%) of the study subjects had their results as invalid. The performance outcomes of GeneXpert MTB/RIF for the detection of Mycobacterium tuberculosis compared with direct and concentrated TB smear microscopy shows that GeneXpert technique gives higher yield using culture as gold standard. The overall sensitivity of the assay was 86.32% (95% confidence interval [CI], 77.74 to 92.51) and specificity of 91.18% (95% CI, 81.16 to 94.24%).
In direct smear-positive culture-positive cases the sensitivity was 80.23% (70.25% - 88.04%), whereas in smear-positive culture-positive cases the sensitivity was concentrated smear-negative culture-positive cases it was 81.947% (71.11%- 90.02%).
The overall specificity for the diagnosis of TB using both culture negative groups (probable and non-TB) was 83.97% (79.42 - 87.87% - 94.26%). Using only the non-TB group, Xpert.
MTB/RIF specificity was 91.18% (87.16% - 94.26%). The assay was negative in all twenty four cases that were culture-positive for non-TB mycobacteria, and negative in 10 cases with sputum isolates that were contaminated by bacterial over growth while only7 (1.75%) of 400 evaluated samples yielded an indeterminate Xpert MTB/RIF result. The sensitivity of GeneXpert MTB/RIF relative to clinical diagnosis (86.3%) was significant higher than the sensitivity of smear (81.9%) relative to clinical diagnosis (4.4%; p > 0.001). A single Xpert MTB/RIF assay outperformed direct smear microscopy and showed an 9% relative increase in the rapid (potentially within 24 h) TB case-detection rate (36 additional cases) compared with 75 smear-positive cases and thus detected significantly more patients than smear microscopy (75% [18.8%] of 400 vs. 111 [27.87%] of 400). This is in agreement with Grant Theron et al 2011 who reported that Overall, Xpert MTB/RIF detected 95% (95% confidence interval [CI], 88–98%; 89 of 94) of smear positive culture-positive cases and the specificity was 94% (91–96%; 320 of 339).
Out of the 75 smear positive cases by direct smear microscopy 10 (13.3%) of those with unknown HIV status with definite TB while 49 (65.3%) and 16 (21.3%) were picked from those with HIV Status as non-reactive and reactive respectively. Of the 151 with HIV status as reactive, 135 (89.4%) and 16 (10.6%) had their sputum smear microscopy direct method results as negative and positive respectively as can be seen in Table 6. Of the 90 smear positive cases by direct smear microscopy 11 (12.2%) of those with unknown HIV status with definite TB while 56 (62.2%) and 23 (25.6%) were picked from those with HIV Status as non-reactive and reactive respectively. 128 (84.8%) and 23 (15.2%) of the 151 with HIV status as reactive had their sputum smear microscopy direct method results as negative and positive respectively as can be seen in Table 6. The association between HIV status and AFB-direct, AFB-Conc, GX-MTB and GX-MTB/RIF has significant association with P<0.05.
The performance outcomes of GeneXpert MTB/RIF for the detection of Mycobacterium tuberculosis shows that out of the 111 cases diagnosed as MTB positive 13 (11.7%) of those with unknown HIV status with definite TB while 65 (58.6%) and 33 (29.7%) were picked from those with HIV Status as non-reactive and reactive respectively. Of the 151 with HIV status as reactive, 2 (1.3%), 116 (76.8%) and 33 (21.8%) had their GeneXpert results as invalid, negative and positive respectively.
The performance of GeneXpert MTB/RIF for the detection of Mycobacterium tuberculosis compared with direct and concentrated TB smear microscopy using culture as gold standard is as shown in Table 9, Table 10 and Table 11. Of the 151 study subjects that are HIV positive, 10.6% (16 of 151), 15.23% (23 of 151) , 21.85% (33 of 151) and 23.3% (36 of 151) were diagnosed using direct microscopy, concentrated smear microscopy, GeneXpert technology and culture as gold standard respectively. Out of the 400 samples, LJ culture technique was able to pick 109 (27.3%) as culture positive while 16 (4%) got contaminated. From the HIV positive patients, culture by the solid LJ media technique was able to diagnosed 36 with definite presumptive Mycobacterium tuberculosis while 57of the 161 HIV negative were culture positive as can be seen in Table 6.
Performance outcome of Final LJ cultures results in the diagnosis of Mycobacteria in relation to HIV status shows that 11 out of the initial 109 positive LJ cultures turned out to be Non-Mycobacterium tuberculosis (NTM) after the rapid identification using SD Bioline rapid test kit. The highest numbers (7 out of 11) of the NTM were from HIV positive patients. There were 23 (8.4%) Xpert MTB/RIF-positive patients who were culture-negative based on their simultaneously obtained sputum sample. Xpert MTB/RIF picked 6 (37.5%) out of the 16 contaminated cultures as positives. Culture was able to picked 24 (8.5%) out of the 282 negative Xpert MTB/RIF samples as positives. This shows the correlation and discordance between Xpert MTB and culture [10].
Previous studies of the MTB/RIF assay have reported test sensitivities of 57 to 76.9% in cases of smear-negative, culture-positive pulmonary tuberculosis and 98 to 100% in cases of smear-positive, culture-positive pulmonary tuberculosis, while the test specificity remained at 99% to 100% [8]. In my study the overall GeneXpert MTB/RIF performance outcomes of GeneXpert MTB/RIF for the detection of Mycobacterium tuberculosis compared with direct and concentrated TB smear microscopy using culture as gold standard is a shown in Table 11. The overall sensitivity of the assay was 86.32% (95% confidence interval [CI], 77.74 to 92.51) and specificity of 91.18% (95% CI, 81.16 to 94.24% compatible with results presented in previous medical papers.
In direct smear-positive culture-positive cases the sensitivity was 80.23% (70.25% - 88.04%), whereas in smear-positive culture-positive cases the sensitivity was concentrated smear-negative culture-positive cases it was 81.947% (71.11%- 90.02%).
The overall specificity for the diagnosis of TB using both culture negative groups (probable and non-TB) was 83.97% (79.42 - 87.87% - 94.26%). Using only the non-TB group, Xpert.
MTB/RIF specificity was 91.18% (87.16% - 94.26%). The assay was negative in all twenty four cases that were culture-positive for non-TB mycobacteria, and negative in 10 cases with sputum isolates that were contaminated by bacterial over growth while only7 (1.75%) of 400 evaluated samples yielded an indeterminate Xpert MTB/RIF result.
A single Xpert MTB/RIF assay outperformed direct smear microscopy and showed an 9% relative increase in the rapid (potentially within 24 h) TB case-detection rate (36 additional cases) compared with 75 smear-positive cases and thus detected significantly more patients than smear microscopy (75% [18.8%] of 400 vs. 111 [27.87%] of 400).
The sensitivity of Xpert reported here is similar to the sensitivity of other molecular techniques for Mycobacterium tuberculosis (MTB) diagnosis. Xpert has two significant advantages: the closed-cartridge-based format and the ability to simultaneously detect M. tuberculosis and RIF resistance. The cartridge-based format removes the need for manual DNA extraction processing, and the closed system dramatically reduces any potential for cross-contamination of samples with PCR amplicons. The addition of a brief vortexing step after addition of the sample reagent improved sensitivity of Xpert in these paucibacillary samples. The overall increase in disease prevalence for (MTB) from 18.8% to 25.9% using microscopy and GeneXpert respectively showed that the newly introduced Xpert technology has better efficiency for active TB case finding.
In conclusion, the MTB/RIF test is less dependent on the user’s skills, and routine staff with minimal training can use the test. It has a short turnaround time and simultaneously detects.
M. tuberculosis and RIF resistance in less than 3 h. Although the MTB/RIF test could be a useful tool for rapid identification of RIF-resistant M. tuberculosis, especially in smear-positive clinical samples, the test results must always be confirmed by culture and DST.
The key findings of this study using samples were:
1) Xpert MTB/RIF is preferable to smear microscopy because it diagnosed a significant proportion of smear-negative TB cases
by 27.8% while direct and concentrated microscopy yielded 18.8% and 22.5% respectively.
2) GeneXpert MTB/RIF was able to picked 31/310 (10%) of the reported smear negative.
3) GeneXpert MTB/RIF test platform is useful in the rapid diagnosis of DRTB.
4) Rapid detection of Rifampicin resistance which is a marker for DRTB
5) There were more MTB, MTB RIF resistances and HIV cases in males than in females
6) There were more NTM in the HIV infected with pulmonary Mycobacterium tuberculosis (54.5% of the 11 cases) than the
HIV negative MTB patients
There are limited data about Xpert MTB/RIF performance in persons infected with HIV. Thus, in persons infected with HIV,Xpert MTB/RIF is a good rule-in test but may have limited rule-out value compared with persons uninfected with HIV. This may be caused by the lower concentration of mycobacteria in the sputum of persons infected with HIV and possibly reduced specificity caused by occult or subclinical disease. My data added to the limited existing knowledge base about the impact of HIV on Xpert MTB/RIF performance. The added rule-out value of a test in persons infected with HIV who are smear negative and Xpert MTB/RIF-negative as an advantage using GeneXpert as against smear microscopy and conventional culture technique.
The key advantage of Xpert MTB/RIF is that it diagnosed 20.7% of culture-negative TB cases, 27.7% of smear negative TB cases in a high HIV prevalence setting. A recent multicenter study showed sensitivity in the smear-negative group when using a single cartridge of 73% (65–79%) (Catharina C. et al 2010). Nevertheless, even with my detected sensitivity in the smear-negative group, there was 10% (GeneXpert detected 31 out 310 smear negative cases) of increase in TB case detection compared with smear microscopy alone. This increase might be dependent on local HIV prevalence rates.
Previous studies have not evaluated the significance of culture-negative Xpert MTB/RIF-positive samples. When the significance of these results was stratified using short-term follow-up cultures, there was a 20.7% relative increase in the number of detected cases.
My data suggest that sensitivity in smear-negative TB was limited by bacterial load. Studies correlating Xpert MTB/RIF values with bacterial load are important because they inform contact tracing policies, treatment monitoring, and definition of a benchmarking threshold against which competitor assays can be measured.
A key advantage of Xpert MTB/RIF over smear microscopy is the simultaneous assessment for rifampicin resistance. This study was able find out that the sensitivity for rifampicin resistance given the limited number of cases in this category and also can confirm, similar to the findings of Catharina C, et al. 2010 using the first-generation software, that the specificity and NPV are high. Thus, the assay using the second-generation software can reliably rule out rifampicin resistance in a high HIV prevalence setting. This is crucial given the increasing burden of MDR-TB and XDR-TB in Nigeria and Africa.
A major hurdle to widespread implementation of the Xpert MTB/RIF assay in resource-poor settings is cost. Thus, a possible interim strategy to enhance uptake might be to properly sensitize the medical community to perform the assay only in all DRTB suspects and smear-negative HIV positive patients. This study lends credence to this strategy because a combination of the three diagnostic methods showed the best sensitivity and specificity.
There are few limitations of my study findings. First, this study results may reflect the bias of using one sample and aliquoting same to process using the three techniques employed for this study as the two different specimens always submitted by each TB suspect patient for laboratory investigations. By using this single sample study flow, this shows that Xpert MTB/RIF comprehensively outperforms smear microscopy.
However, this study have establish a firm rationale and provide a foundation for the design of larger and more comprehensive studies to evaluate Xpert MTB/RIF in populations infected with HIV.
In summary, the Xpert MTB/RIF assay is an accurate rapid rule-in test for pulmonary TB. It performed better than smear microscopy given that it established a diagnosis in a significant proportion of patients who are smear-negative. It also detected additional culture-negative patients and has excellent rule-out value for MDR TB. MTB/RIF test is less dependent on the user’s skills and routine staff with minimal training can use the MTB/RIF test machine. It has a short turnaround time and simultaneously detects Mycobacterium tuberculosis and RIF’s resistance in less than 3 hours. Although tuberculosis, especially in smear positive clinical specimens, the test results must always be confirmed by culture and DST.
• Xpert MTB/RIF assay should be used for the rapid detection of MTB and DRTB
• To properly sensitize the medical community to perform the assay in all DRTB suspects, DRTB contacts and smear-negative
HIV positive patients.
• This study lends credence to this strategy because a combination of the three diagnostic methods showed the best sensitivity and
specificity.