Evaluation of Heart Block in Inferior Wall Myocardial Infarction in Context of Intervention: Temporary Pacemaker Implantation versus Conservative Medical Management, a Single Centre Experience from Eastern India
Background: Association between Inferior wall Myocardial infarction (IWMI) and various degree of heart block is well known. However most of these blocks are transient. Objective of this study was to re-evaluate the need of temporary pacemaker and their effectiveness versus conservative management in those patients.
Methods: This is a Hospital Record based Observational Study. 276 Patients who were admitted with diagnosis of Acute Inferior wall myocardial infarction were treated properly and evaluated in detail. All data were analysed using SPSS and EPI software.
Results: The Mean age of the study population was 59.18 yrs. Among all patients 33 were diabetic. 42 (15.21%) patients presented with AV conduction defect. 9 patients (27.27%) who were diabetic had an AV Block. This occurrence was found to be significant (Odds Ratio= 2.3864 [1.020-5.580], Chi sq= 4.222, p=0.039). In patients with Diabetes and AV Block, an Odds Ratio=0.2500 [0.013-4.729] was obtained in a comparison of TPI status and Hospital Stay outcomes. However, the association was not significant though a higher occurrence was found among diabetics (Odds ratio= 4.000 [0.837-19.102], p(1-tailed Fischer Exact)=0.078 . Among the 42 patients with AV Block, 15(35.71%) patients underwent Temporary Pacemaker Implantation due to unstable hemodynamic condition. Out of 42 patients with AV Block, 33 (78.57%) patients were alive during the period of their hospital stay and 9 (21.42%) were dead. Also, among the 16 patients who underwent TPI, 11(68.75%) were alive and 5(31.25%) were dead. (2 had associated Renal Diseases,1 was in CRF, 1 had dyselectrolytemia with Cardiogenic Shock and 1 had Fatal Arrhythmias. In this study, the average duration of block in patients with Inferior Wall AMI with AV Block was found to be 4 days.
Conclusion: This study conclude that with timely usage of Thrombolytics and Anticoagulants, the necessity of TPI may be markedly reduced so as the complications. AV Block following Acute IWMI is more commn in diabetics and average duration is 4 days. If a Secondary Coronary Intervention is planned it should be preceded by a PPI. Further study in the form of a controlled trial is necessary to support our findings.
Keywords: Inferior Wall myocardial Infarction (IWMI); Temporary Pacemaker Implantation (TPI); Thrombolysis
Acute Inferior Wall Myocardial Infarction (IWMI) constitutes about 40-50% of all Acute Myocardial Infarction (AMI) [1]. The Inferior Wall of the Heart is supplied by branches from the Right Coronary Artery (RCA) and the Circumflex branch of Left Coronary Artery. The Sino-atrial Node is supplied by the Sino-atrial nodal artery which is a branch of Right Coronary Artery in 63% cases and the Left Coronary Artery in 37% cases (95% from the proximal part of the circumflex branch) [2]. The artery to the Atrio-ventricular node is derived from the Right Coronary Artery in 90% cases and Left Coronary Artery in 10% cases and it origin depends on topographic arterial dominance.
Acute Inferior Wall Myocardial Infarction (IWMI) mostly occurs due to obstruction of the blood supply in the Right Coronary Artery. So, as an associated feature, IWMI are usually complicated by Conduction abnormalities including Sinus Bradycardia, 2nd degree Heart Block (Mobitz type I) and Complete Heart Block (as the SA node, AV node and Right Bundle Branch usually derive their blood supply from the Right Coronary Artery) [3]. Arrhythmias that occurs early in the course of IWMI is usually due to Vagal over-activity and is usually transient [4]. But those Bradyarrhythmias that occur late (i.e. after 6 hours of IWMI) are usually resistant to pharmacologic treatment and often require temporary pacing to improve prognosis (mostly in cases of Complete Heart Blocks) [5].
In this retrospective record based study, we intend to review the need for temporary cardiac pacing in cases of Bradyarrythmias following IWMI and the average duration of observation that must precede before Temporary Pacemaker Implantation (TPI) in asymptomatic and symptomatic IWMI patients (having a setup with time from ICCU to TPI being <5mins).
Our study is a Hospital Record based Observational Study which consists of patients who have been directly admitted in the Department of Cardiology, Calcutta National Medical College & Hospital, Kolkata from Cardiology OPD and also as referred cases from other hospitals on emergency basis in the time period between Sept’14 and Jan’16.
The records selected for the study consisted of patients with Type 1 (Spontaneous) Acute Inferior Wall Myocardial Infarction who presented with recent onset chest pain (Duration <24hrs) and EKG changes suggestive of Acute Inferior Wall Myocardial Infarction. Some of the patients also presented with other associated symptoms such as Syncope, Light-Headedness, Respiratory Distress, Palpitation, Weakness of one side of the body etc. The Diagnosis of Acute Myocardial Infarction was made by presence of 2 or more criterias: Precordial Chest Pain, a Troponin T Card test and EKG changes specific of Acute Inferior Wall Myocardial Infarction (ST segment elevation in leads II, III & aVF along with ST segment elevation in leads representing other adjoining areas of the heart). Since the patient load handled by the department is high and there is no temporary ICU facility present for observation of the patients, not all patients are admitted in the ICCU and they are transferred to the ICCU depending on the availability of bed and their clinical status. After admission, they are rountinely monitored with the following blood tests: Fasting Blood Sugar, Serum Urea, Serum Creatinine, Serum Electrolytes (Na+ and K+) and Serum Creatine Phosphokinase (Total and MB isoenzyme). A baseline level of Lipid Profile and Liver Function Test is also recorded. The Diagnosis of Atrio-Ventricular block was made from specific EKG changes [1st degree: PR interval prolongation (>0.2sec), 2nd degree: Increasing successive PR interval duration with a dropped QRS complex (Type 1) & Variable conduction of SA node impulses (Type 2) and 3rd degree: Complete Atrio-Ventricular dissociation (usually ventricular rate <40/min) with non-synchronous p wave and QRS+T waves].
All patients received standard Acute Myocardial Infarction treatment. Patients who were candidates of thrombolysis, received Inj Streptokinase (1.5 million IU dissolved in 100 ml Normal Saline infused over 45 mins-1hr). A subset of the study population had contraindications to thrombolysis therapy (Most often due to admission after 6 hrs of Acute Myocardial Infarction and secondly, due to previous history of hemorrhagic stroke or bleeding tendencies) and they did not receive any plasminogen activators. Patients received anticoagulants (either Low Molecular Weight Heparin or Fondaparinaux) if not contraindicated.
Patients with Complete Atrio-Ventricular block who are symptomatic (Symptoms such as Syncope, Light-headedness, On-going chest pain and respiratory distress) or whose ventricular rates are less than 40/min are advised Temporary Cardiac Pacing. Many patients are able to afford the charges of getting a temporary pacemaker implanted, but many of them are not able to afford a temporary pacemaker implantation. A subset of our study population with Complete Atrio-ventricular Block were asymptomatic and having the facility of Cath Lab nearby (Time taken from ward to Cath Lab and Implantation of a Temporary Pacemaker being <5 mins), these patients were observed closely. If they turned out to be symptomatic, they were adviced Temporary Pacemaker Implantation. If the Atrio-ventricular Block resolved with time during their hospital stay, the patients were discharged to be further followed up. 2nd degree Heart Block if symptomatic was managed in a similar way as for Complete Heart Block. 1st degree heart block and asymptomatic 2nd degree heart block were managed conservatively.
Patients who were known diabetics or had New elevated Fasting Blood Glucose (>126mg/dl) were monitored with Capillary Blood Glucose Thrice daily and were treated with insulin to attain strict glycemic control. In addition, Serum Fasting Blood Glucose was also measured from the venous blood sample at frequent interval.
All patients were hospitalised until their AV Block resolved, to monitor their vital signs and to provide temporary pacemaker support whenever necessary. So, we defined the endpoint of our study as being discharged Uncomplicated or with MACE. Patients who underwent a TPI, were immediately transferred to the ICCU (if previously in ward, so that their ICCU transfer-in date was same as the Temporary Pacemaker Implantation date). If a patient is in ICCU, patient’s TPI insertion date was mentioned separately in our collected records. Also, If a patient, whose TPI has been performed, is to be discharged from the ICCU, then the patient is kept in the ICCU for an extra day following the day when the decision to remove TPI has been taken, for monitoring of vitals and checking the feasibility of TPI removal. So, the total ICCU stay in them following TPI insertion is 1 day less than the recorded days.
Statistical analysis was conducted using the software Stata 14 and Epi Info 7 to calculate the mean Age of Acute Inferior Wall Myocardial Infarction and Atrio-ventricular Block Following it, mean Duration of Hospital Stay in cases of Acute Inferior Wall Myocardial Infarction and Atrio-ventricular block following it, the proportional prevalence of Atrio-ventricular Block following Acute Inferior Wall Myocardial Infarction on the basis of Sex. Chi-Square test and Odds Ratio was used to determine the association between diabetes and occurrence of Complete Heart Block following Acute Inferior Wall Myocardial Infarction. Chi-Square test was also used to test the significance of Temporary Pacemaker Implantation associated results in High Grade (2nd and 3rd degree) Atrio-ventricular Block following Acute Inferior Wall Myocardial Infarction (thrombolysed and non thrombolysed separately). The P-value for statistical significance was determined by Fischer Exact value calculation where any cell value was less than 5. In this study, the outcomes of Temporary Pacemaker Implantation have been considered to be Survival (during the period of Hospital stay) followed by discharge or Death (during Hospital stay) for the purpose of efficiency testing. The Box Plot was generated by STATA 14.
A total of 276 patients were included in the study after exclusion of 7 patients who had incomplete data. The Mean age of the study population was 59.18 yrs and its standard deviation is 10.62 years. The group comprised of predominantly males with males:females=203:73. All patients had isolated Acute Inferior Wall Myocardial Infarction except 12 patients: 6 with Lateral Wall Extension, 1 with Extended Inferior Wall Myocardial Infarction, 1 with Antero-Inferior Myocardial Infarction, 1 with Posterior Wall Myocardial Infarction and 2 with Old Antero-septal Myocardial Infarction in addition to Inferior Wall Myocardial Infarction. 1 patient had Lateral Wall Extension along with Extended Myocardial Infarction. 33 patients were diabetic and 243 were non diabetic (Table 1 and 2a).
Being a tertiary care hospital majority of the admitted patients receive Thrombolytic therapy unless otherwise contraindicated. Also, majority of the population received anti-coagulation unless otherwise contraindicated. The choice of anti-coagulant used depended on the physicians’ choice and availability in the hospital; there was no randomisation in the process of selecting patients for anticoagulation.
Among the 42 patients with AV Block, 15 patients underwent TPI due to unstable hemodynamic condition or symptoms of syncope, dizziness etc. associated with Hypotension due to High Degree Heart Block (Table 2b).
Our motto of this study was to primarily appreciate the effects of TPI over the patients’ (AV Block following Inferior Wall AMI) health status during his hospital stay and the Role of Diabetes Mellitus in the occurrence of AV Block following an Inferior Wall AMI and its outcomes. The Occurrence of AV Block following Inferior Wall AMI showed a slight Male preponderance (Odds Ratio=1.600 [0.703-3.640]) but a larger population would be necessary to confirm the findings.
Out of 33 patients who were known Diabetics, 9 had an AV Block while 24 did not have one. The occurrence of AV Block following an Inferior Wall AMI in known diabetics was found to be significant (Odds Ratio=2.3864 [1.020-5.580], Chi sq=4.222, p=0.039) (Table 3a).
In patients with Diabetes and AV Block, an Odds Ratio=0.2500 [0.013-4.729] was obtained in a comparison of TPI status and Hospital Stay outcome (Table 3b). This indicates a poor resolution of AV Block spontaneously in Diabetics and also there could be a necessity of Early Permanent Pacemaker Implantation to help in improving the survival of the patient. But, the result was insignificant and would need a larger study to confirm our findings. Also a greater need of TPI in Diabetics with AV Conduction Block following Inferior Wall AMI was assessed by an Odds Ratio of Diabetics to TPI needed, which was 1.40 [0.3143-6.2363]; p-value (Fischer Exact) was found to be insignificant (Table 3c).
However, the Association of occurrence of Complications following AV Block in Inferior Wall AMI with Diabetes was not significant though a higher occurrence was found among diabetics (Odds ratio=4.000 [0.837-19.102], p(1-tailed Fischer Exact)=0.078 (Table 3d). A study with larger diabetic population shall bring about a more statistical approximation of the risk of complications in AV Conduction Blocks following Inferior Wall AMI.
The outcome of TPI done in AV Block following Inferior Wall AMI would also be affected by concurrent Thrombolytic Therapy and Anticoagulation. We wanted to find out if a major portion of the patient population benefited by TPI in cases of AV Block following Inferior Wall AMI or the effects are equivocal to standard uncomplicated AMI management protocol.
In patients with AV Block, Thrombolysis resulted in good improvement in mortality rate during hospital stay (Odds Ratio of Survival=1.333 [0.285-6.232], Fischer Exact 1-tailed p=0.514) (Table 4a). Also, Anticoagulant (LMWH) administration was significantly associated with reduced mortality (Odds Ratio of Survival=7.636 [1.359-42.900], p=0.032) (Table 4b). These results can be attributed to the nature of the AV conduction block that occurs in Inferior Wall AMI, majority of which is due to temporary Vagal hyperactivity that improves with return of blood supply by Thrombolytics and anticoagulants.
On the other hand, Temporary Pacemaker Implantation in indicated patients did not yield a clear-cut superior result in alleviating patient’s mortality during hospital stay (Odds Ratio of Survival=0.400 [0.0892-1.792]; Fischer Exact 2 tailed p=0.265) (Table 4c). In our study, only 3 (18.75%) patients received Thrombolytics, 8 (50%) patients received Anticoagulant (LMWH) and 1(6.25%) patient received both Thrombolytics and Anticoagulants. So, we intended to visualise the role of Thrombolytics and Anticoagulants in the background, when a plan was being made for TPI as per indication. Also, we calculated the Need for TPI following Thrombolysis and its Odds Ratio was found to be 0.1978 [0.0453-0.8631], which was statistically significant (Fischer Exact 1-tailed p= 0.0252) (Table 4d). In addition to Thrombolysis, we calculated the Need for TPI with concurrent Anticoagulant use following hospital admission and it yielded a similar result with an Odds Ratio=0.444 [0.122-1.608], though in this case the finding was not statistically significant (p=0.212) (Table 4e). Patients in whom TPI was done, we assessed the role of Thrombolytics and Anticoagulants in the outcome of conducted TPI. The Odds Ratio of Survival with prior Thrombolytics use followed by TPI vs TPI without prior Thrombolysis was 2.000 [0.077-51.595]; Fischer Exact 1-tailed p=0.642 (insignificant) (Table 4f). Odds Ratio of survival with concurrent Anticoagulant use along with TPI vs TPI without concurrent anticoagulant use was undefined as all patients who received Anticoagulants survived during their hospital stay and ZERO number of patients died with concurrent Anticoagulant administration along with TPI. A comparison of concurrent Thrombolytics, Anticoagulants and TPI usage with exclusive TPI usage was planned to be done from the collected data, but unfortunately, our data was not large enough to allow such comparison. These results can be attributed to the role of early thrombolyis and anticoagulation, which prevents permanent damage of the conducting tissues of the heart and allows a better prognosis of AV conduction defects treated with subsequent TPI.
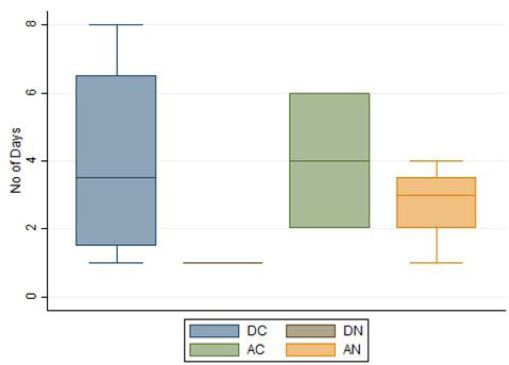
We estimated the average number of days, our patients had to stay in the ICCU following a TPI procedure till an above mentioned primary endpoint was attained (discharged AV Block free or Death). It was quite evident from our collected data (Table 4g and Figure 1) that, Patients with Complications in addition to High Grade AV Block had longer ICCU stay (till temporary pacing was stopped) as compared to those without any complications.
On the basis of this retrospective study, we conclude that Diabetes Mellitus is an important risk factor for AV conduction disturbances following Inferior Wall AMI and it is not only important to keep in mind the increased risk of occurrence of Complications due to Complete Heart Block in diabetics, rather the Blocks may be refractory to Temporary Cardiac Pacing support, forcing us to think of an early decision to implant a Permanent Pacemaker which could prevent TPI associated complications like Lead Displacement related complications, Pericardial Tamponade, Infective Endocarditis, Pneumonitis, Basal Atelectasis,, Decubitus Ulcers etc.
With the significant TPI related statistical data, we conclude that TPI as an exclusive tool is not a superior mode of management of AV conduction block following Inferior Wall AMI as compared to standard management protocol of uncomplicated AMI. Rather, conducting a TPI in patients who have not undergone proper timely Thrombolysis and/or have not received adequate Anticoagulation may not yield the benefits of Temporary Cardiac Pacing as observed in our study, where majority of the AV Conduction Disturbance subset of our study population did not receive Thrombolytics and Anticoagulants. Further, we can also conclude that with timely usage of Thrombolytics and Anticoagulants, the necessity of a Temporary Pacemaker Implantation may be markedly reduced (Table 4d and 4e). So, wherever possible, the standard management of uncomplicated AMI should be emphasized and strictly followed prior to Temporary Pacemaker Implantation to maximize the benefits of this crucial interventional procedure. The ICCU stay duration of patients undergoing TPI throws light to the Refractory nature of the block in patients with complications in addition to Heart Block and these patients may be planned for a Permanent Pacemaker Implantation following a wait period of 4 days from the day of onset. If a Secondary Coronary Intervention is planned it should be preceded by a PPI. Further study in the form of a controlled trial is necessary to support our findings.