Evaluation of Screening Tests in a city district of Campania region in Italy during the Second SARS-CoV-2 Wave”
The main mechanism for spreading SARS-CoV-2 is by close contact and short-range transmission of infectious droplets. In this context, testing is a functional tool for identifying potentially infected individuals. It allows not only to isolate and identify contact traces, but also to select the appropriate measures concerning the infected. Early diagnosis is crucial for patient management and outbreak control. The analytical gold standard for the detection of the virus SARS-CoV-2 is the reverse transcription-quantitative polymerase chain reaction (RT-qPCR) from a nasopharyngeal swab or throat swab. According to local protocols, the use of Rapid Antigen Tests (RATs) is the recommended preventive strategy for testing asymptomatic people who were visitors, patients, and residents in hospitals. Also Rapid Antigen Tests (RATs) is recommended to for employees working at critical institutions, for caregivers living in close contact to elderly with pre-existing illnesses but also for people who had contacts with diseased. We report a screening of COVID-19 local trend; during a period of seven months (since January 2021 to July 2021), comparing the different restriction zone in one of the Naples districts in Campania, Italy. Samples, taken from 4,778 individuals coming to a pharmaceutical presidium in a district of Naples in Campania. This samples were processed, during the “second wave” pandemic, through the rapid antigen test (Orient Gene Biotech Co., Ltd, Zhejiang, China). This rapid antigen test is able to detect quickly the nucleocapside protein antigen of SARS-CoV-2. The RATs detected 85 of 4778 (22 asymptomatic and 63 symptomatic) positive individuals, confirmed by RT-PCR with no false positive results. The incidence rate of positive cases was about 20.0 for the period from January to May 2021, with the highest pick in March (24.8) and in May (25.04). The use of RATs can benefit all adult population and can help healthcare workers to detect rapidly symptomatic or asymptomatic individuals.
Keywords:COVID-19; Diagnosis; Rapid Antigen Test; Pandemics, SARS-CoV-2, Nasal Swab; Close Contact
The COVID-19 pandemic in 2020 and still today, has caused death and economic misery in all countries of the world. The disease was named as Coronavirus Diseases 2019 (COVID-19) by World Health Organization (WHO) and it is caused by a type of coronavirus called Severe Acute Respiratory Syndrome Coronavirus 2 (SARS-CoV-2) [1]. Coronavirus disease 2019 (COVID-19) was first detected in Wuhan, China [2, 3]. Since then, the COVID-19 pandemic has rapidly spread all over the world, due to the highly contagious nature of the virus and the rapidity of its transmission.
In Italy, the first two cases of COVID-19 arrived on January 30th 2020, both with a travel history to Wuhan, China [4, 5]. From that moment, the transmission started in several cities in Lombardia Region [6]. In the following days and weeks, case counts, and death tolls increased rapidly, first in Northern Italy, and then in the rest of the country. The Italian government imposed increasingly strict physical distancing measures and culminating in a national lockdown declared on March 10th 2020 that ended on May 3rd 2020. A second wave of the pandemic progressively arose starting from mid-August 2020, to February 3rd 2021. In Italy during this time were found 2,579,763 cases and 88,533 deaths. Therefore, to contain the spread of the virus, the Italian government adopted new methods of restriction depending on the number of positive cases in each region. The regions were differentiated into three zones (red, orange and yellow) [7]. The red zone is the most critical area in which movements into and out of the Region and within the territory itself are prohibited, movement of people is limited (except in cases of necessity and urgency) and also restaurants, schools, shops and beauty centers are closed. The orange zone is the medium-high critical area, only the movements strictly necessary to ensure the performance of school activities in presence are allowed and shops and beauty centers are open. The yellow zone is the area at the moderate risk level, restaurants, schools, shops and beauty centers are open [8]. Campania is a large region in Southern Italy, with about six million inhabitants. Cases in this region has been lower than in Northern regions during the first pandemic wave while numbers increased from August 2020 to February 2021 during the second wave with 259,715 positive cases on a total of diagnostic tests done (2,585,379) [9]. Coronaviruses infection has a wide spectrum of clinical severity, ranging from asymptomatic cases to more severe and even fatal respiratory damage [10, 11]. The major manifestations of coronavirus infection include fever, tiredness, and dry cough. In some cases, nasal congestion, runny nose, sore throat, myalgia and diarrhea are detected.
Furthermore, the COVID-19 pandemic represents a multifaceted threat and has had a tremendous impact on the global economy [12]. Rapid and accurate diagnosis of COVID‐19 is essential to facilitate treatment, reduce the spread of disease, protect healthcare workers and ensure the optimal use of personal protective equipment.
The tests currently used to diagnose SARS-COV-2 are of 3 types: Molecular test, Rapid antigen testing and Serological test. These tests differ depending on how you collect the sample, type of analysis, reliability and response time. Diagnostic tests for Sars-COV-2 infection are crucial for timely management of the virus. Only in this way, it is possible to support the tracking of positives and also detect asymptomatic cases to determine a reduction in the progress of the pandemic. Even if to screen large population has been used the serological test or the Rapid Salivary test anyway, the analytical gold standard for virus detection and some of its variants is the molecular test, based on reverse transcription-quantitative polymerase chain reaction (RT-qPCR) from a nasopharyngeal swab or throat swab. This test is expensive, time consuming, and requires trained specialized staff and it can take several hours to obtain the result. On the contrary, rapid antigen detection tests (RATs) are spreading worldwide, even if considered less sensitive, they have the advantages of simple operation, short turnaround time generating results within a short period of time (20 min), low cost, independency of specialized staff and not requiring laboratory instrumentation [13, 14]. The use of rapid antigen tests is important for carrying out population screening [15]. The purpose of mass screening using rapid antigen tests is to control and monitor the spread velocity of the SARS-CoV-2 and its severity. Mass testing with RATs to identify the presence of viral proteins expressed by the virus was a common choice in Europe from autumn 2020 and their use has been proposed in Italy in various contexts of daily life, such as in educational, working or recreational environments. Due to the fact that timely diagnosis of SARS-CoV-2 infection with subsequent contact tracing and rapid isolation is a critical public health strategy to contain the COVID-19 pandemic, here we report a screening of COVID-19 local trend describing the areas differences during a period of seven months (since January 2021 to July 2021), comparing the different restriction zone in one of the Naples districts in Campania region in Italy.
The aim of the study was to conduct a local epidemiological analysis and field verification of rapid tests, relatively inexpensive, simple to perform and enable obtaining results within few minutes have been able to screen the total number and the proportion of positive results on asymptomatic or mildly symptomatic inhabitants in our region and to evaluate the temporal trends during the period of observation.
Nasopharyngeal swabs were collected from 4778 mildly symptomatic or asymptomatic individuals. They decided to do the test because they had a contact with an infected person or they did it for voluntary screening. The test was detected in the pharmaceutical presidium Maurelli, in Naples, Italy, from January to July 2021. [16].
Results were communicated to the ASL Napoli 1 by uploading on regional IT platform E - Covid Sinfonia. Before performing the swab, to the individuals it was measured their body temperature using an infrared thermometer (DT-8836M) and it was given a questionnaire where they were asked for their personal data, and if they presented symptoms, specifying which ones (rhinorrhea, cough and/or dyspnea, nausea, abdominal pain and/or diarrhea, loss of taste and smell). Also, each individual needed to sign an informed consent before preforming the nasopharyngeal swab.
Coronavirus Ag Rapid Test Cassette (Orient Gene Biotech Co., Ltd, Zhejiang, China) has been used in this study. It is an in vitro immunochromatographic assay for the qualitative detection of SARS-CoV-2 nucleocapsid protein antigen in nasopharyngeal swab specimens from individuals who are suspected of COVID- 19. This kit showed sensitivity of 96.72% (95%CI: 88.65%-99.60%), specificity of 99.22% (95%CI: 97.21%-99.91%) and accuracy of 98.74(95%CI:96.80%-99.60%) [17].
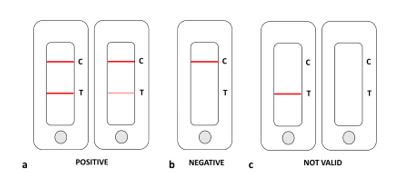
According to kit instructions, nasopharyngeal swab was placed in a tube containing 300 μL extraction buffer provided in the kit, rolled 6 times and left inside for 1 minute. After this time, nasopharyngeal swab was removed and 100 μL of extracted simple was added on a test device and the test result was read in 15 – 20 minutes. For viewing the results, the test strip consists of a control region (C) and a test region (T). The control region (C), represented by a red line, indicates the presence of the sample and its absorption. The test region (T) is constituted by colloidal gold conjugated to monoclonal antibodies against the nucleocapsid protein of SARS-CoV-2. Test device showing two colored lines, control (C) and test (T), indicated positive COVID-19 antigen result. In figure 1 interpretation of rapid SARS-CoV-2 antigen test results is shown.
Demographic data were shown as numbers and percentages and continuous variables were presented as the median and interquartile intervals (Q1 – Q3).
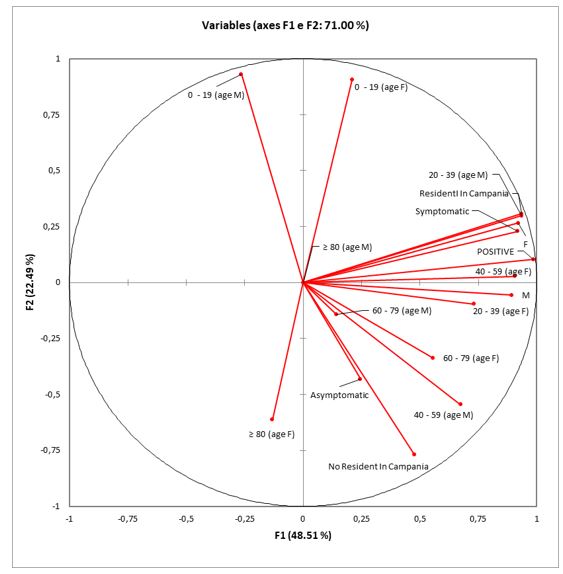
Principal Component Analysis (PCA) was carried out to observe correlation between the variables (number of positives, sex, age groups by sex, asymptomatic, symptomatic, resident and non-resident in Campania).
Data regarding the number of swabs were carried out and the number of positives in the Campania region were taken from the official site of the Campania region [7], while the data regarding the number of COVID-19 vaccines were carried out in Italy from “Our World in Data” [18].
Incidence rate was calculated by dividing the numbers of positive cases to COVID-19 by the number of total swabs carried out and normalized to 1000.
Chi-square test was used to evaluate differences between groups; p-value of < 0.05 was considered statistically significant.
Statistical analyses were performed using Microsoft® Excel 2016/XLSTAT©-Pro (version 7.2, Addinsoft, Inc., Brooklyn, NY, USA).
From January to July 2021, 4778 people came to the Maurelli Pharmacy, in Naples, Italy, to undergo the rapid SARS‑CoV‑2 antigen assay.
The median (Q1 – Q3) age was 38 (24 - 53), 44.5% (n= 2128) were males and 9.3% (n= 447) were not resident in Campania. Most of the tested people showed no symptoms of COVID-19 (94.6%, n= 4523), while those with symptoms associated with COVID-19 represented the 5.4% (n= 255), of which 2.2% (n= 107) showed rhinorrhea, cough and/or dyspnoea and only 0.7% (n= 3) manifested loss of taste and smell. Of the total number of RAT carried out, 1.8% (n= 85) tested positive for COVID-19, with an incidence rate of 16.97. The median (Q1 – Q3) age was 35.5 (23.3 – 52.8), 53% (n= 45) were males and 9.8% (n= 8) ware not resident in Campania. Positive asymptomatic were 25.9% (n= 22), while positive symptomatic were 74.1% (n= 63), most of them manifested rhinorrhea, cough and/or dyspnoea 56.5% (n= 48), 14.1% (n= 12) had body temperature ≥ 37.5 °C, all people with nausea abdominal pain and/or diarrhea were negative, and, on the contrary, people, who showed loss of taste and smell (3.5%, n= 3) were positive, (Table 1).
Positive people were contacted 15 days after and positivity was confirmed by molecular tests for all of them. Through the analysis of the principal components (PCA), the correlation between the variables: number of positives, sex, age groups by sex, asymptomatic, symptomatic, resident and non-resident in Campania was analyzed. The first dimension of PCA represents 22.49% of initial information, while the second dimension represents 48.51%. The analysis shows that the variable number of positives is positively influenced by the variables number of symptomatic, number of subjects aged between 20 - 39 years of male sex and 40 - 59 years of female sex and resident in Campania (Figure 1). On the contrary, the other variables negatively affect the positive variable, (Figure 1).
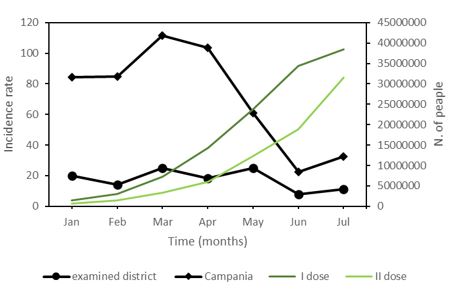
During the period considered, we observed that the incidence rate of positive cases was about 20.0 from January to May, with a highest peak in March (24.8) and in May (25.04) and then decreased almost the half in June (7.65) and in July (11.25) (Figure 2), A decrease in incidence was also observed in the regional trend starting from April, due to the effect of the national vaccination campaign. Indeed, at the beginning of the observation period only 2.3% of the Italian population had received the first dose of anti-covid vaccine and only 1.1% were fully vaccinated, until July 31st with 52.3% of fully vaccinated people.
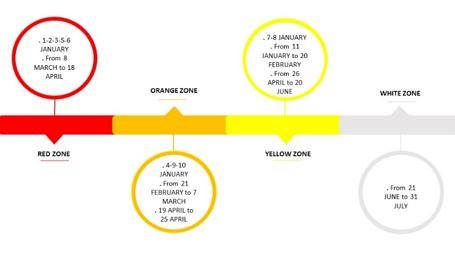
From January to 21st June, Campania region went through periods of restriction and was named red, orange or yellow zone, and from the 22st of June it was white zone (Figure 3).
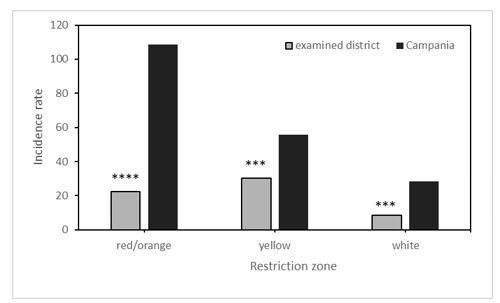
In this study, we have also considered the cumulative number of positives on processed swabs during continuous periods of restriction, and our data were compared with the total data of Campania region. As shown in Figure 4, the incidence rate of COVID-19 was lower in the examined district (22.41) already in the red zone compared to the regional trend (108.67), while in white zone it showed an incidence rate of 8.35, and the regional one was of 28.56.
Severe acute respiratory syndrome coronavirus 2 (SARS-CoV-2) is a highly infectious and occult virus that causes pneumonia, severe acute respiratory syndrome, and even death. Although the outbreak was controlled by the development of quarantine measures, many people have been infected. From the initial emergency phase, preventive behavioral hygiene measures have been provided from the Ministry of Health. The citizens during work and during daily life must compulsorily respect these measures [1, 19]. Recommended preventive behavioral hygiene measures include social distancing, avoiding gatherings, wearing face masks in public, ventilation in closed environments by opening the windows several times and air-filtering, hand washing, covering one’s mouth when sneezing or coughing, disinfecting surfaces, not touching eyes, nose and mouth with hands, avoiding handshakes and limiting the stay in the common areas, in particular in the refreshment areas such as bars, restaurants and break areas [10]. Several methods have been developed for detecting SARS-CoV-2, but due to its price and efficiency, rapid antigenic tests are promising tools in the diagnostic of infected individuals. In fact, mass testing with antigen tests that identify the presence of viral proteins expressed by the virus was a common choice in Europe in autumn 2020 due to the point-of-care test application and fast result delivery.
Our study shows that Coronavirus Ag Rapid Test Cassette is reliable to diagnose SARS-CoV-2 infection. Nasopharyngeal swab sampling was performed in individuals with suspected COVID-19 symptoms by the pharmaceutical presidium Maurelli in a district of Naples, Italy. Data are presented for the period of 7 months from January 1, 2021 to July 31, 2021 with a total of 4778 out of 85 individuals (1.8%) tested positive by RATs and returned positive RT- PCR results. PCA analysis had shown that symptomatology, the age for male between 29-39 and the age for female between 40-59 are the major risk components. Positive symptomatic individuals showed frequently the loss of taste and rhinorrhea. These results occurred during a time in which vaccination rates were much lower in the region, so couldn’t influence the impact of testing.
The test allowed the identification of patients who tested positive also with the molecular test, which would allow improved patient tracking and bring forward possible isolation [20].
These tests cannot be considered as a replacement to RT-PCR, but a complement for the diagnosis of SARS-CoV-2 infection above all for asymptomatic individuals with high viral loads, because this is particularly useful in situations of high prevalence of the disease. RATs could be used as a screening tool in asymptomatic populations to detect individuals with high infectious capacity for the control of this pandemic.
The antigenic test showed excellent performance characteristics when it was performed in samples with high viral load or samples taken within the first five days after the onset of symptoms. The limit of this study could be the fact that false negative results could be observed at low viral loads in nasopharyngeal samples and this may occur very early in the infection (presymptomatic stage) before viral replication peaks, or in a late stage of infection when replication has decreased.
If the tests were performed after 4-5 days from the contact, the COVID-Ag rapid test could result in a lot of positive diagnosis, meaning that the higher the prevalence and correct the number of days since the contact, the higher the sensitivity of the test. We know the fact that our study population is not representative of the general population of Campania region since participants also came from other cities, and especially because the examined district is a central high-income district in Naples, where people is presumably more responsive to the use of protections and to vaccination. The rapid spread of the COVID-19 pandemic had shown that, even if this study has some limitations, the methodology used for the detection of positivity has an irrelevant percentage of false positives that is absolutely acceptable, and that some symptoms, such as the increase in temperature still applied today for a first screening of positivity has a low correlation, while others, although the sample is relatively small, are decidedly more relevant. The data also indicate that the procedures such as obligation to wear face masks, handwashing and bans of mass, and the distinction in zones according to the spread of the virus, respond in an important way to the reduction of infection. Therefore, the SARS-CoV-2 antigen tests are suitable for point-of-care detection and provides a great application for SARS-CoV-2 epidemic control in all countries.
In conclusion, this study provides insights into the capacity of our health systems to respond to COVID-19 during times of crisis.