Factors Affecting the Adoption of Sustainable Land Management Practices at Farm Level in the Northeastern Highlands of Ethiopia: The Teleyayen Sub-Watershed Case Study
This study examines factors affecting the adoption of sustainable land management practices in the Teleyayen sub-watershed case study. Data collection was undertaken through the household questionnaire survey, key informants interviews, and focused group discussions. A binary logistic regression model and descriptive statistics were used to analyze the data. The variables found to have a positive and significant influence on the adoption of sustainable land management practices include land tenure security, the age of the household head and relief support/food aid. Livestock ownership, perceptions of technology profitability, the method of land acquisition, farming experience, a productive safety net program and policy support are the variables with significant negative influence. Further, the results indicated that a majority of the households (74.4%) responded that they received insignificant policy support on the importance of the adoption of sustainable land management practices, while (25.6%) of them responded that they received significant policy support from concerned government bodies. Moreover, the key informant interview results also showed that lack of good governance, shortage of farmland, shortage of labour, financial constraints, lack of awareness and negative perception towards sustainable land management practices are the main reasons for farmers not to adopt the required practices.
Keywords: Land Degradation; Soil and Water Conservation; Technology Adoption
List of Abbreviations: FGD: Focus Group Discussion; PSNP: Productive Safety Net Program; SLM: Sustainable Land Management; SSA: Sub-Sahara Africa; SWC: Soil and Water Conservation; TLU: Tropical Livestock Unit
In Ethiopia, land degradation is one of the major causes of low and in many places declining agricultural productivity and continuing food insecurity and rural poverty. Attaining sustainable pathways out of the downward spiral of land degradation and poverty need that farmers adopt profitable and Sustainable Land Management (SLM) practices, or pursue alternative livelihood strategies that are less demanding of the land resource. The government of Ethiopia and a group of donors has invested substantial resources to develop and promote SLM practices as part of efforts to improve environmental conditions, ensure sustainable and increased agricultural production, and reduce poverty. Nevertheless, due to low rates of adoption, most of the promoted land management practices have been only partially successful. In some cases, dis-adoption of technologies has been reported [1]. Past efforts to develop and promote these practices ignored the pronounced regional diversity of the country. For instance, the distribution and amount of rainfall vary greatly both in spatial and temporal terms across Ethiopia. However, similar SLM practices such as soil and water conservation (SWC) technologies, for example, stone bunds, soil bunds, reduced tillage, and chemical fertilizer have been promoted in all agro-ecologies irrespective of their performance under different environmental conditions. Therefore, to raise productivity, technology must be adopted in the production process and the rate of adoption of new technology is subject to its effectiveness, the degree of risk associated with it, capital supplies, agricultural policies and socioeconomic characteristics of farmers [2]. The adoption of innovation is the last step in a decision process to make full use of innovation having considered that such practices will influence positively on the livelihood of the adopters.
Agriculture is the main economic activity in Sub-Sahara Africa (SSA), which supports more than 67% of the population, out of which 60% depends on rain-fed agricultural practices; generating 30-40% of the country’s Gross Domestic Product [3]. Nevertheless, rainfall is poorly distributed in these countries [4]. High losses occur due to high surface runoff during high-intensity rains, poor crop rooting conditions, past and present soil erosion and evaporation losses from soil and crop canopy in particular during pre-planting and early crop stages [5]. Such uncontrolled runoff can cause damaging flash floods, severe erosion, increased water turbidity, and substantial water loss. Although many efforts have been made with regard to SLM practices in Ethiopia in general and in the study area in particular, the problems of land degradation and food security have continued to persist and attention to participation and adoption of SLM practices is still low; there are no studies done on assessing factors affecting the adoption of SLM practices in this particular watershed. Hence, this study was conducted in order to fill this gap. The results of this study could benefit farmers, rural and agriculture development offices, policy-makers, and other governmental organizations that operate in the field of SLM by revealing the existing situations in the study area. It also enhances understanding of the significance of the adoption of SLM practices that contribute to improving agricultural production by reducing land degradation at the farm level.
Land degradation refers to the decline of land productivity through the process of reduced soil biological diversity and activity, damage of soil structure, soil elimination due to wind and water erosion, acidification, salinization, water-logging, soil nutrient mining, and pollution [6]. Likewise, described land degradation as the impairment of land productivity through several processes like wind and soil erosion, salinization, water-logging, reduction of soil nutrients, and soil pollution [7]. Soil erosion and soil nutrient loss are usually viewed as the most important difficulties among different forms of land degradation in the Northern Highlands of Ethiopia while soil moisture strain, which is exacerbated by soil erosion and weakening of soil organic matter, is a common land degradation problem in most of the semi-arid areas [8].
Drivers of land degradation can be grouped into two types. They are proximate and underlying causes [9,10]. Proximate causes are those that have a direct result on the terrestrial ecosystem. These encompass natural conditions related to climatic conditions and extreme weather events such as droughts and coastal surges. Key proximate drivers also include climatic conditions, topography, unsuitable land-uses and inappropriate land management practices, and wildfires. Dry-arid and semi-arid lands are liable to fires which may lead to severe soil erosion [11]. The erratic rainfall in these areas may also be thought to increase the salinization of the soil [12]. Similarly, practicing unsustainable agriculture, such as land clearing, overstocking of herds, charcoal and wood extraction, cultivation on steep slopes, bush burning, pollution of land and water resources, and soil nutrient mining [13,14]. Most deforestation activities are connected with the continued demand for agricultural land, fuel-wood, charcoal, construction materials, and resettlement of people in forested areas. This often happens against the backdrop of unsuccessful institutional mechanisms to preserve forests. Grazing pressure and decline of the tree cover also reduce rangeland productivity [15]. On the other hand, according to, land tenure, poverty, population density and a weak policy and regulatory environment in the agricultural and environmental sectors are the most important drivers of land degradation [16]. He also stated that insecure land tenure may act as an obstacle to investment in sustainable agricultural practices. Similarly, Tiffen M, Mortimore M, Gichuki F, reported that a growing population without proper land management practices will consume the capability of the land to offer ecosystem services [17]. It is also argued that population pressure leads to the expansion of agricultural lands into fragile areas and decrement of fallow periods in the cultivated plots. However, this is not always the case. Population pressure has been found to increase agricultural intensification and higher land productivity as well as the technological and institutional invention that reduce natural resource degradation [17,18].
Feder G, Umali DL combined many cross-country studies that relate the extent of technology adoption to factors such as farm size, farmer’s human capital, labour availability, training experience, and technology cost and liquidity limitations. Policy support given to farmers on the importance and implementation of SLM practices should also be taken into account. Accordingly, the overall policy framework needs to be reliable and coherent, in particular in the context of agricultural policy reform, trade liberalization and multilateral environmental agreements. This involves a more unified approach in terms of setting objectives for sustainable agriculture, defining research and development priorities, and directing and implementing policy measures at the proper level. For instance, where the sustainability issue is local, objectives might best be addressed through local solutions. Nonetheless, in practice, it is a substantial challenge to achieve policy consistency across a range of government, Ministries and other institutions [19].
Studies based on individual economic incentives consider profitability as the major determinant of technology adoption and examine the factors that affect the profitability of new technologies. From this point of view, the main determinants of innovation adoption are information barriers, supply-side constraints such as limited availability of credit, and differences in agro-ecological and climatic conditions. This suggests that when adoption is considered as an individual action problem beyond profitability, capturing supply-side constraints and market inefficiencies are important since affordability is crucial in explaining low adoption rates of profitable technologies [20-24]. As a consequence, it is necessary to consider the adoption decision as one that complements individual calculations of profitability with the ability to implement adoption practices successfully. Besides, according to the study done by the type of management and operation of the two forces (environmental and human performance) should be assessed. They stated that the strategies should be in such a way that at least minimizes the pressure arising from human performance and try to reduce environmental stresses as much as possible [25].
Good practice for SLM will enhance the balance across the multiple facets of agro-ecosystem management. However, the complexity and the potential for synergies and trade-offs between aspects of the resource, social and economic base can impede both developments of effective good practice and its adoption. A better understanding of the drivers of land degradation will support efforts to develop good practice for the diverse local conditions of the World’s agro-ecosystems. Principles for SLM include increased water-use efficiency, improved soil fertility, use of good quality plant species adapted to local conditions and creation of favorable growing conditions at the micro-climatic level [26].
Practices that can be developed into locally applicable SLM guidance include: (1) building soil organic matter for better soil moisture storage and nutrient status and improved soil structure; (2) integrated nutrient management with locally appropriate combinations of organic and inorganic sources of nutrients; (3) better crop selection targeting seed quality and locally adapted varieties combined with management for local conditions; (4) high efficiency of use of rainwater to promote infiltration and minimize run-off and erosion in both crop and grazing lands; and (5) management of surface crusting and compaction of soils through maintaining ground cover, reduced tillage and improvements of permeability and hence better seedbed conditions and soil rooting depth. These practices have the potential to make a significant contribution to rehabilitation or restoration of degraded areas.
Bridges to Technology Corp defined technology adoption as a process that begins with awareness of the technology and developments through a sequence of steps that end in suitable and real practice. Therefore, it follows five basic stages: first, awareness-potential users learn about technology and its profits to decide whether they want to investigate further. Second, assessment-possible operators evaluate the usefulness and usability of the technology and the ease or trouble of adopting. Third, approval-potential users decide to gain and use the technology or decide not to adopt. Fourth, learning-users advance the skills and knowledge required to use the technology effectively. And fifth, usage-users prove appropriate and effective use of the technology. Henceforth, for the entire technology adoption, the five processes are essential to passing through [27].
Farmer’s decision to adopt agricultural technologies can be described by factors that impact the expected benefits of the technology. Such factors can be generally grouped into four major groups: technology characteristics, farmers’ characteristics, farmers’ resources and policy and institutional environment [28]. Some of the variables which represent the above factors include land tenure, agricultural extension and credit programs, household endowments of physical and human capital, and presence of public projects and institutional support. In conclusion, these factors are mostly area specific and their importance is varied between and within agro-ecological zones and across countries. Hence, care should be taken in endeavoring to generalize such individual limitations across regions and countries. Important barriers for smallholder land managers could also include poverty, lack of knowledge or confidence to make a change, and labor constraints needed to implement a change of practice. Monitoring the effectiveness of SLM programs is also complex for two reasons: the need to consider cross-scale aspects, and the huge diversity in natural and human factors that affect capacity to adopt good practice and the uniformity of response [26]. Moreover, Farmer’s decision to adopt agricultural technologies can be also affected other factors like land redistribution and agricultural labor force. According to Agidew AA, Singh KN the occurrence of frequent land redistribution negatively affects farmers’ participation in watershed management programs in the Teleyayen sub-watershed of Ethiopia. They also stated that the agricultural labour force of a household is statistically negative and significant at the 5% level of confidence. This means as the number of the agricultural labour force of a household increases, the farmer’s decision to participate in watershed management programs decreases [29].
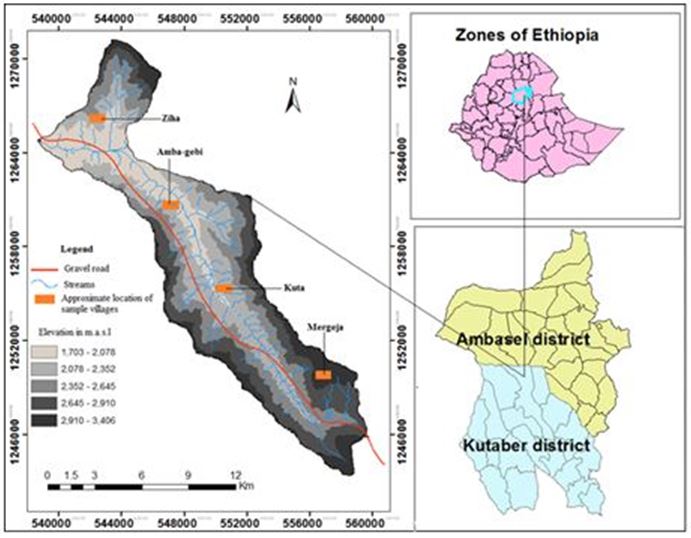
The study was carried out in the Teleyayen sub-watershed, which is situated in the South Wollo Zone of Amhara National Regional State, Ethiopia. It is located between 11014’30’’N and 11029’30’’N latitudes and 39021’0’’E and 39033’0’’E longitudes. The watershed occupies an area of 152 km2 and is inhabited by 20,296 people distributed within the watershed. Its total population is derived from the total area and total population of the two districts [30]. The watershed is about 441 km North of Addis Ababa (the capital city) and characterized by diverse topographic conditions that form part of the headstream of the Abay (Blue Nile) basin. Its elevation range from 1,703 to 3,406 meters above sea level (Figure 1).
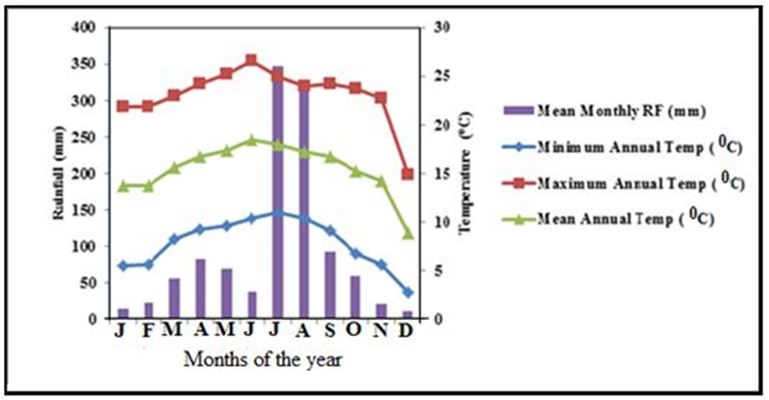
The mean annual temperature of the study area (1995-2015) is about 16 °C and the average annual total rainfall is 1,133 mm ( Figure 2). More than 58% of the total rain falls in the two months of July and August (summer season); while 18% falls in the spring season (March, April, and May); and less than 5% of the total occurs during the dry months of December, January, and February (winter season). The uneven distribution of the rainfall gives rise to a serious shortage of water during the dry season particularly in the lower parts of the watershed. The meteorological data used for this study was obtained from Kombolcha Meteorological Station recorded for Dessie site.
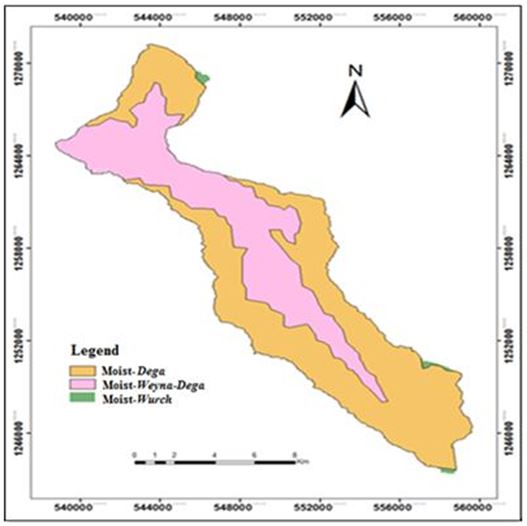
The rural households in the Teleyayen sub-watershed carry out mixed agricultural activities where crop production and livestock rearing are simultaneously practised. Land and livestock are, therefore, the most important assets of the people, allowing them to lead a settled life. Livestock provides the draught power and household members the labour, needed for farming. The land is a scarce resource in the area due to high population pressure and land degradation. Most of the agricultural production is used for the farm household’s own consumption. Farming is carried out using rain-fed systems, but a small-scale irrigation activity has been started recently by some farmers whose farmlands are along the shore of the Rivers. They produce vegetables and fruits. Major crops grown in the watershed include tef (Eragrostis tef), wheat (Triticum vulgare), barley (Hordeum vulgaris), oats (Avena sativa), horse beans (Vicia faba), peas (Pisum sativum), potato (Solanum tuberosum), maize (Zea mays), sorghum (Sorghum spp.), pepper (Piper nigrum) and onion (Allium cepa). Spring rains are used for growing Triticum vulgare, Hordeum vulgaris and pulses between January and April. Also, some villages in the Moist-Dega (Highland) areas take advantage of winter rains to cultivate Eragrostis tef. Spring rains are also important for farmers in the Weyna-Dega (Midland) areas for growing long maturing varieties of Eragrostis tef, Sorghum spp., and Zea mays. Crop production is, therefore, the major source of income to the households. Incomes from off-farm employment include petty trading, charcoal selling and firewood selling, weaving and pottery. The livestock types include cattle, sheep, goats, pack animals and poultry. The average landholding size per family is 0.5 ha on which mixed crop production and livestock rearing are practised [31]. According to the traditional climatic zones of Ethiopia, the Teleyayen sub-watershed stretches over the upper-highland (Moist-Wurch), highland (Moist-Dega) and Midland (Moist-Weyna-Dega) agro-ecological zones sharing 1%, 62% and 37% respectively ( Figure 3).
Data for this study were collected a through household survey questionnaire, FGDs, field observations and key informant interviews. Moreover, secondary data were also gathered from past studies, reports, books, journals and internet sources. The household survey questionnaire was conducted to gather data about demographic and socioeconomic characteristics of the sample households, institutional services, biophysical characteristics, plot level characteristics, and various SLM practices conducted by farmers of the study area. The questions were both closed-ended and open-ended types. Accordingly, the survey questionnaire was administered between January and February 2016.
The sample farm household heads were drawn through a multi-stage sampling technique. The sampling technique involves three stages. In the first stage, the names of eight Kebeles (six from Kutaber and two from Ambasel district), were obtained from each respective Kebele administrators and then four sample Kebeles (three from Kutaber and one from Ambasel district) were selected purposively. The reason for the selection of these Kebeles is based on their agro-ecological zones and accessibility. In the second stage, four sample villages, one from each sample Kebele, were selected randomly. In the third stage, the numbers of all farm households from each selected sample villages were listed. Finally, 172 male-headed and 43 female-headed, a total of 215 sample farm households were selected randomly from the four sample villages in a proportional-to-size of each agro-climatic zone. These sample farm households were determined using the following formula provided by Yamane cited in Israel GD [32].
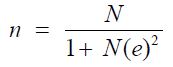
Where, n is the sample size
N is the population size
e is the level of precision (5%).
Based on the above formula, the total sample households were calculated as follow:
n = 465/1+465*0.0025 = 215
The analytical methods used in this study include descriptive statistics like standard deviation, frequency, mean and percentage; and inferential statistics like logistic regression. The analysis explains the associations among the dependent and independent variables considered in the study. It also explains the key adoption factors of SLM practices.
Statistical summary for discrete variables of the study: The statistical analysis of this study showed that only 1 out of 6 discrete variables included in the analysis, was found to be significant in explaining variations in farmers’ SLM practices adoption decision between adopters and non-adopters (Table 1). This variable is land redistribution, which is one of the key resources of rural households. The chi-square analysis indicated that there is a significant correlation between land redistribution and farmers’ decision to adopt SLM practices and it is significant at the 1% level of significance. This could prove that land redistribution allows landless farmers to get farmland and motivate them to adopt SLM practices. The statistical analysis of this variable revealed that 54% of adopters and 92% of non-adopters believed that land redistribution could motivate farmers to adopt SLM practices, while 46% of adopters and 8% of non-adopters do not believe in the role of land redistribution for motivating farmers to adopt SLM practices.
Factors Affecting the Adoption of SLM Practices: The Binary Logistic Regression Model In order to know the correlation between the dependent and independent variables of the study, 14 explanatory variables were selected and hypothesized on the basis of a critical review of the literature from others’ work. Owning small landholdings and being worried about possible opposing economic impact of land degradation, farmers in the study area have adopted several land management practices such as structural measures: terrace construction, construction of waterways, gully control, check dams and water-harvesting; biological measures: alley cropping, establishing shrubs and trees in gullies, crop rotation, and mulching; fertility management: compost production, use of green manure, use of chemical fertilizer, and cultivating legume crops (Figure 4). Nevertheless, there are factors affecting their decisions to adopt land management practices. On the contrary, some farmers do not adopt such land management practices.
The binary logistic regression model was used to explore factors affecting the adoption of SLM practices. The model is specified as follows:
Where,
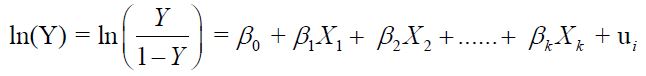
Y = The predicted probability of the event (Sustainable land management) which is coded with 1= adopter of SLM; and 0 = non-adopter of SLM,
1 - Y = The predicted probability of the other decision (non-adopter of SLM)
β0 = Constant
βk = Coefficients of explanatory variables
Xk = Predictor variables
Ui = Error Term
The definition and unit of measurements of variables used in the logistic regression model are presented in Table 2.
Long-term agricultural productivity requires the adoption of appropriate SLM practices. In this study, eight SLM practices were considered to identify farmer’s decision to adopt such practices. In this regard, only (11.2%) of the total households were non-adopters, while a majority of the total sample households (88.8%) were adopters of SLM practices. The results in Table 3 showed that a majority (34.4%) of the respondents adopted terrace construction type of SLM practices followed by water-harvesting (27%), and using compost (10.7%), whereas just (11.2%) of the respondents do not adopt any kind of land management practices (non-adopters) (Table 3). This may be due to strangeness with the benefits of the practices and cost constraints.
The adoption of SLM practices in this study refers to the use of one or more of the SLM practices in a given farm plot. The response variable is SLM adopters coded 1 versus non-adopters coded 0. The predictor variables which were assumed to be potential factors affecting farmers adoption of SLM practices include contact with extension workers per year, training received by household head per year, livestock ownership, slope of the farmland, off-farm income per year, farm plot distances from farmhouse, access to credits, total farm size in hectare, land tenure security, agricultural labor force, crop yield, household size, age of the household head, population pressure, and household head education level. A household is categorized as an adopter, if it uses (adopts) one or more of the eight indigenous and/or introduced SLM practices: water-harvesting, terrace construction, check-dam construction, fallowing, application of chemical fertilizers, agroforestry, using compost, and gully control, while a household is categorized as a non-adopter, if it does not use any of these practices. The adoption of such practices in a farm plot was measured as a binary dummy variable (1= adopted SLM in a farm plot, 0 = otherwise). The key informant interview results showed that lack of good governance, shortage of farmland, shortage of labor, financial constraints, lack of awareness and negative perception towards technology are the main reasons for farmers not to adopt the practices. Among these reasons, they seriously expressed their concern about lack of good governance. According to them, if a farmer does not participate voluntarily, for example, in the natural resource development programs, he/she could be punished in monetary form. If he/she failed to comply with such a decision, he/she also will be accused and cast out by the community and then no one can cooperate with him/her during difficult times. The cast out strategy includes prohibiting from membership of locally established social services like Qire1 and Jigi2 .
Qire is a local association established by a group of people living together for the purpose of helping each other.
Jigi is a labor organization whereby farmers work together on an individual’s agricultural activity turn by
turn for the sake of helping each other.
A number of variables were hypothesized to determine the farmers’ decisions to use a particular choice of land management practice. Results of the binary logistic regression analysis revealed that the adoption of SLM practices is influenced by several variables. The variables found to have a positive and significant influence include land tenure security, the age of the household head, and relief support/food aid, while livestock ownership, perceptions of technology profitability, method of land acquisition, farming experience, productive safety net program and policy support are the variables with significant negative influences. The variable farmer’s perception towards the profitability of SLM practices adoption was the most highly significant of all the explanatory variables. This is so because without having a good perception of the profitability of the technology to be adopted, farmers could not adopt it. The binary logistic regression model estimation also shows that slope of the farmland, off-farm income, gender of the household head, agricultural labor force, and agro-ecological zone showed no significant influence on farmer’s decisions to adopt SLM practices. Of these variables, the size of the agricultural labor force of a household was assumed to have a positive relationship with the adoption of SLM practices. That is, the greater the size of the agricultural labor force, the greater the household’s interest in adopting the practices because it can minimize the labor constraints needed for the implementation of the adopted practices. As we expected, the analysis of binary logistic regression showed the agricultural labor force has a positive predictive power in explaining factors affecting the adoption of SLM practices but the result is statistically insignificant. Off-farm income is also one of such variables, which signifies an insignificant influence on farmers’ decisions to adopt SLM practices. In this study, we defined off-farm earnings as income generated by households from any non-agricultural income-generating enterprises, such as handcraft activities, metalwork, firewood selling, charcoal selling, petty trading, etc. Only 18% of the sample households reported that income that they received from off-farm enabled them to adopt SLM practices, and the remaining 82% reported that it did not enable them. Off-farm income was assumed to have a positive relationship with farmers’ decision to adopt SLM practices. The assumption was that, as off-farm income increases, more of the farmlands will be conserved with the application of SLM practices. Contrary to our expectations, the analysis of binary logistic regression showed off-farm income has a negative predictive power in explaining factors affecting the adoption of SLM practices and the result is statistically insignificant. The negative effect of off-farm income suggests that temporary and seasonal income obtained from the off-farm activities fascinate farmers more than engaging in SLM practices. This result is supported by a study done by McNally S, who stated that pursuit of off-farm income by farmers may weaken their adoption of modern technologies by decreasing the amount of household labor allocated to farming enterprises [33]. The description of variables that have significant effects on farmers’ decisions to adopt SLM practices is presented as follow (Table 4).
The statistical analysis of this study showed that the mean TLU of non-adopters is slightly larger (3.9) than the adopters (3.4). Therefore, the non-adopters owned more livestock (3.9 TLU) than the adopters (3.4 TLU). Contrary to our hypothesis, livestock ownership in TLU was found to be negatively significant at the 10% level of confidence. The negative association could be explained by the fact that having a large quantity of livestock discourages farmers from adopting SLM practices because the return they can get from livestock may be better than that from farming. Moreover, they may prefer to use dung for fertilizer and firewood instead of adopting SLM practices. This result is in line with the study conducted by Amsalu A [34]. He revealed that the influence of livestock size on stone terrace adoption was significantly negative. In contrast, a study carried out by Saguye TS in Jeldu district, West Shewa Zone of Ethiopia indicated a positive relationship between the quantity of livestock owned and the adoption of SLM practices [35].
Contrary to our hypothesis, the binary logistic regression model result of this variable was found to be statistically positive and significant at the 5% level of significance. This means when farmers land tenure security increases, their interest in adopting SLM practices increases. This could be attributed to the recently implemented land certification program, which gives farmers a sense of belongingness to the farmland that they owned. This result is in agreement with the study done by Saguye TS who stated that land tenure is found to be significant and to positively affect the adoption of SLM practices [35]. On the contrary, the result of this study is inconsistent with the study conducted by Ding C. He stated that traditional land tenure systems in Africa negatively impact their adoption. Agro-technologies that require heavy initial capital and long-term or permanent land development can hardly be adopted in settings dominated by communal or inherited land tenure systems [36].
In this study, the mean age of the total sample households was 43.75 years, while it was 43.9 and 43.6 years for adopters and non-adopters respectively. Hence, on average, the adopters were relatively older than the non-adopters. Corresponding to our expectations, the result of the binary logistic regression analysis for this variable was found to be statistically positive and significant at the 5% level of confidence. This means as the age of the household head increases their decisions to adopt SLM practices increases (older farmers are more likely to adopt SLM practices). This could be explained by the fact that older farmers have sufficient experience in farming when compared with younger farmers and so becomes more interested in adopting the practices. This result is consistent with the study done in Ethiopia by Amsalu A. He found that the age of a farmer has a positive and significant influence on the adoption of land management practices. However, there is conflicting evidence on the association between age of the household head and the adoption of SLM practices [34]. The findings of some researchers revealed no significant association between the age of the household head and adoption rates of changed land management practices [37]. To further confound the matter, these authors found an inverse correlation between age and adoption rates, indicating that the age group most likely to identify the stage of life as a constraint was those under 30 due to emerging family promises, savings and debt.
In this study, sample households were asked to express their view on the perception of the productivity of SLM practices. Hence, 86% of the respondents responded that they have a positive perception, while 14% replied that they have no positive perception. Contrary to our expectations, the result of the regression analysis for this variable was found to be negatively significant at 1%. It may be due to financial and technical skill constraints that farmers refrain from adopting the practices even though they understand its productivity. Tegene B and Bewket W in their study found that in spite of the high level of farmers’ perception of the erosion problem, the level of adoption of conservation structures was very restricted [38,39]. But the result of this study is contrary to the findings of Saguye TS. He stated that farmers’ perception of the effectiveness of SLM measures influences positively households’ decision to invest in introducing land management practices [35].
The analysis of this variable showed that 59.5% of the respondents have acquired their farmland through inheritance from parents, purchase, and land redistribution. The remaining 40.5% acquired through rent and shared it with the family. As we understand from both focus group discussion and interview results, landless youths and some farmers who own less than 1 hectare of farmland need land redistribution because they believe there are some farmers who owned large farm sizes. In the study area, formal land redistribution was conducted in 1991 and 1996. The main reason for the 1991 land redistribution in the area was to give land to returnees from resettlement programs and to ex-service soldiers of the former government. The motive behind the 1996 land redistribution was to take land from the so-called Bureaucrats (who are believed to own larger farmlands than others because of the position they had during the former government) and distribute it to landless farmers. After this, there was no land redistribution; this results in there being many landless farmers. The system of land as government property with the only way of sharing and transferring it being through formal procedures is facing many challenges. For example, some farmers express fear about the ownership of their farmland through land certification is there. About 63% of adopters acquired their farmlands through inheritance, purchase, and land redistribution, while about 67% of non-adopters acquired it through share with the family and rent. Therefore, this implies farmers are more likely to adopt SLM practices on land they own through inheritance, purchase and land redistribution compared to the land they rent and share. This result is supported by a study done in Nicaragua by Bandiera O, who found that smallholder farmers are more likely to adopt agroforestry on land they own compared to the land they rent [40]. The binary logistic regression result of this variable shows a negative association with the adoption of SLM practices significant at 5%. This result is consistent with the study done in Sierra Leone by Conteh A, MH Yan, Moiwo JP. They revealed that the mode of acquisition of farmland is negatively associated with grain technology adoption [41].
Based on the result of binary logistic regression analysis farming experience of sample households is statistically found to be significant at 1%. Contrary to the hypothesized situation, it is negatively associated with the adoption of SLM practices. This means as farmers farming experience increases their decision to adopt SLM practices decreases. This result is not consistent with past practical studies such as Afolami A, Obayelu E,Vaughan I, who found years of farming experience significantly and positively influenced the adoption of improved cassava varieties by rural households of Southwestern Nigeria [42].
The binary logistic regression analysis of this study revealed that the PSNP is statistically significant at 5%. Contrary to our hypothesis, it is negatively associated with the adoption of SLM practices. The result of this study is inconsistent with the findings of Gilligan DO, J Hoddinott, Taffesse SA who conducted a study to examine Ethiopia’s PSNP and its connection after one and half a year since the implementation of the program. According to their study, the program had a significant positive impact on participants’ food security, borrowing for productive purposes, use of improved technologies, and creation of non-farm own businesses compared to the control groups when the PSNP was complemented with other food security programs [43].
In this case, food aid includes the two main Ethiopian food aid programs: Food for Work (FFW) and Free Distribution (FD). Farmers were asked about their perception of the importance of assistance given for their SLM practices adoption decisions and implementation of such practices. Accordingly, more than 70% of the total sample households believed in the importance of availability and continuation of assistance in the form of food aid/relief support. Based on the result of the binary logistic regression analysis relief support/food aid is statistically significant at the 10% level of confidence. Contrary to our hypothesis, it is positively associated with the adoption of SLM practices. The positive association could be due to its role in providing a provisional solution for food security problems. The result is consistent with the study done by Barrett CB, M Bezuneh, Aboud, who found that food aid distributed directly or through FFW programs to households in Northern Kenya during the lean season likewise fostered increased purchasing of agricultural inputs such as improved seeds, fertilizer and hired labour, thereby increasing agricultural productivity [44].
The majority of households (74.4%) responded that they receive insignificant policy support on the importance of SLM practices, while (25.6%) of them responded that they received significant policy support. Contrary to our hypothesis, the binary logistic regression model result of this variable was found to be negatively significant at the 5% level of confidence. This implies that policy support given to farmers has a negative association with the adoption of SLM practices. However, a study conducted by Friedrich T, Kassam AH, indicated that the transformation calls for a continued policy and institutional support role that can deliver incentives and the necessary services to farmers to adopt conservation agriculture practices and improve them over time [45]. A study carried out by Okuthe IK, in Southwestern Kenya also showed an extension service is expected to have a positive impact on the adoption of improved cassava production technologies by farmers [46]. The results obtained from FGDs also revealed that a majority of the respondents (61%) did not receive the necessary support from extension workers because some of the extension workers are not interested in their profession, and some of them were not available at the farm plot site mainly because of the transportation problem. This shows that farmers do not get sufficient information on the relevance of adopting SLM practices from extension workers.
This study attempted to identify important factors, which influence the adoption of SLM practices in the Teleyayen sub-watershed. The results showed that major of the factors influencing the adoption of SLM practices in the study area are livestock ownership, farmer’s perception towards the profitability of the practices, age of the household head, land tenure security, method of farmland acquisition, farming experience, PSNP, relief support and policy support. While slope of the farmland, off-farm income, gender of the household head, agricultural labour force and agro-ecological zone variables showed no significant influence. Further, the results indicated that a majority of the households (74.4%) responded that they received insignificant policy support on the importance and profitability of SLM practices, while (25.6%) of them responded that they received significant policy support from concerned government bodies such as from development agent workers. The analysis of the study also revealed that 88.8% and 11.2% were found to be adopters and non-adopters of SLM practice respectively. The key informant interview results also indicated that lack of good governance, shortage of farmland, shortage of labour, financial constraints, lack of awareness and negative perception towards technology are the main reasons for farmers not to adopt SLM practices. Among these reasons, they seriously expressed their concern about a lack of good governance. According to them, if a farmer does not voluntarily participate, for example, during natural resource development programs, he/she could be punished in monetary form. If he/she failed to do that he/she will be also accused and cast out by the community and no one can cooperate with him/her during difficult times. The binary logistic regression model result of the variable policy support was found to be negatively significant at the 5% level of confidence. This implies that policy support given to farmers has a negative association with the adoption of SLM practices. The results obtained from FGDs also revealed that a majority of the respondents (61%) did not receive the necessary support from extension workers because some of them are predominantly engaged in routine political activities instead of performing their professional duty. According to the Regional government structure, one of the extension workers assigned to a Kebele, is a member of the Kebele political administrative bodies. Besides, some of them were not interested in their profession. This shows that farmers do not get sufficient information on the relevance of adopting SLM practices from extension workers. Therefore, it is advisable to build farmers’ capacity through the provision of information and demonstrations, exposing them to technologies which can increase agricultural productivity and in turn, income and well-being. On the other hand, the government should arrange a strategy that could encourage extension workers towards their profession so as to assist farmers properly. The strategy may include the provision of incentives, in-service training, recognition and rewards.
The statistical analysis of this study showed that only one out of six discrete variables included in the analysis was found to be significant in explaining variations of farmers SLM practices adoptions between adopters and non-adopters. This variable is land redistribution, which is one of the key assets of rural households. The chi-square analysis indicated that there is a significant correlation between land redistribution and farmers’ decision to adopt SLM practices and it is significant at the 1% level of confidence. This could prove that land redistribution allows landless farmers to get farmland so that motivates them to adopt SLM practices. The statistical analysis result of this variable revealed that 54% of adopters and 92% of non-adopters believed that land redistribution could motivate farmers to adopt SLM practices, while 46% of adopters and 8% of non-adopters do not believe in the role of land redistribution for motivating farmers to adopt SLM practices.
The authors would like to thank farmers’ and development agent workers who took part in the survey.