Flow Reactor Measurement of PAHs and PM Formed from Low Temperature Benzene Pyrolysis with and without Oxygen
The main component of PM (particulate matter) formed in the combustion field is soot, and its formation mechanism is hydrocarbon fuel pyrolysis, polymerization and partial oxidation. In this experimental research work, formation of PAHs(polycyclic aromatic hydrocarbons) and PM in a benzene-oxygen-nitrogen mixture were studied using a flow reactor. The effects of temperature and oxygen on PAHs and PM formations were investigated by independent control of temperature and oxygen concentration. In order to investigate the growth processes of PAHs, mass concentration fractions (relative mass fraction to initial benzene) of naphthalene, biphenyl, phenanthrene, anthracene, and pyrene were measured.As the result, it was found that mass concentration of biphenyl formed from benzene-N2mixture pyrolysis without oxygen was higher than naphthalene. Under the pyrolysis with oxygen, the mass concentration of naphthalene was higher than biphenyl. Mass concentrations of PAHs had two peaks at 1,190 K and 1,250 K in 2.3 vol% oxygen mixture but had only one peak of 1,190 K in no oxygen mixture. Large fraction of PAHs but small fractions of PM wereformed from benzene-N2 mixture pyrolysis without oxygen and PM concentration increased with addition of oxygen.There was PM formation valley at around 1,280 K. above 1,310 K, greater PM concentrations were measured. The conversion ratio from benzene to PM was over 20%, however this showed no statistical difference in the presence or absence of oxygen.
Keywords: Polycyclic Aromatic Hydrocarbons;Particulate Matter; Soot; Pyrolysis; Benzene; Flow Reactor
The compositions of carbonaceous PM (particulate matter)formed in the combustion field are soot and PAHs (polycyclic aromatic hydrocarbons) that are adhered on solid soot. These substances are formed through various pyrolysis, polymerization, and partial oxidation processes of fuel. Fuel pyrolysis forms lower hydrocarbon radicals with less number of carbon atoms than the fuel. These radicals grow up to first aromatic ring hydrocarbons by polymerization. The first aromatic ring grows up to PAH. Higher ring aromatics such as coronene aggregate with each other to produce more higher/heavier PAH. After then, it becomes soot. Therefore, PAH is considered as a precursor of soot. Then behavior of hydrocarbon radicals and PAHs in a flame has been investigated to find out the detail growth mechanism of PAH to soot. There had been a huge number of reference literatures, for example, Sanchez at al. investigate the PAH formation from acetylene, Mendiara, et al. investigated acetylene pyrolysis, and Ruiz, et al. investigated temperature effect on soot formation [1-3].
PAH formation and its aggregation processes proposed by Frenklach and Wang are well known schemes of the PAH behavior as the precursor of soot nuclei. It was considered that soot nuclei are physically aggregated and become soot particle[4,5]. Laser induced fluorescence (LIF) method is one of the powerful tools for non-intrusive measurement of PAH in a flame as introduced in the literatures [6-13]. According to these previous investigations, number of carbon atoms in PAH molecule inside a flame was estimated by LIF spectrum analysis [13]. Moreover, quantitative measurement of PAH concentrations in a diffusion flame was carried out using a gas chromatography (GC) system [14]. As for size and concentration measurements of soot particles, a laser induced incandescence (LII) diagnostics was carried out, and soot growth behavior in a flame was discussed by using LII results[14-16]. These discussions are useful to explain the physical growth process from heavier PAH to soot particle. However starting process of PAH formation is still unclear because it involves many kind of chemical reactions such as pyrolysis and polymerization.
A chemical process of PAH formation was proposed by Frenklach and Wang [17]. The hydrogen abstraction acetylene addition (HACA: H-abstraction C2H2-addition) reaction mechanism was proposed as the main formation route from chain hydrocarbon to aromatic hydrocarbon [18-19]. This mechanism is well known as a reaction route of soot precursor formation. The HACA reaction progresses until aromatic hydrocarbon being formed. After then, formed aromatic hydrocarbon grows up to PAH by additional HACA reactions. For the growth of aromatic hydrocarbon to PAH, naphthalene formation process through acetylene addition is known [18-20]. As for the route from benzene to PAH, Frenklach and Wang suggested two possible routes. One is the naphthalene route mentioned above and the other is the biphenyl route based on high temperature pyrolysis of benzene [4,21].Shukla, et al. investigated PAH formation in hydrocarbon pyrolysis and suggested that biphenyl formation process has an important role in PAH growth[22-26]. They proposedphenyl addition cyclization (PAC) mechanism.Tranter, et al. indicated that the reaction between phenyl radicals forms not only biphenyl but also o-benzyne and benzene. Comandini, et al. proposed that the reaction of o-benzyne and benzene produces naphthalene and acetylene[27,28]. Furthermore, phenanthrene formation process through methyl addition cyclization (MAC) wasproposed by B. Shukla, et al. [29].
Several research reports have suggested that the high temperature chemistry of benzene has significant impact on the formation of heavier PAH and soot [16,30]. Kern, et al. investigated pyrolysis of toluene, benzene, butadiene, and acetylene using a shock tube and indicated that large amount of acetylene and diacetylene are formed under the condition higher than 2,000 K [31]. Knorre, et al. investigated soot formation in benzene-acetylene mixture using a shock tube and indicated that soot yields at temperature higher than 2,000 K in benzene-acetylene mixture of 1:1 ratio[32]. Hou, et al. and Shukla, et al. investigated pyrolysis of benzene using a flow reactor and suggested that biphenyl is a dominant product in the formation process of heavy PAH under temperature conditions lower than 1,300 K[23,33]. From the results of benzene pyrolysis using shock tube, Sivaramakrishnan, et al. and Bohm, et al. suggested that the dominant products in the formation process of PAH are different between high and low temperature conditions[34,35]. High temperature oxidation of benzene has been investigated in many literatures, whereas low temperature pyrolysis and oxidation of benzene has been slightly investigated[36-38].
In soot formation studies on near-sooting premixed flame of benzene-oxygen mixture, existences of C6H6O and C5H6 in large mole fractions are confirmed. Itsuggested that O-atom attack might be the main route of benzene consumption [39].Frenklach, et al. investigated soot formation in benzene-oxygen mixture using a shock tube and indicated that soot formation is suppressed by the existence of oxygen [40]. In the soot formation studies of laminar diffusion flame using propane, hexane, and benzene, it was suggested that temperature has influence on growth process from PAH to soot. It was suggested that oxygen has influence on the formation amount of soot [14,41].
Wang, et al. , Frenklach, et al. and Leusden, et al. reported that oxygen suppresses soot formation from toluene and acetylene[40,42,43]. They indicated thatoxygen suppresses or promotes the formation of soot, but it depends on experimental conditions. Soot formation by oxygen is also promoted under lower pressure and lower temperature conditions [40]. It is considered that dominant products in the formation process of soot is changed by a level of oxygen concentration and is also changed by high and low temperature conditions. Then to clarify the formation process of soot, it is necessary to investigate the critical temperature at which soot suppression process changes to soot promotion process. As for the transition from PAHs to soot, Kobayasi, et al. investigated the transition temperature using LIH and LII methods [14,44]. Kobayasi, et al. pointed out that the transition took place at around 1,300 K temperature and a few percent of oxygenconditions in a diffusion flame. However, there are no detail researches under the temperature condition lower than 1,300 K. Also the oxygen effect on PM formation under low temperature conditions is not clear.
As for soot formation process from benzene-air mixture, it is considered that benzene has two functions for soot formation. First function is the source of reaction species. Hydrocarbon radicals and acetylene are formed by benzene pyrolysis, and PAH is formed by the progress of HACA mechanism. The second is that benzene becomes a nucleus molecule of PAHby itself. It is considered that these functions of benzene have diffluent characteristics of influence on PAH and soot formation.
In order to investigate the effects of temperature and oxygen on PAH formation in a flame, it is necessary to separate these two effects. For separation of these effects, temperature and oxygen have to be controlled separately in a flame. However, independent control of temperature and oxygen concentration in the flame is usually difficult. On the other hand, when a flow reactor is used for soot formation study, it can control the temperature independently from oxygen concentration.
Purpose of study was to clarify the temperature and oxygen effect on benzene pyrolysis, especially in low temperature condition. In this experimental research, formation processes of PAHs and PM in a benzene-oxygen mixture were studied using a flow reactor[45,46]. Effects of temperature and oxygen on PAHs and PM formation were investigated by independent control of temperature and oxygen concentration. To analyze the growth process of the first aromatic ring to PAHs, mass concentration of naphthalene, biphenyl, phenanthrene, anthracene, and pyrene were measured. To separate soot from PAHs, various temperature heating treatments were performed on the PM captured by filter. Further relationship between PAHs and soot was discussed under various oxygen concentration and temperature conditions.
Experimental setup for benzene pyrolysis and oxidation is shown in Figure 1. This setup consists of a fuel supply system and a flow reactor with heating furnace. Liquid benzene was regulated by a micro tube pump, and was supplied to a heated evaporation tank. N2 and air mixed with vaporized benzene in the tank. Here benzene flow rate was 0.14 g/min and total flow rate of the mixture was 2.2 L/min as the standard experimental condition. It corresponded 1.9 vol% of benzene mixture. Oxygen concentration was varied by changing the ratio of N2 and air.
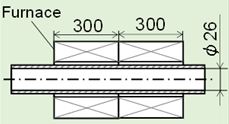
A quartz tube of 26 mm inner diameter and 2,720 mm length was used as a flow reactor. Heating zone length of the furnace located in the middle part of the reactor was 600 mm. Pyrolysis and oxidation was progressed in this heating zone. Points A and B were the sampling points of the mixture before reaction. Points C and D were for the mixture after reaction. When a flow reactor with small inner diameter was used, a plug flow was easily maintained but PAH and PM might adhere to the wall surface. Therefore, in this study, a flow reactor with large inner diameter was used to suppress the adhesion of PAH and PM. A flow reactor with large inner diameter had another problem that a reverse flow to the upstream was induced under a low velocity condition. The reverse flow to the upstream had influence on the reaction of the mixture. Therefore, in the flow reactor of this study, partition plates with a hole of 8.5 mm were set near the sampling points. As a result, the flow velocity locally increased at the partition plate, and it could prevent the reverse flow of the mixture to the upstream. Temperature of mixture in the reactor was measured by thermocouple. Several thermocouples were inserted through the quartz tube joints.
The mixture temperature along the center line of the flow reactor was measured. Typical temperature distributions in the reactor are shown in Figure 2. The temperature of mixture was kept at around 400 K before the heating zone. This temperature level was chosen to prevent the wall condensation of benzene vapor. The test mixture was heated up to regulated temperature in the heating zone. After passing the heating zone, it was naturally cooled down. It was further cooled down to the room temperature at point D. The regulated furnace temperatures Tf are 1,073 K, 1,273 K, and 1,338 K. Since the maximum temperature of the mixture in the heating zone corresponded with the regulated furnace temperature, hereafter, this furnace temperature was used as a representative temperature of the mixture in the heating zone. Endothermic and exothermic reactions in a fuel-oxygen mixture might result a change of the mixture temperature. However, even though oxidation of fuel-oxygen mixture was taken place, the temperature change in the heating zone due to the exothermic reactions was less than 10 K in the experimental conditions of this paper.
Laboratory scale flow reactor has many advantages for reaction analysis, but quantitative analysis of reactive species depends on the residence time in the reactor. Mándity, et al. pointed out the importance of long residence time and the necessity of fine turning of it for complete reaction [47]. Al Mesfer et al. reported the residence time influence on reaction degree in a flow reactor [48]. Mitroo, et al. proposed the method that can estimate the final reaction state by using short residence time result [49].
Since pyrolysis and oxidation reactions of benzene were progressed in the heating zone, it was considered that the residence time in the heating zone had substantial influence on the progress of these reactions. Especially shot residence time experiment under low temperature condition has a possibility to give us the risky data of reaction completeness. In this study, then, long residence time was preferable for pyrolysis investigation, especially, under low temperature conditions. Conditions of flow rate, flow speed, and residence time in the heating zone are summarized in Table 1. It shows the longest residence time condition of this study. In the flow reactor, the residence time in the heating zone was varied by the change of furnace temperature under the condition of constant flow rate. For example, at the flow rate of 2.2 L/min, the residence time could be reduced from 2.4 to 1.9 seconds by increasing the furnace temperature. Shorter residence time than this table was easily attained by increasing the flow rates but more longer one was hard because of less stability of the experimental setup for benzene feeding and reactor flow.
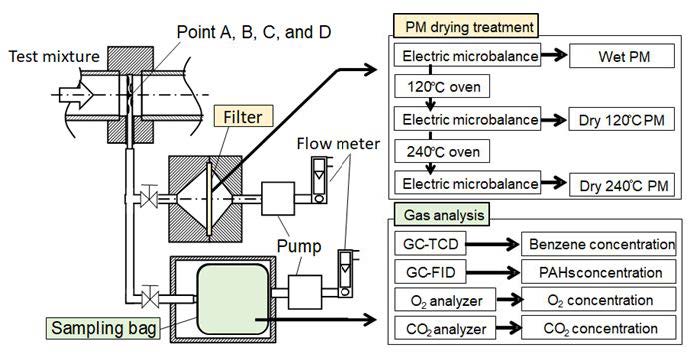
For gas composition and PM analysis, the mixture gas was sampled at points A, B, C, and D along the reactor. Figure 3 shows the schematic diagram of gaseous compositions and PM sampling, and analyzing methods of PAH and PM. A sampling probe was inserted, and the mixture in the reactor was introduced into the sampling bag by a suction pump. PAHs in the mixture were analyzed by Gas Chromatography (detector: TCD and FID). The column of GC-TCD was a Packed Column (length: 2 m, inner diameter: 3.2 mm). Injection volume was 100 μL, and splitless injection was adopted. The column of GC-FID for benzene was a Capillary Column (length: 60 m, inner diameter: 0.25 mm) and volume of splitless injection was 300 μL. O2 and CO2 in the mixture were measured by O2 analyzer (magnetic wind type) and CO2 analyzer (NDIR), respectively. In this study, mass concentrations of PAH and PM were normalized by initial benzene concentration.
As for the PM sampling, the same sampling probe was used. PM was captured by a quartz fiber filter. The sampled mass of PM was directly measured by an electronic microbalance as the first step. Its mass was called “Wet PM”. Since “Wet PM” contained fuel benzene (boiling point: 80.1 °C) and moisture (oxygen exist condition), these were removed by an oven under 120 °C and 150 minutes drying. Benzene and moisture removed PM was measured as the next step, and its mass was called “Dry 120 oC PM”. After then, “Dry 120 °C PM” was re-dried up under 240 °C and 60 minutes to remove low boiling-point volatile compositions. The PM mass after the second dry-up was re-measured, and it was called “Dry 240 °C PM”.
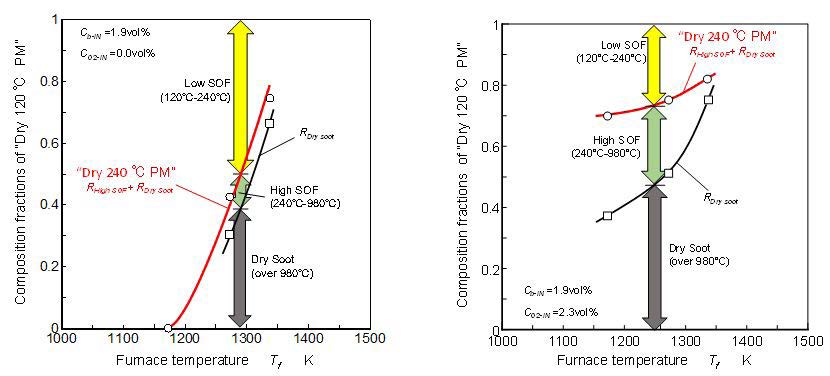
Composition fractions of “Dry 240 °C PM” and dry soot in “Dry 120 °C PM” are shown in Figure 4. Using a combustion type PM analyzer (HORIBA MEXA-1370PM), soot composition in “Dry 240 °C PM” was analyzed. Then the composition of “Dry 120 °C PM” was separated into low SOF, high SOF and dry soot. Low SOF fraction meant the compositions that were remained after 120 °C heating treatment but removed by 240 °C heating treatment. High SOF fraction meant the compositions that were not removed by 240 °C heating treatment. Through a pre-examination of the treatment procedure, it was confirmed that three-ring aromatics and other lower aromatics (low boiling point and high volatility) were completely removed by 240 °C and 60 minutes treatment. Then these species were considered as low SOF in “Dry 120 °C PM”. Most of four-ring aromatics like pyrene (404 °C) were remained in 120 °C treatment but some of them were also remained after 240 °C and 60 minutes treatment. In this heating treatment, since the heating temperature was lower than the boiling temperatures of heavier PAHs, some of them were remained after the long time heating. Then PAHs having higher boiling points than pyrene were considered as high SOF in “Dry 240 °C PM”.
According the PM analyzer, dry soot meant the soot composition that was stable under 980 °C non oxygen heating. As shown Figure 4(a), “Dry 120 °C PM” formed by pure benzene pyrolysis contained much of low SOF and less of high SOF. It meant that “Dry 240 °C PM” formed from benzene pyrolysis was almost dry soot. On the other hand, as shown in Figure 4(b), “Dry 240 °C PM” formed by benzene pyrolysis under oxygen exist condition contained much of high SOF. It was caused by the partial oxidation effect of the oxygen.
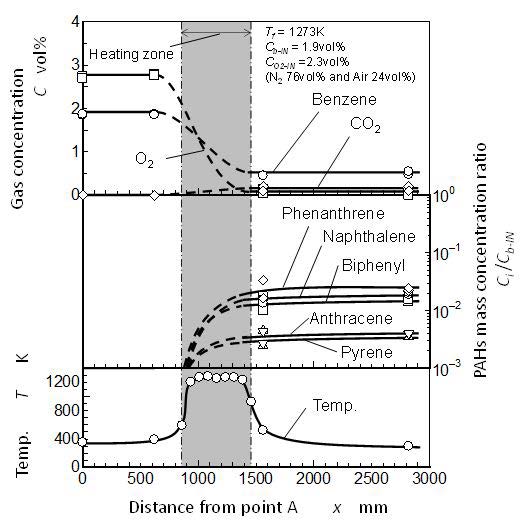
Overall reaction behavior along the reactor is shown in Figure 5. The test conditions were a benzene concentration of Cb-IN = 1.9 vol%, an oxygen concentration of CO2-IN = 2.3 vol%, and a furnace temperature of Tf = 1,273 K. The residence time in the heating zone was 2.0 seconds. Upper part of the figure shows concentrations of benzene, oxygen, and carbon dioxide. The middle part shows the formation mass concentrations of PAHs, and the lower part shows the temperature along the reactor.
The benzene concentration decreased in the heating zone. With benzene concentration decrease, oxygen also decreased in the heating zone. Carbon dioxide did not exist in the upstream of the heating zone, whereas, it appeared at point C. This is due to the final oxidation reaction of benzene. PAHs were detected at point C. Since PAHs were not detected at point B, it was considered that PAHs are formed between points B and C. In other words, PAHs were formed in the heating zone.
There were no differences of gas concentrations and PAHs between points C and D. All the reactions including PAH formation might be stopped/quenched by the low temperature effect in the process from point C to D, or, all reactions might be ceased by achieving to the near final equilibrium state.
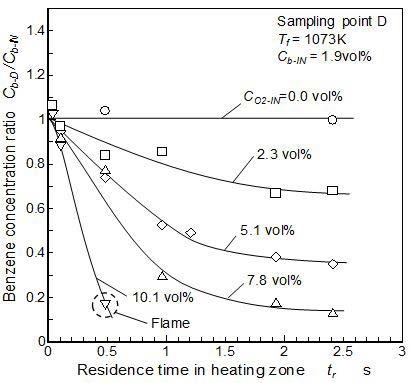
Residence time effect on the final benzene concentration measured at point D is shown in Figure 6. The furnace temperature was 1,073 K. Here, the final benzene concentration measured at point D (Cb-D) was normalized by the supplied benzene concentration (Cb-IN). No concentration change was observed in the benzene mixture under zero O2 concentration (benzene-N2 mixture). No benzene pyrolysis was induced in low temperature conditions such as 1,073 K. On the other hand, the final concentration of benzene decreased under a certain concentration of O2. The final benzene concentration decreased with the residence time increase until 1.9 seconds. When the residence time increased beyond 1.9 seconds and more, additional decrease of the benzene concentration was slight.
When the residence time was sufficiently long, the mixture become the new equilibrium state after pyrolysis and oxidation. When the residence time was shorter than 1.9 seconds, the benzene reduction might be stopped in the midway of the reactions by the cooling effect during the process from point C to D. Furnace temperature increase resulted shorter residence time as shown in Table 1. However reaction speed promotion by temperature increase was generally expected to cancel the effect of residence time shorting effect. Then the residence time conditions used here was considered to be enough to give us the reliable results for discussion.
The condition of 10.1 vol% O2 is the special case. Visible flame was observed in the heating zone because of high oxygen condition near stoichiometry (oxygen based equivalence ratio: ϕ = 1.4). Further, temperature control in this condition became impossible for strong exothermic reaction. Since visible flame was established, strong oxidation becomes the dominant parameter of benzene reaction, but it was out of this research work. The conditions of 7.8 vol% and 5.1 vol% O2 also had the possibility of an invisible flame existing in the heating zone. However, under these conditions, there was almost no temperature change due to exothermic reactions in the heating zone, and the temperature could be controlled. Therefore, there is no influence of unexpected temperature raise on the products.
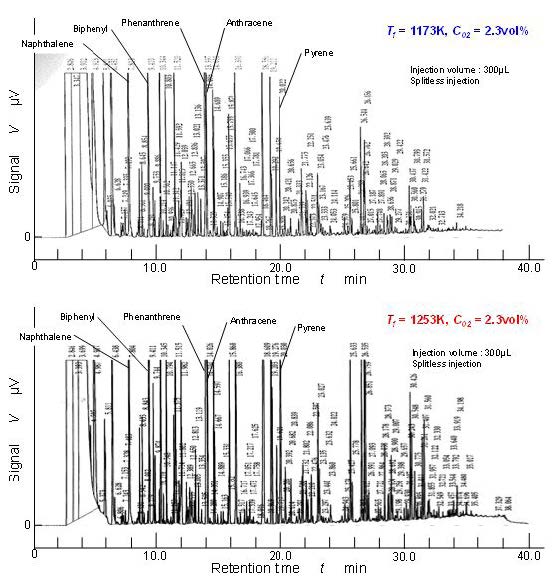
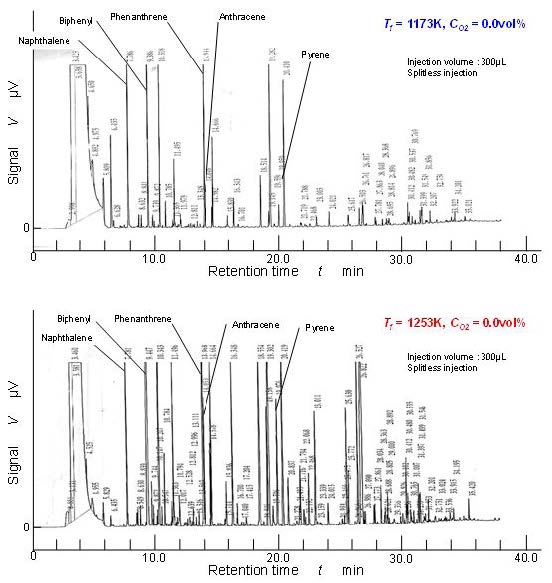
There were many aromatic hydrocarbons detected by GC-FID. Figure 7 shows the raw examples of GC-FID chart obtained by the mixture sampled at point D. It shows the pure pyrolysis results of benzene with enough residence time (longer than 1.9 seconds). Upper chart shows the pyrolysis result of 1,173 K temperature furnace and the lower one is the result of 1,253 K. Naphthalene, biphenyl, phenanthrene, anthracene, pyrene, and other PAH substances were clearly detected. There were two clear differences between these two charts. One is number of peaks corresponding to the high concentration PAHs. High concentration peaks detected in 1,253 K pyrolysis were larger in number than in 1,173 K pyrolysis. The other was heavier PAHs corresponding to longer retention time than pyrene were detected in 1,253 K pyrolysis. Using these GC-FID results, temperature effect of typical two-, three-, and four-ring aromatics were discussed.
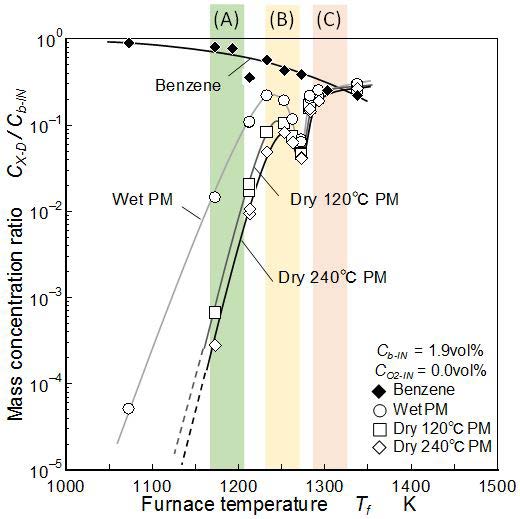
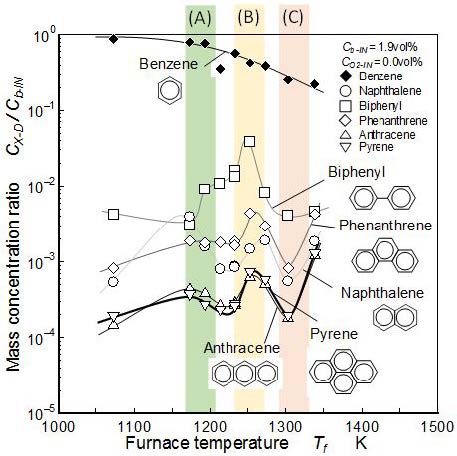
Mass concentration of naphthalene, biphenyl, phenanthrene, anthracene, and pyrene detected at point D were summarized in Figure 8. It shows the pure pyrolysis with zero O2 concentration. Concentration of each PAH was normalized by supplied mass concentration of benzene and expressed by logarithmic scale. Here, main discussions of the result are concentrated into three typical temperature zones indicated by three color zones of (A), (B), and (C). The temperature ranges of these zones are (A): 1,190±20 K, (B): 1,250±20 K, and (C): 1,310±20 K.
The mass concentration of benzene decreased monotonously with an increase of temperature. It showed that benzene pyrolysis was induced in higher temperature conditions than 1,073 K (Figure 6). Then zone (A) is considered as the critical light-off temperature zone of benzene pyrolysis. In all temperature conditions of the experiment, the mass concentration of biphenyl formed by benzene pyrolysis was higher than the other PAHs shown here. Maximum mass conversion ratio from benzene to biphenyl was 4% of benzene and it was one order higher than other PAHs. From the results of the mass concentrations of phenanthrene and pyrene, it was concluded that the PAH mass concentration decreased with an increase of aromatic ring number. However, phenanthrene (three-ring PAH) showed higher concentration than naphthalene (two-ring PAH).
The mass concentration of biphenyl was higher than naphthalene. It highest value was 4% (zone (B)) of initial benzene and was not negligible order of remained benzene of 50%. According to the GC-FID chart, there were many PAHs detected. For example, many other two-ring PAH species which showed almost same concentration levels but were not defined, were detected. Concentration of total two-ring aromatic species was estimated to be one order higher level than that of biphenyl, especially at high temperature condition (Figure7). In three-ring PAHs, the mass concentration of phenanthrene was higher than anthracene. Biphenyl is formed by bonding reaction of phenyl radicals (PAC process) and grows up to phenanthrene by acetylene addition. Pyrene behavior shown in the figure was similar with anthracene. It meant that three-ring and four-ring PAHs contributed almost same way in the PM formation process.
The mass concentrations of biphenyl and phenanthrene significantly increased in zone (B) and had clear peaks. The mass concentrations of naphthalene, anthracene, and pyrene showed different manner with biphenyl and phenanthrene. They had clear peaks in zones (A) and (B). However their peak values were less than 1% of the initial benzene. At lower temperatures, the aromatic-ring-rupture of the fuel benzene does not occur and could remain intact. Therefore, phenyl radicals are considered to be the main source of ring growth reaction under such conditions [23,33-35]. At moderately high temperatures (zone (C)), the rupture of the aromatic ring occurs, leading to a lower concentration of benzene and phenyl radical (not shown here), and a decrease in PAH formation. At higher temperatures (over zone(C)) the concentration of the aromatic-ring-rupture products C2H2 and C4H2 is likely to be substantial, and it might be increased the formation of PAH [31,32].
PAH behavior obtained in Figure 8 was well corresponded with the two- and three-ring PAH formation process proposed by Frenklach and Wang [4,21]. Figure 9 shows their proposed schemes. Figure 9(a) shows the general HACA process of PAH formation beyond first ring-aromatics. Figure 9(b) is its growth initiated by aromatic condensation/combination relevant with high temperature pyrolysis of benzene. It is explained previously as the PAC process. Biphenyl and phenanthrene behavior in zone (B) meant that the process (b) is the dominant process of the benzene pure pyrolysis with no oxygen condition. It was also confirmed by the result that naphthalene concentration as the intermittent species in (a) process was lower than biphenyl.
Mass concentrations of “Wet PM”, “Dry 120 °C PM”, and “Dry 240 °C PM” detected at point D are shown in Figure 10 to discuss the relationship with PAHs. It shows that more than 0.1 % of “Dry 120 °C PM” and “Dry 240 °C PM” were detected when the furnace temperature was higher than zone (A) temperature. The temperature of zone (A) is a critical light-off temperature of not only benzene pyrolysis but also PM formation.
The mass concentration of “Wet PM” increased with the temperature and once took a peak in zone (B). “Dry 120 °C PM” behavior indicated similar tendency as “Wet PM”. It took a peak in zone (B). The absolute mass of PM was reduced by the dry-up treatment. The reduction ratio from “Wet PM” to “Dry 120 °C PM” was observed clearly under low temperature conditions and mass concentration of “Dry 120 °C PM” is one order less than “Wet PM”. It meant that much of fuel benzene was contained in “Wet PM” at lower temperature conditions than zone (B). In high temperature condition indicated by zone (C), there were no obvious difference between “Wet PM” and “Dry 120 °C PM”. Further concentration of “Dry 120 °C PM” in zone (C) was higher than the peak concentration in zone (B).
“Dry 240 °C PM” showed similar temperature dependence as “Dry 120 °C PM”. The difference of “Dry 120 °C PM” and “Dry 240 °C PM” meant the fraction of low SOF as explained in Figure 4. When the furnace temperature increased to zone (C), this difference became small. Therefore, it was considered that the “Dry 120 °C PM” formed in high temperature condition contained only a few low boiling-point volatile compositions (low SOF).
Clear low concentration valleys reported by Kashiwa, et al. existed in a temperature zone (around 1,280 K) between zones (B) and (C) [46]. It suggested that PM formation mechanisms in zones (B) and (C) are different. In zone (B), both of PAHs in Figure 8 and PM in Figure 10 show the peaks and relevant PM formation mechanism form lighter PAHs to PM is strongly indicated. However in zone (C), concentrations of lighter PAHs are not so high but high concentration of PM appears. Its fraction was around 20% of initial benzene.
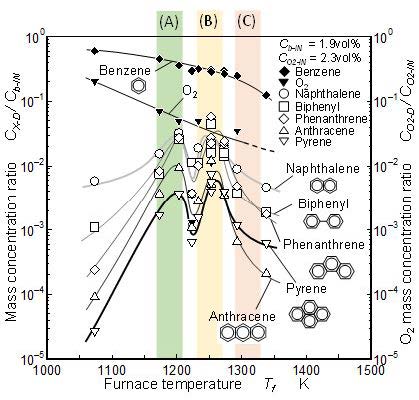
Figure 11 shows GC-FID charts that indicate the pyrolysis and partial oxidation results of benzene with 2.3 vol% oxygen. Upper chart shows the pyrolysis result of 1,173 K temperature furnace and the lower one is the result of 1,253 K. When these charts were compared with Figure 8, it was found that larger number of peaks corresponding to the high concentration PAHs are detected in the charts than the pure pyrolysis charts shown in Figure 8. It meant that additional PAH species are produced by partial oxidation of benzene. Peaks corresponding heavier PAH than pyrene also increased. It suggested the increase of high SOF composition shown in Figure 4(b). In other words, PAHs formed by pure pyrolysis of benzene might be changed by oxygen relevant reactions [45,46].
Benzene decrease and PAHs concentration changes corresponding to various furnace temperatures are shown in Figure 12. For the convenience of comparison, the same temperature zone definitions as Figure 8 and 10 are used. Benzene was consumed under 2.3 vol% O2 condition even though the temperature is lower than the temperature of zone (A). The light-off temperature of benzene reaction shifted to low temperature side due to the oxidation effect [46].
All the PAHs measured here showed two peaks in zones (A) and (B). However in zone (C), concentrations of PAHs showed extremely low levels. Further superior peak of biphenyl existed in zone (B) of pure pyrolysis did not appear under pyrolysis and oxidation of benzene. In 2.3 vol% O2 condition, naphthalene concentration was almost same level as biphenyl. It meant that main two-ring PAH was changed from biphenyl (0 vol% O2) to naphthalene (2.3 vol% O2). Naphthalene and phenanthrene are expected to be formed through acetylene addition process on benzene and biphenyl [19]. PAH behavior in Figure 12 suggested that the biphenyl route shown in Figure 9(b) is not the dominant route of the PAH formation, or suggested that biphenyl-to-phenanthrene conversion by acetylene addition is promoted. Clear low concentration valley between zones (A) and (B) existed. Even though the PAH formation route shown in Figure 9(a) (HACA mechanism) is the dominant route of PAH formation, PAH formation mechanism coupling with oxygen reaction have to be separate into zone (A) mechanism and zone (B) mechanism, but we need more detailed analysis to estimate the different sub-mechanisms in zones (A) and (B).
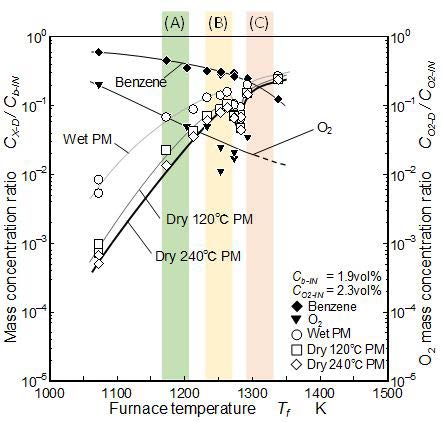
Figure 13 shows the PM mass concentrations of benzene pyrolysis with 2.3 vol% of oxygen. In zone (A), the mass concentration of “Wet PM” was higher than the zero O2 condition. Further the mass concentration of “Dry 120 °C PM” and “Dry 240 °C PM” were one order higher than zero O2 condition in zone (A). Under oxygen exist condition, the formation reaction of naphthalene and phenanthrene became active and these mass concentrations increased. It was considered that the increase of “Dry 120 °C PM” and “Dry 240 ˚C PM” mass concentrations were due to growth of heavier PAHs and their transition to PM.
At high temperature conditions indicated by zone (C), all the detected PAHs concentrations were lower than those of no oxygen condition. In other words, PAHs oxidation effect appeared. However, PM concentrations with and without oxygen showed no obvious difference in zone (C). PAHs oxidation was more easily took place than the PM oxidation but it did not have decisive role for final PM yielded from the mixture. In both of with and without oxygen conditions, yielded PM took the local minimum in a temperature zone (around 1,280 K) between zones (B) and (C) (Figure 10 and 13). It suggests the critical temperature that divided solid PM formation processes did not depend on oxygen in the mixture.
PAH and PM formation behavior showed strong temperature dependence. The experimental results of this report clearly showed three different mechanisms corresponding to the typical temperature zones [46]. These temperature zones were zone (A): 1,190±20 K, zone (B): 1,250±20 K, and zone (C): 1,310±20 K.
Zone (A) (1,190±20 K): It is the low temperature zone and PM was slightly formed. PAH concentrations were also low except biphenyl when pure pyrolysis was taken place. However when benzene pyrolysis was coupled with 2.3 vol % of oxygen reaction, PAHs had concentration peaks. Light-off of pure pyrolysis took place in this temperature zone but light-off of benzene pyrolysis with 2.3 vol% oxygen took place in the lower temperature zone than zone (A). It suggested that low temperature oxygen reaction was more important than pure pyrolysis of benzene itself.
Zone (B) (1,250±20 K): Pure pyrolysis of benzene formed much of biphenyl than naphthalene. It suggest that biphenyl formation route by phenyl radical combination is the dominant route of PAH formation. In benzene pyrolysis coupling with 2.3 vol% oxygen, biphenyl formation was not superior to naphthalene formation. In this case, additional HACA mechanism was considered to be the dominant route of PAH growth. All the PAHs measured here had the concentration peaks in zone (B) and these had the strong relationship with PM peak in this zone.
Valley between zone (B) and (C) (around 1,280 K): All of PAHs and PM showed low concentration levels. It suggested the PM formation mechanism taken place under higher temperature condition (zone (C) and over zone (C) condition) than this valley was substantially different from low temperature mechanism in zones (A) and (B). Even though the PAH formation routes in zone (B) were different in with/without oxygen, this difference had no effect on the final PM formation. Relevant to the final PM formation, existence of this valley had more definitive affect than the difference of PAH formation routes discussed in zones (A) and (B).
Zone (C) (1,310±20 K): PAH concentrations in pure benzene pyrolysis took the local minimum in this zone and then increased. In the case of benzene pyrolysis with 2.3 vol% oxygen, PAH concentrations were low and decreased more with an increase of temperature. PM concentration in this zone was high and around 20% of initial benzene was converted to PM. PAH concentration behaviors in pure pyrolysis and pyrolysis with 2.3% oxygen were different but final PM formation behavior was not affected by these differences. It was concluded that oxygen reaction influenced to the PAH behavior but the final PM formation (solid nuclei formation) was only affected by temperature. When the temperature increases beyond zone (C) temperature, PM concentration might increase gradually until all the high SOF being converted to PM.
Critical temperature of soot yield have been studied by several researchers. Yan, et al. reported that soot yield from acetylene started at around 1,100 K, and Matsukawa reported 1,350 K as the critical temperature of soot yield from ethylene [50,51]. These critical temperatures corresponded the temperatures of zones (A) and (C). N. E. Sánchez, et al. reported PAH peak at 1220 K in acetylene pyrolysis [52]. It corresponded the PAH peaks in zone (B). K. Alexandrino, et al. , Y. Zhai, et al. and C. Saggese, et al. investigated the C3H4 and other lower hydrocarbon peaks at around 1,100 K in soot formation process [53-55]. Above literatures indirectly suggested that the soot formation mechanism in low temperature conditions such as zones (A) and (B) was different from zone (C). Further zone (A) might be controlled by behavior of acetylene and other lower hydrocarbons, and zone (B) might correspond to PAH formation. However there is no direct information for benzene pyrolysis.
In this experimental work, pure benzene pyrolysis was only compared with benzene pyrolysis under 2.3 vol% oxygen. We need more detailed experiment of different oxygen concentration conditions. PAH behavior between zone (A) and (B) might be cleared up by future experiments of different oxygen conditions. Also PM oxidation behavior under high temperature and high oxygen conditions, that is important in practical flame, might be explained by these future works.
PAHs and PM formation from benzene under various temperatures and with/without O2 concentrations were analyzed by using flow reactor. The results are summarized as follows:
(1) PM formations in pure pyrolysis and oxygen exist condition (2.3 vol% O2) were not so different. Slight fraction of PM was yielded even though low temperature condition. It had strong relationship with PAHs concentrations. However over 20% mass fraction of initial benzene was converted to PM at high temperature condition did not depend on PAHs concentrations.
(2) PAH and PM formation behavior showed strong temperature dependence. It suggested three different mechanisms corresponding to the typical temperature zones. These temperature zones were zone (A): 1,190±20 K, zone (B): 1,250±20 K, and zone (C): 1,310±20 K.
(3) As for the temperature dependence, many PAHs except biphenyl showed peaks in both zone (A) and zone (B).
(4) In pure pyrolysis condition with no oxygen, biphenyl concentration was higher than naphthalene. However in oxygen exists condition, biphenyl and naphthalene concentrations were almost same levels. This dominant PAH change was obvious in zone (B).
(5) Under oxygen exist condition, PAHs were low in zone (C). It was considered that PAH oxidation was more easily took place than PM oxidation.
(6) Valley temperature (around 1,280 K) that separated zone (C) from zone (B) had substantial meanings of temperature effect on PM formation. Benzene to PM conversion ratio at the valley temperature was lower than 5%.


.jpg)
.jpg)