Genetic Evaluation Models in Holstein Cows: Genetic Parameters for Test-Day and 305-Day Milk Yield
The study has focused on comparing genetic evaluation models commonly used in dairy cattle in order to appreciate the model that permit a better genetic analysis of the raw performances recorded on the Holstein cows in Tunisia. Herds were divided into groups according to sizes and for each group the genetic parameters were estimated and the breeding values were predicted for 305-days cumulative milk yield (L305) and test-day milk yield (TDM). Two animal models applied to the method of restricted maximum likelihood were used and the analyses counted the random additive genetic effect and the permanent environmental effect. The contemporary groups were defined as Herd*Calving year for L305 and Herd*Control year for TDM. Spearman rank coefficients (ρ) were established to compare the breeding values. Heritabilities ranged respectively from 0.002 and 0.07 and from 0.02 to 0.16 for L305 and TDM and repeatabilities have varied respectively from 0.20 to 0.38 and from 0.34 to 0.47. Breeding values have fluctuated between -608 kg and 519 kg for L305 and between -4.62 kg to 6 kg for TDM; however the contribution of the permanent environment components have respectively oscillated between -2525 to 2590 and between -15.27 to 13.76. Genetic parameters of milk yield were low and the variance components of the permanent environment were higher which suggests a limited genetic variability between herds. The environment effect seems to be fundamentally implicated in milk yield character; therefore the expression of the adequate genetic abilities in Tunisian Holstein herds remains restricted, especially in small herds. The ranking of cows through TDM and L305 were approximately similar; nevertheless the genetic contrast between herds and the estimation of genetic parameters were more explanatory under TDM.
Keywords: Breeding Value; Heritability; Repeatability; L305; TDM; Holstein Cows
Animal selection is defined by setting-up the objectives that have to be reached by a genetic long-term improvement program; which is primarily based on enhancing the important economic traits [1] . However the desired phenotypic level relies on guaranteeing a high genetic potential that requires an objective identification of best genetic materials for prior use in the procreation of subsequent generations [2]. Following the interest shown in the livestock genetic improvement, many algorithmic and methodological approaches have been demonstrated through the advancement of genetic knowledge, statistics and the increased availability of computer resources in order to classify animals according to their most likely genetic additive value, known as breeding value [3,4]. Genetic evaluation requires the phenotypic and pedigrees information collection occurs through the milk recording system; and data analysis efficiency depends whose on the maximum exploitation of the available information and the decaying of the random and fixed effects within each herd and between herds [5]. In dairy genetic evaluation systems, the lactation model was commonly used while estimating the milk yield for a cumulative standard period of 305 days through multiplying monthly milk controls by coefficients which are developed from the average ratio of the total productions on the partial productions of the same duration. This method requires extrapolation of incomplete lactations and tends to underestimate poor productions and to overestimate the best ones. Besides, intervals between controls are not always standard and some controls could be missing which may interfere the yield estimation. Since November 2002, most major dairy countries have adopted a more sophisticated methodology known as the Test Day Model or “Test Day” which directly exploits daily controls rather than using the cumulative production over a 305 days period. The development of this approach aimed to provide a better estimation of the milk yield during a given lactation as each control milk production is statistically and automatically correlated with previous and anterior controls while considering intervals between the controls. The only sensitive point of this model is the fine definition of the group of contemporaries [6]. Therefore, it is essential to elect the methodology that leads to better identify the best performing animals to optimise the selection process. In this context the objectives of this work were to exploit the potentialities of the two main models used in dairy genetic evaluation, L305 and TDM, to find the most adjusted model to the Tunisian Holstein herd performances.
The file used for this study was that of the official milk recording conducted by the Agency of Livestock and Pasture (O.E.P). It included 146 752 test-day data recorded on 16 145 Holstein cows in their first, second and third parity, calved between 2006 and 2011 and belonging to 116 herds. Herd sizes (HS) have varied between 20 and 1712 cows and were classified into eight balanced groups (HS = 50; 50 < HS < 100; 100 ≤ HS < 150; 150 ≤ HS < 220; 220 ≤ HS < 300; 300 ≤ HS < 400; 400 ≤ HS ≤ 600; HS > 600). Days in milk ranged between the 25th and the 365th day of lactation and were classified into 34 intervals of 10 days each. Eight monthly performances separated by an average regular interval of 42 days were defined from daily controls and 22 523 standard yields were calculated using FLEISCHMANN method recommended by the International Committee for Animal Recording [7]. Lactations were standardized to 305 days by multiplicative correction coefficients in order to create a basis for comparison between the cows. The number of cows and records in the various classes of herd sizes are shown in Table 1. The complete pedigree of the 27 649 individuals was used to estimate the variance components. Contemporary groups were defined as herd*calving year for L305 and of herd*control year for TDM. The applied animal model included the additive genetic random effect, the fixed effect of contemporary groups and the linear and quadratic regressions of the covariates herd, control year, control month, milking frequency, parity and days in milk for TDM and herd, calving year, calving month, milking frequency and parity for L305. Estimation of variance components, genetic parameters and prediction of breeding values were made simultaneously by the restricted maximum like hood method using the Variance Component Estimator programme (VCE 5.1) [8]. The Best Linear Unbiased Predictor (BLUP) applied to the general mixed linear animal model was used in accordance to the matrix blow [9-11]:
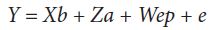
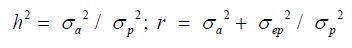
Where y is a vector containing the test day milk yields, or the 305-day milk yields, b is the vector of solutions of the fixed effects,a is the vector of solution for direct additive genetic random effects, ep is the vector of solution for permanent environment random effects, X, Z and W are coefficient matrices relating phenotypes to fixed effects, additive genetic random animal effect and permanent environment random effect respectively, and e is the vector of residual random effects. Genetic parameters estimation and breeding values prediction were made for each herd size class [12,13]. Heritability and repeatability were estimated using the following formulas [1,12,14,15]:
The connection between results was based on comparing the estimated genetic parameters, on the appreciation of the distribution of genetic variability among herd classes and by establishing the report between the classifications of cows according to their breeding values calculating the Spearman rank coefficient (ρ) [16].
Using the BLUP animal model including the random additive genetic effect and the permanent environmental effect, the successive performances were considered repeated observations and the non-random distribution of breeding values according to the different modalities of environmental conditions were taken into account; thus heritabilities and repeatabilities were calculated. For L305 model, h2 and r have ranged respectively from 0.02 to 0.07 and from 0.20 to 0.38; and regarding TDM they have respectively fluctuated from 0.04 to 0.16 and from 0.34 to 0.47 (Table 2).
The found heritabilities were very infinitesimal given that dairy milk yield has been commonly demonstrated a moderately heritable trait whose h2 varies from 0.19 to 0.21 and from 0.17 to 0.25 in Tunisian Holstein cows [17,18]. Besides it has been widely demonstrated that milk yield h2 is from 0.27 to 0.43 and from de 0.17 to 0.51 [19,20]. Repeatabilities have varied from 0.20 to 0.47 and are considered relatively low as long as r found in Tunisia are about 0.53 and 0.57 with an average of 0.39 and a minimum of 0.31 [17,18]. In contrast, genetic parameters revealed by TDM were higher.
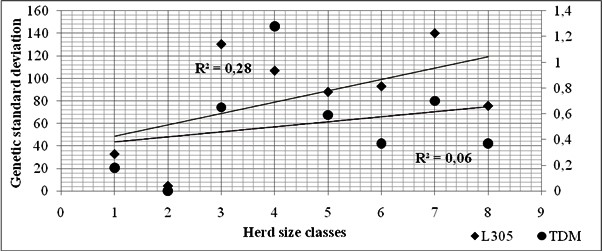
Average breeding values have oscillated between -608 kg and 519 kg for MY305 and between - 4.62 kg and 6 kg for TDMY. Permanent environment component have ranged from -2525 to 2590 for MY305 and from -15.27 to 13.76 for TDMY and have remarkably exceeded additive genetic components. These results explain that the environment conditions are significantly involved in the reached yield levels and attest the correlation between genotypes and the surrounding circumstances; known as phenotypic plasticity, environmental sensitivity or interaction between heredity and environment; that lead to modify standard phenotypic character [1,21]. Besides the genetic standard deviations were deficient and ranged between 4.57 kg and 140.21 kg for MY305 and between 0.18 kg to 1.28 kg TDMY which reflect a lack in genetic diversity inter-herds. The found trend demonstrates that the adequate expression of the genetic potential of cows is penalized. Thus, the observed phenotypic variability is mainly due to non-heritable phenomenon and the husbandry circumstances are non-favourable for dairy yield especially in small herds as it was found by [18,22]. The disparity of genetic deviation according to the ultimate diversification of management conditions was more clearly explained with TDM referring to the coefficient of determination which was much lower (R2= 0.06) (Figure 1).
All correlations found between the indexes were positive and have varied between 0.94 and 0.64. These values explain a parallel classification of the cows according to their genetic merit (Table 3). The lowest coefficients have corresponded to small herds counting between 50 and 150 cows. Thus, there is no disadvantageous relationship between the two assessment models as have found but it would be better to favour TDM because it improves the accuracy of genetic indexes, especially in small herds as long as they are the most vulnerable to the reduced genetic variability [18,23].
The exploitation of the common management conditions in genetic evaluations ensures better identification of the fixed effects which helps to distinguish the transmitted genetic values by minimizing average random errors for the environmental effects. TDM is better suited to analyse milk yield and brings more precision due to a fractional analysis on multiple days in milk instead of a whole 305-days standard period. Furthermore, random errors are reduced in TDM by avoiding the estrangement between successive controls, the lack of some controls and the extrapolation of the incomplete lactations. TDM then represents a more powerful and flexible diagnostic tool that promotes more dynamic steering of herds and production management.