Global Externalities At Empirical Analysis: A Practical Assessment
This article provides an empirical analysis of panel data on the performance of 18 high-income countries with respect to CO2 emissions and the adoption of clean electricity technology between the period 1990 to 2018. We show how one can take advantage of a very stable econometric relationship, to explore the contribution of other variables and new explanatory models. These tools are extraordinarily flexible that can be used to capture the impact of several variables that are essential for understanding the complexity of heterogeneity of the panel data. The results show in the Driscoll and Kraay estimator framework we found that the semi-elasticities indicate that if fossil electricity and GDP increase by 1% carbon dioxide emissions increase by 0.22% and 0.52%, respectively. On the other hand, the electricity from the renewable energy mix semi-elasticities shows a significant decrease in CO2 emissions of -2.02%. Whilst, the elasticity of fossil electricity and GDP showed values of the coefficients 0.29% and 0.34% at the level of significance of 1%. This result proves that the CO2 emission is elastic in relation to variations in fossil electricity and gross domestic product. The negative signal for renewable electricity supports a negative impact on CO2 emissions for the panel, i.e., if these countries give priority and increase 1% renewable electricity production, these investments cause a reduction of (-0.08%) in CO2 emissions. This proves that the coefficient of CO2 emissions is perfectly inelastic to the positive variation of electricity production of ‘mix of renewable resources. The result supports the correction of Granger causality errors and shows that the imbalance of the model is corrected by about 25% in the following period. Therefore, the results indicate that the form of electricity production chosen by policymakers can hamper the diversification of the energy matrix and is likely to become a serious risk to pollution mitigation policies.
Keywords: CO2 Emissions; Economic Growth; Renewable Electricity; Fossil Electricity; Global Externality
Climate change mitigation has become urgent particularly in the sectors productive and all others who demand energy for their activities and services (The Intergovernmental Panel on Climate Change (IPCC) 2007). All around the world, the primary energies of conventional sources have had a large share of responsibility for carbon dioxide emissions and other gases with great relevance to the greenhouse effect in the climate system [1,2]. In this context, the 2015 Paris conference on climate change appears as a watershed mark in the efforts of the international community to grapple with global warming through reducing greenhouse gas emissions (GHG) [3]. On the other hand, the need for economic growth in developed countries has pushed primary energy consumption such as coal, oil, and natural gas, and this has strengthened the environmental vulnerability [4].
Fossil fuels in 2015 represented 81.7% of energy production worldwide. Between the sources of energy that had increased oil production grew 2.3%, followed by renewables 1,9%, natural gas, and nuclear energy 1,4%. Coal production was the only source of energy that had declined (-2.6%), the first since 1999 [5]. Among non-fossil sources, biofuels and waste maintained their participation in world energy production in 2015 (9.6% compared to 9.5% in 2014). However, with a slower development 1.2% compared to 1.5% in 2014 and 1.9% in 2013 and 3.0% in 2012. Whilst hydro slightly decreased by 0.5% in 2015, the first decline in global production since 1989. The electricity has provided 2.4% of global production as well in 2014 [6]. The renewable sources, such as wind, thermal solar energy, solar energy, geothermal, maintained expansion at an accelerated rate of 16.8%, 6.8%, 29.7%, 4.1%, respectively. But they still represented less than 2% of global energy production. Finally, nuclear energy increased its participation by 4.9%, producing 1.4% more energy in 2015 than in 2014 [7].
The relationship between economic growth rates and energy consumption associated with pollutant emissions has been the subject of several studies under several results over the last two decades. Especially, because these studies have examined the background and identified the problems of pollution which has “linkage” with the main environmental dilemmas of our present day. For example, the need to increase energy consumption to ensure the economic and welfare growth of society [8,9]. However, between 2014 and 2015, carbon dioxide (CO2) emissions from electricity generation decreased by 0.9% compared with an increase of 0.4% between 2013 and 2014 and 1.4% between 2012 and 2013. On the other hand, although oil participation in CO2 emissions of electricity has steadily decreased since 1990. The participation of the gas increased slightly, and the participation of coal increased significantly from 65% in 1990 to 72% in 2015. This trend, however, is changing and, in recent years, a gradual change of coal to gas in the electricity generation has occurred. As an impact, 2015 was the first year in which global emissions from coal combustion significantly decreased since crisis recovery [10].
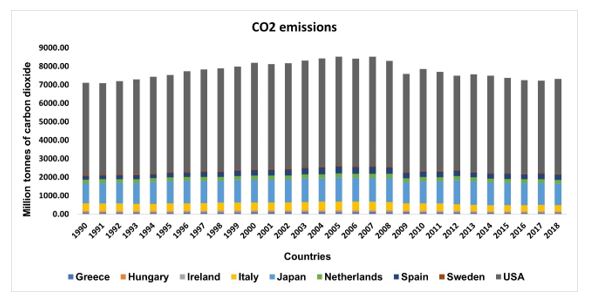
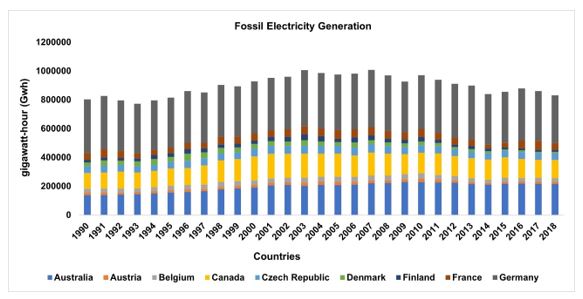
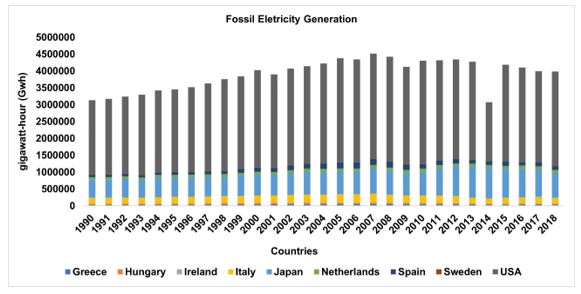
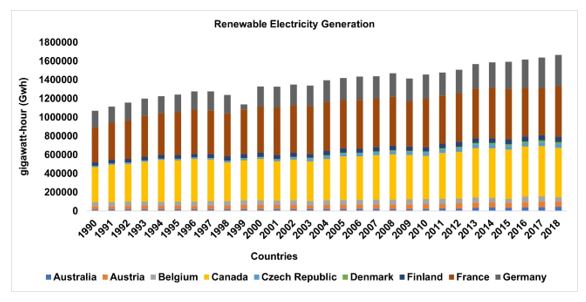
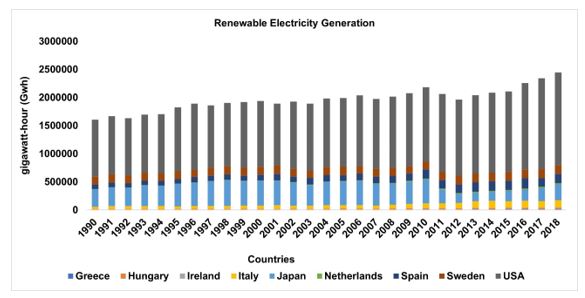
This study has a special interest in the relationship between electricity generation, gross domestic product (GDP), and CO2 emissions. This is due to several found divergent results by researchers all around the world who have tested these variables. In carrying out this experiment, we focus on the great growth in electricity consumption in high-income countries, and the countries from the Organization for Economic Cooperation and Development (OECD) are rich economies with several energy sources that ensure those pollutant emissions. Figures 1(a), 1(b), 2(a), 2(b), 3(a), 3(b), 4(a), and 4(b) show the evolution of CO2 emissions, and energy production (fossil and renewable electricity), respectively for the 18 high-income countries of the Panel examined.
The development of productive activities should provide a large expansion of the electricity sector and this depends on the combination of energy resources to electricity generation (Weisser 2007). Although some studies have found empirical evidence that the electricity of renewable sources has been able to reduce the GHG level, mitigation has a cost associated with the sacrifice of economic growth [11, 12].
Thus, the main objective of this study is to identify and examine the potential impact of electricity generation by type of energy source - fossil and renewable - once the OECD members have played an important role given the sharp level of electrification of their economies. Therefore, estimating the determinants by decomposing the short- and long-term elasticity of the variables underlying the lagged CO2 emissions over a period and multiplied by ratio (-1), is the novelty of the study.
In practice: (i) these procedures provide greater consistency in the relationship between explanatory variables and sharing and, consequently, the impact of each electricity source on CO2 emissions; (ii) we use second-generation the unit root test and Driscoll & Kraay estimator to Panel ARDL (P-ARDL) model and ensure the robustness of analysis through this method; (iii) we also applying the unrestricted error correction mechanism (UECM) to identify the imbalance correction of the model. Indeed, the contribution of this research is to add new facts, elements, and conclusions with empirical evidence to state of the art. This never was testing before for this countries group. Besides, the used methodology is a differentiated addition to the research.
The remainder of this paper is organized as follows. Section 2 presents a review of the literature. Section 3 presents the econometric methodology. The results and discussions are presented in Section 4. The last section evaluates conclusions and policy implications.
Several studies examine the relationship between energy consumption, economic growth, and the environment [13]. A great part of recent literature uses panel data approaches with a multivariate framework type [14]. The results have been conflicting to depend on the type of sampling, the time interval, and methodology [15]. The main research has been explored by several researchers with the intuited to minimize the long-term impacts of economic policies aimed at reducing pollutant gas emissions. Given the fact that literature on the relationship among energy-growth-environment nexus is very large and diversified, we will concentrate only on recent results.
These studies that investigate the energy-growth-environment-nexus have contributed to the literature in many ways, for example, [16] have confirmed the existence of the relationship of long-run independence between CO2 emissions and electricity consumption for OECD countries. For these authors, carbon dioxide emissions and electricity consumption can be reduced in the long run. On the other hand, they linked the result to a worrying scenario in which a simultaneous increase in the level of carbon dioxide emissions is expected according to the growth of income.
[17] estimated a long-term relationship between pollutant emissions, economic growth, and electricity consumption for the countries of the Gulf Cooperation Council (GCC). The research concluded that electricity consumption and economic growth are positively associated with the increase in carbon dioxide emissions in the long-term. Another conclusion is that there is a unidirectional causal link running from electricity consumption to pollution emissions. In turn, [18] studied the economy of the United Arab Emirates (UAE), the results showed that electricity consumption has reduced carbon dioxide emissions. For [19] the intensity of carbon dioxide emissions among OECD countries diverges substantially once these intensity variations are justified by the productive structures of some European countries that are part of the OECD. For these authors, electricity trade and GHG emissions may increase in the future if effective emission reduction and regulatory measures are not implemented massively in these countries. In turn, [20] examines the issue of electricity efficiency and concluded that the increase in efficiency consumption of electricity from the Netherlands economy is associated with positive effects. But that the energy savings achieved by intelligent mechanisms had no significant influence on the intensity of CO2 emissions.
[21] re-examining the question of a causal link between electricity consumption, growth and carbon dioxide emissions in the BRICS countries - Brazil, Russia, India, China, and South Africa - with data from the period 1990-2010 obtained empirical evidence of bidirectional causal relationship running from GDP growth to CO2 emissions in Russia, unidirectional causality running from CO2 emissions to GDP growth in Brazil, and unidirectional causality from electricity consumption to pollution in India. [22] examine the relationship between CO2 emissions, electricity consumption, and economic growth for the United Arab Emirates during the period 1975-2011 and demonstrate that electricity consumption contributes to better environmental quality.
To [23] the mitigation impact of energy consumption on CO2 emissions is considerably smaller than that of renewable energy consumption, implying that renewable energy will be the main contributor to CO2 emissions mitigation in China. Whilst for [24] the development and expansion of renewable are essential to prevent global warming. [25] examined the potential of energy extracted from waste for a group of European Union countries and concluded that energy waste is important for reducing GHG emissions. [26] investigated the strategies as a source of compatibility between renewable energy and economic growth. The results suggest that renewable energy did not contribute to economic growth, while non-renewable energy contributed. [27] found empirical evidence that electricity production at the aggregate level is an environmental pressure factor and the main indicator of economic activity in South American countries. [28] studying energy production and CO2 emissions for Brazil found evidence that GDP, hydropower, and renewable energies have negative effects on the CO2 emissions model, while pollution emissions and trade openness have positive effects on the economic growth model.
As can be seen from the vast literature. There are several studies, focusing on the importance of understanding CO2 emissions at the effect of aggregate energy on emissions. However, studies have ignored the decomposition of the determinants of emissions separately and have indicated conflicting results. The contribution of this study is to address this gap in the literature that still insufficiently.
The electricity-growth-environment nexus is investigated in this study using data about 18 OECD countries, namely: Australia, Austria, Belgium, Canada, Czech Republic, Denmark, Finland, France, Germany, Greece, Hungary, Ireland, Italy, Japan, Netherlands, Spain, Sweden, and the USA. The data is used following the availability. In this way, the other countries’ members OECD do not include in the sample due to the series discontinuity. The macro panel contains countries with high income per capita, it was used the data during the 1990 to 2018 period. The following variables were utilized: Carbon dioxide emission pollution (PCO2)-measured in metric tons; Fossil Electricity (OilElectr)-measured in gigawatt-hour (Gwh) (comprises Coal, Oil, and Natural gas generation); Renewable Electricity (RElectr)-measured in Gwh (comprises electricity generation from biofuel, biomass, hydro, solar, wind, and waste); gross domestic product (GDP) per capita in local currency unit constant, indeed, this reduces the influence of exchange rates; and trend (T) - a proxy deterministic used to capture the specifics of the technical factors.
The variables data were previously applied natural logarithm as is usual in this type of study to control their variability. This minimizes eventual problems of heteroskedasticity that could compromise the quality of econometric results and their economic interpretation; they were also calculated in per capita units to control the large disparities between the countries analyzed. The data are annual. The production of electricity by type of source was collected from the International Energy Agency - website, www.iea.org. The data from GDP and carbon dioxide emissions were obtained from the World Bank’s - World Development Indicators (WDI) and BP Statistical Reviews 2020 database, available at worldbank.org and www.BP.com, respectively.
The OECD countries have high-income levels. As well as goods production and consumption. The productive activities of these countries consume increasing amounts of energy and consequently increase the levels of greenhouse gas emissions (Calbick and Gunton 2014). Due to the data sample of countries that have been of high-income levels, there have their specificities and at the same time common in the set of data that possibly share a common level of development. In this research, we employed two methodologies, namely, the mean group (MG), the Pooled Mean Group (PMG), and Fixed Effects (FE) estimators. This regression method is used to identify the heterogeneity of the panel, and then we will use the autoregressive panel model with distributed lag (P-ARDL) with Driscoll and Kraay estimators, and an unrestricted error correction model (UECM), which will perform the decomposition of factors and identify short- and long-term impacts.
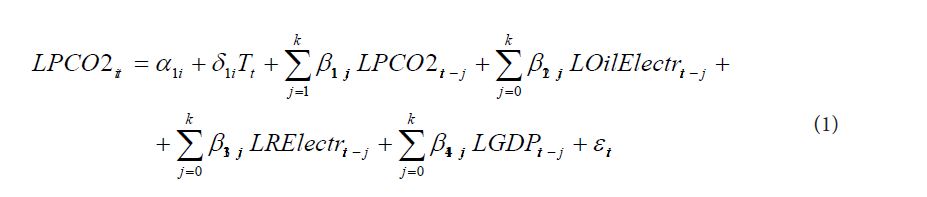
Therefore, to identify the short-term and long-term equilibrium relationships, we use the P-ARDL approach that contains general dynamic specification with lags of the dependent variable and contemporary lags of the independent variables. The general P-ARDL model can be estimated as specified in equation (1).
The dynamic effects and the adjustments of consistency that are included can be captured with the inclusion in the model, the unrestricted error correction mechanism-UECM. Thus, Equation (1) is parameterized as follow:
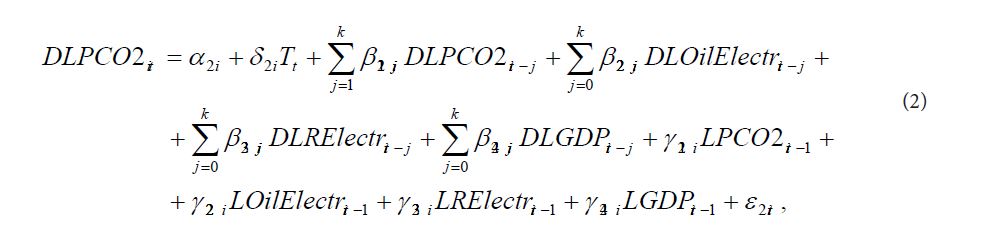
where i2αdenotes the intercept/intersection for each country i(i=1,2,...,8),i2δ,ij21β, k=1,...,m, e im2γ is coefficients of the parameters andit2ε is the random error term.
The CSD test for cross-sectional dependence has the advantage of indicating whether model variables are sharing common patterns. The sharing of common shocks may be due to several factors from common policy decisions or responses to external shocks or even other interdependencies shared between countries. The interdependence between data may be spatial (see Anselin 2001) and global [29].
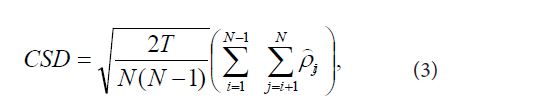
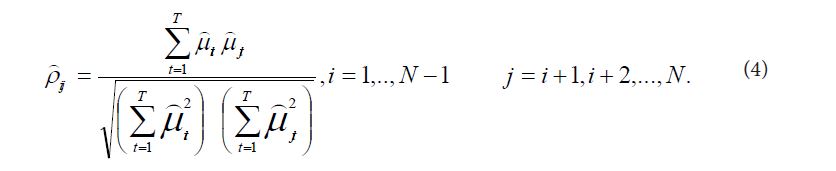
Recent econometric research concluded that panel data models are likely to exhibit substantial cross-sectional dependence in the errors. This may arise because of common shocks, spatial dependence, and unobserved components [30]. The Cross-sectional dependence (CSD) is based on the pairwise correlation coefficients residuals. The CSD test is as below:
where is the sample estimate of the residuals and is defined as follows:
The results of the CSD test (see Table 1) indicate that CO2 emissions have the second-highest value, behind the only GDP with 1% significance. Whilst, the energetic variables have values that are also significant at the 1% level of significance. This represents that fossil electricity (32.25) is more representative than renewable electricity (25.85) in order of relevance to the panel. The null hypothesis (H0) of this test is independence, which in this case is rejected for all variables at the level. Therefore, the panel countries share common impacts. In other words, this means that OECD members are responding at the same time to international stimuli, i.e. these countries are integrated when it comes to the development of renewable energies. On the other hand, although all values of the variables in 1st differences are reduced, the rejection of the null hypothesis for renewable energy was not found.This means that although countries are very similar, there is a sign that they do not fit in the same way in the long run. This is because the strategies for the development of renewable energy are individual initiatives of each country.
Thus, the goals established by international agreements have been ratified by a great part of European countries and that also is part of OECD. These countries have taken targets to leverage the electricity generation from renewable energy sources in international agreements. On the other hand, renewable energies for this set of countries are ultimately those that involve greater risks (either by intermittent or because they are dependent on a higher degree of incentives and/or natural phenomena). Fossil energy, for example, is more stable and storable. Therefore, this specificity indicates that renewables development will not succeed if they are not encouraged using subsidies, and the stimulus arising from international pressure.
In this case, incentives should consider not only the level of specificity due to the heterogeneity of each member country. But, mainly because of the sharing of resources between countries, they are also not uniform. Thus, the investments necessary for the development of the electricity matrix of the mix of renewable energy to ensure technological innovation, energetic and economic efficiency are relevant to mitigating CO2 emissions from this set of countries that mainly depend on fossil energy sources (Renewable Energy Policy Network for the 21st Century - REN21 (2015). As reported early the income and fossil electricity generation have their values 60.00 and 32.28, respectively, and confirms that countries are synchronized, because the null hypothesis is rejected at 1% significance level. This result explains the presence of CSD in the panel once the countries share common trends. In other words, series tend to evolve roughly the same way for OECD members.
Several panel unit root tests have been developed by literature. For instance, the first group includes first generation unit root tests that do not allow for cross-sectional dependence [31]. The null hypothesis (H0) of the unit root test is that series are integrated of order one, are I(1), or that has a unit root that is tested against the alternative hypothesis of stationarity (H1) [32]. The presence or rejection of unit root in the series can be verified by values of probabilities, with asymptotic chi-square distribution and with asymptotic normality of the data [33, 34]. Given the heterogeneity of the data, the tests are relevant to demonstrate that variables are not I (2) which is mandatory in this specific case to the application of the in-panel ARDL approach (P-ARDL). In this sense, we use two unit root tests, namely, first and second-generation tests. Where the second consists of taking cross-sectional dependence into account.
This unit root test is based on Pesaran [35], it is robust to examine the heterogeneity and test the null hypothesis (H0) under non-standard distribution. Indeed, allows the correction of problems that are not identified with the use of the first-generation tests. However, we consider that it should be included as a reference (Table 2 presents the results of the 1st generation and 2nd generation unit root tests). The first results without deterministic tendency indicate that GDP has a unit root and all other series are stationary. Whilst the series in 1st differences indicate that all series are stationary. The CIPS test with level and trend presents three series with unit root (LOilElectr, RElectr, and GDP). Whilst that (LPCO2) is stationary. Finally, the same test in 1st difference indicates that the series is stationary. Thus, the results are consensual and lead to the conclusion that all series are integrated of order one or are I(1).
This unit root test is based on [36], it is robust to examine the heterogeneity and test the null hypothesis (H0) under non-standard distribution. Indeed, allows the correction of problems that are not identified with the use of the first-generation tests. However, we consider that it should be included as a reference (Table 2 presents the results of the 1st generation and 2nd generation unit root tests). The first results without deterministic tendency indicate that GDP has a unit root and all other series are stationary. Whilst the series in 1st differences indicate that all series are stationary. The CIPS test with level and trend presents three series with the unit root, namely (LOilElectr, RElectr, and GDP). Whilst that (LPCO2) is stationary. Finally, the same test in 1st difference indicates that the series is stationary. Thus, the results are consensual and lead to the conclusion that all series are integrated of order one or are I(1)
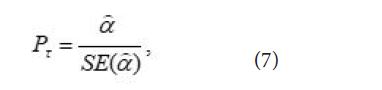
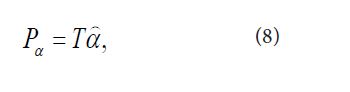
The problem of the techniques developed to test cointegration in the presence of long-term relationships between integrated variables is that it is often not possible to reject the null hypothesis of non-cointegration [37]. The failure of cointegration tests requires long-term parameters to be equal to the short-term parameters for the variables in the first differences, leading to a significant loss of the explanatory power of the estimated model (Persyn and Westerlund, 2008). For our empirical case, we applied the Westerlund cointegration test. This panel cointegration test has the great advantage of being able to control cross-sectional dependence. The panel tests have great power, as they have based on the pooled least squares estimators α, and pooling is efficient under the homogeneous power. Among the panel tests, αPit has the highest power when the common factor restriction is satisfied and among the group mean tests, it τGhas the highest power (Westerlund 2007). The test can be computed as follows:
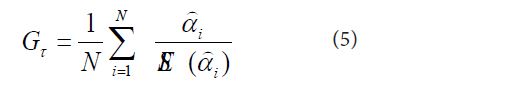
where is the conventional standard error ofiα .?
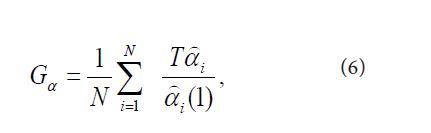
Whilst the panel statistics can be computed as:
Similarly, the group means coefficient statisticαG,αP which may be normalized by the cross-sectional average of the effective number of observations per individual rather than by T (Westerlund, 2007).
This test of cointegration tests the null hypothesis of non-cointegration of the series of the panel in level and controls the transversal dependence and the use of the technique with bootstrapping gives robustness to the analysis. Given the relatively short time length of the available data can impose difficulty in the analysis of cointegration. However, the likely existence of long memory of variables in analysis and use of the tests based on the bootstrapped using asymptotic p-values, the results show that the null is not rejected and as such they support no co-integration in both statistics (see table 3). In this case, the results of the panel cointegration reveal that is correct we choose the use of less hard econometrics techniques to cointegration tests (e.g., the panel ARDL model).
The combustion of fossil fuels in power plants, vehicles, machinery, and dwellings continues to be a leading contributor to global man-made greenhouse-gas emissions. Although many governments have already taken steps to reduce the carbon intensity of their economies, some policies remain in place that encourage the production and use of fossil fuels. Fossil-fuel subsidies are one such policy (OECD 2019). In this investigation, the factors associated with electricity generation from fossil and the renewable mix on GHG emissions of a macro panel of high-income countries were examined. To detect the most efficient estimator to deal with the characteristics of the panel data, the presence of individual effects was tested.
To estimate the individual effects of the common shocks shared by the OECD panel countries, two models were first used, the random-effects model - RE and the fixed effects model - FE. The null hypothesis of this test is that the random-effects model, RE, is the most appropriate and, if this hypothesis is rejected, it is concluded that the most suitable is the fixed effects (FE) model. In the case of the RE model, its structure needs to be rearranged, namely, concerning its error term that takes on the form μi + ω –l o, where μi denotes N-1 country-specific effects, and ωit are the independent and equally distributed errors. Thus, eq. (2) becomes Eq. (9) changing ɛ2 -o to μi + ω as follows.
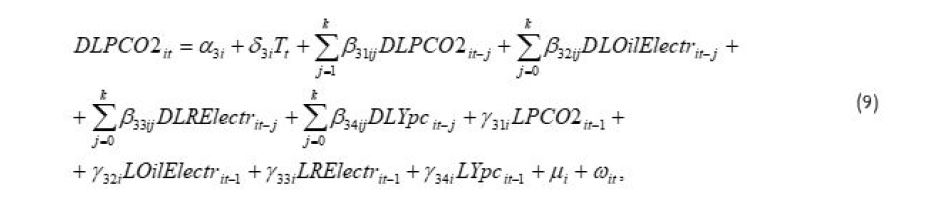
In this formulation is i3α the intercept, i3δ, kij3β, k= 1,...,m, e im3γ, are the parameters, and μi + ωit is the error term. After this procedure, the model with the support of the xtreg command in Stata was estimated together with Hausman’s test and the null is rejected 27χ = 79.97 and prob (2χ) = 0.0000 at 1% significance level supporting the use of a fixed effect estimator. Therefore, given the dynamic characteristic of the macro panel, the presence of long intervals, and considering the heterogeneity of the parameters, the next step was to perform an estimation with a dynamic model to identify the coefficients of the short and long term. For this, a more general Mean Group (MG) model, a hybrid Pooled Mean Group (PMG) model, and finally a fixed-effects model (FE) was used. The first model uses an estimator that generates individual estimates for each country that are a weighted average of the coefficients; the second restricts long-term estimates allowing only short-term ones to vary, and the fixed effects estimator estimates parameters in the usual way at the level of the model constants [38]. These models are generally used to deal with the slope heterogeneity of the parameters.
In this sense, given the need to include the error correction mechanism, UECM, in the ARDL model used to correct the problem of correlation between residues and endogenous regressors, and how the PMG estimator restricts long-term elasticities to the condition of being equal, this, in turn, generates efficient and consistent estimates when the restrictions are true. If not, this would imply that if the true model were heterogeneous, the results of the estimators given by PMG would be inconsistent. As for the MG estimator, it presents consistent estimates in both cases. To distinguish which of the estimators is used, the Hausman test is used, as already mentioned [38]. We show the results of the Hausman test among the estimators in table 4. The results mean that there is strong evidence that the panel is homogeneous, or that the heterogeneity of the slope of the parameters has not been verified, since the FE is the most appropriate estimator.
To ensure that the estimates will not be affected by violations of the basic assumptions of the model. A battery of tests was carried out to check the robustness of the analysis that integrates, namely: The Pesaran test and Friedman test to identify problems of contemporary correlation between sections (cross-sections); Woodridge test to identify serial autocorrelation; Modified Wald test to identify heteroskedasticity problems between errors; Null hypothesis (H0) of this first battery of tests are for cases of autocorrelation, are that the residues are not correlated or are random and follow a normal distribution and that there is no serial correlation between the errors; the heteroskedasticity test is that errors are homoscedastic or have constant variance.
We still applied the tests of Bhargava, Franzini, and Narendranathan’s Durbin-Watson (W-D) and Baltagi-Wu’s LBI “local best invariant”, to strengthen the analysis of autocorrelation and to give robustness to the model. The results (see Table 5) Indicate that the tests Pesaran, Woodridge, and Modified Wald reject the null hypothesis (H0). Therefore, the model presents the correlated residues, first-order serial correlation, and heteroskedasticity, respectively. Finally, Bhargava et al. Durbin-Watson e Baltagi-Wu LBI Indicate there are no problems of autocorrelation between error residues. Thus, the error specification tests indicated contrast in the results this may lead to erroneous analyses [39].
To solve the detected problems, we chose to estimate a new dynamic FE model using [40] estimator. This estimator allows the standard error to be robustly corrected. Before, the VIF test was applied to the variables of the model (see table 6) to verify the possibility of them presenting multicollinearity. The result of this procedure is clear that the variables in level and first differences do not have problems of multicollinearity, or at least that it is not serious because the standard value for this test ranges from 0 to 10, being considered serious multicollinearity. The VIF test indicated that the level series have maximum and minimum values ranging from (1.02 to 1.33). While the values of the series in 1st differences vary between (1.02 and 1.08) for the maximum and minimum values, respectively.
The mean values of the VIF test for the series in level and 1st differences are 1.18 and 1.04, respectively. This result confirms that the multicollinearity does not represent problems for the estimation of the models, which will be analyzed next. Cross-sectional or ‘‘spatial’’ dependence is a problematic aspect of many panel data sets in which the cross-sectional units are not randomly sampled. For example, spatial correlations may be present in macroeconomics, regional science, or international economics applications in which the cross-sectional units are a nonrandom sample of states, countries, or industries observed over time, as these units are likely to be subject to both observable and unobservable common disturbances.
The estimated cross-sectional covariance matrix can then be used to construct standard errors that are robust to the presence of spatial correlation [41]. Therefore, given the dynamic characteristic of the macro panel, the presence of long intervals, and considering the parameters of the dynamic model. This modeling specifically held the objective of identifying the most parsimonious model feasible. In this sense, considering the presence of the phenomena of heteroskedasticity, panel autocorrelation, contemporaneous correlation, and cross-sectional dependence, we applied the traditional Fixed Effects (FE) estimator, both with the common standard errors and with the robust standard errors, and their results were compared with those from Driscoll & Kraay estimator.
The short-term coefficients of the panel (see Table 7) demonstrate the pollutant emissions as a dependent variable (equation 2). For this case: fossil electricity generation and GDP per capita have a positive impact on CO2 emissions at 1% significance level; the semi-elasticities also indicate that if OilElectr’s and GDP increase by 1% carbon dioxide emissions increase by 0.22% and 0.52%, in the short-term, respectively. On the other hand, the technological factors represented by a (trend) have negative effects on CO2 emissions and reduce CO2 emissions. This has sense since the lagged CO2 emissions a period reduces emissions by about 0.24%. The electricity production from renewable energy mix showed significance in the short-term of -2.02%, therefore the semi-elasticities show a significant decrease in CO2 emissions. Whilst in the long-term relationship, fossil electricity production, and GDP continue to have a positive impact on CO2 emissions, but with lower intensities (0.07%) and (0.08%), respectively. To exemplify the coefficients shown in table 7 are the same for all models, in this case, only the level of significance varies (see [42].
As shown in Table 3, the null hypothesis of the cointegration test was rejected, so we used a mathematical artifice to estimate long-term elasticities. In this case, the elasticity is obtained by dividing the coefficient of each variable by the coefficient of PCO2 with a lag and multiplied by the ratio -1. Therefore, when the analysis is performed based on the ratio of each electricity source (see table 8), all results show that the variables fossil electricity and GDP have the same behavior for all estimators. However, the renewable source has asymmetric behavior due to the negative signal. This result supports that the renewable energy mix is very important for public policies to reduce CO2 emissions in the long term. Although the coefficient estimator fixed effect robust has no significance, the other two estimators (fixed effects traditional and fixed effects with Driscoll & Kraay) supports the importance that countries have given the issues of renewable energy. This only occurs for these countries receive stimuli investments in renewable electricity due to international pressure. The elasticity of fossil electricity and GDP showed values of coefficients 0.29% and 0.34% at 1% significance level. This result proves that the CO2 emission is elastic concerning the variations from fossil electricity and gross domestic product.
The negative signal for renewable electricity supports a negative impact on CO2 emissions for the panel, i.e., if these countries give priority and increase 1% renewable electricity production, these investments cause a reduction of (-0.08%) in CO2 emissions. This proves that the coefficient of CO2 emissions is perfectly inelastic to the positive variation of electricity production of ‘mix of renewable resources. The result supports the correction of Granger causality errors and shows that the imbalance of the model is corrected by about 24% in the following period (see UECM value in table 8).
The political implications are several: firstly, the results clearly show renewable electricity indicating that the imposition of global public policies through international agreements (Kyoto protocol and recently the Paris conference). However, as known, it is an attractive alternative for the gradual transition of the energy matrix with increasingly lower levels of fossil-sourced electricity production for higher levels of renewable electricity. Therefore, investments to increase this percentage from the renewable mix are more logical for a long-term public policy to drive the reduction of pollutant emissions from panel countries. In the short term, this relationship is associated with variations from country-to-country generation since production is not uniform. That is, the countries of the panel are managing the problem of energy-producing and at the same time achieving the goal of reducing CO2 emissions differently. Otherwise, they are assuming that these countries are equal when they are not. Overall, the main dilemma is to increase energy production to continue the economic growth trajectory with less environmental degradation rates.
However, renewable energies for these countries are less attractive compared to fossil energy which is cheaper and stable and therefore more storable. Paradoxically the renewable energy is the one that can adjust production, and which can function as a reserve to be used with parsimony. i.e., developed countries will be able to adjust in production over time by managing the renewables, looking forward, not based on meticulous management of the moment, as demonstrated by the short-term result, and for this reason, it is necessary to perceive better the electricity generation from each country. In this case, a possible additional solution is to focus on the objective of reducing pollutant emissions via technology to increase the efficiency of electricity consumption.
This research analyzes panel data on the performance of 18 high-income OECD countries with respect to CO2 emissions and the adoption of clean electricity technology between 1990 and 2018. The results provide empirical evidence of cross-sectional dependence in the data, indicating that countries share common shocks throughout their development processes. The null hypothesis of non-cointegration was not rejected for the parameters, which may be related to the relatively short time of the available sample data, which may impact some distortions in the cointegration analysis. However, the results confirm the role of the various sources of electricity and GDP for the energy-growth-environment nexus in developed high-income countries.
Economic factors add consistent effects, both in the short and long term, with the results showing the positive and contemporary effects of fossil energy on CO2 emissions. In other words, fossil electricity causes pollution to increase. In contrast, renewable energies as expected have negative (favorable) impacts on the reduction of CO2 emissions. To complement the imbalance of the model, it is corrected by about 0.25% from one year to the next, indicating that the economies of these countries converge to their long-term equilibrium.Therefore, based on the aforementioned empirical results, some important political actions and measures must be taken to reach a consensus between electricity production, economic growth, and environmental protection taking into account the sources of energy available to these countries. In this context, we can highlight some policy implications:
Firstly, developed countries are constantly adapting from a technological point of view, seeking to obtain greater efficiencies and better performances in the generation and consumption of electric energy due to their demanding economy, mainly to meet the growing demand for electricity. However, some factors observed are that the generation of electricity from the renewable energy matrix is not yet competitive in relation to hydroelectricity and fossil electricity. In particular, this is relevant due to the economic implications of a sudden change in the energy matrix from (fossil) to (renewable) - wind, photovoltaic, and biogas, etc., - this challenge is huge and requires a large amount of investment for both the implementation of new plants of these new energies and for the continuous improvement of energy efficiency that is sometimes difficult to obtain and monetize. Otherwise, these countries will not change their energy production strategies to neutralize and/or decrease the use of conventional energy at the expense of promoting clean energy.
Therefore, these countries have the challenge to find the safest way to protect their well-being and environmental qualities, through clear and rigid regulations so that not only government effort is preponderant. But, also the involvement of the private sector to assume its share of responsibility in the problem of climate change and to contribute to sustainable development. In relation to the current state, it is extremely important that there is a priority for a possible reform of the support conditions for fossil fuels, with a change in the countries’ fiscal priority for the production of renewable energy. Although this effort may face visibly incompatible political agendas for economic growth, austerity, rising costs, and environmental quality. The effort to consolidate high-income economies into financial flows to address the challenge of these countries to an integrated economy based on the implementation of policies to mitigate pollution and climate change is potentially attractive.
In addition, efficient and energy-saving technologies should provide better performance for models of electricity production and consumption. In this regard, given the different structural and economic realities from country to country and panel. The conflict is how to accommodate or meet the needs for economic growth with lower levels of CO2 emissions. In other words, how to guarantee the reduction of environmental degradation with levels of development and sophistication of the economy, by replacing cheaper energy sources - conventional ones, with more expensive energy sources and with better environmental performance, in this case, - currently renewable ones. Thus, the global commitment to increase energy production from clean sources is a great challenge for these economies, and this will only be successful if these countries have confidence in renewable sources. Otherwise, the replacement of the energy matrix as a goal to leverage the reduction of fossil energy generation will continue to depend on the imposition of international treaty policies.
Finally, in parallel, the combination of clean energy sources and the reduction of CO2 emissions will depend on whether these countries can improve pollution mitigation strategies. Especially when the combination is with sustainable development and in this case, the decisive support of investing in the renewable energy mix is a big dilemma and has no simple solution, because the pollution itself destroys more than giving it benefits in terms of growth and income to face the seriousness of environmental degradation to the current climate system. However, in addition to implementing more efficient electricity consumption structures, it is necessary to engage and raise awareness among policymakers, governments, and the people of these countries.
It is necessary, for example, that concrete actions continue on their way and reach their goals, that convince countries, companies, and other blocking forces that the determined commitment to renewable energies is a strong strategy not only to meet the goals of reducing levels of GHG emissions with the consequent blockade of global warming based on sustainable development. In addition, the abundance or even the predominance of one type of electricity source can hinder the diversification of a national energy matrix from country to country and can be reconciled with the efficiency of electricity consumption already developed by these countries.
The support of the CAPES Foundation of the Brazilian Ministry of Education, Brazil. Project BEX 0013/13-7/2013 is enormously appreciated