Harnessing Trees’ Transpiration Water for Ensuring Water Security in Semi-Arid Tropics: An Innovative Approach
Vegetation water transpiration is one of the important physiological phenomenons and approximately 99-99.50% of total water absorbed by plants is transpired into the atmosphere. As plants transpire large quantity of water absorbed from the soil, and this water is subsequently recycled to land in the form of rain. But the uncertainty and unequal distribution of rainfall throughout the globe led researcher to explore alternate source of water. Hence, an innovative research was conducted to harness transpiration water from different trees in the semi-arid region of Gujarat state of India. This technique was executed by using improvised plastic material to harness transpiration water from five tree species namely; Azadiractha indicai, Prosopis cineraria, Syzygium cumini, Eucalyptus hybrid and Achras sapota. Our results showed that the highest amount of transpirational water per branch was harvested from Azadiractha indicai, followed by Eucalyptus hybrid, Syzygium cumini, Prosopis cineraria and minimum from Achras sapota, respectively. Although this transpiration water harnessing technique was experimented at small scale, yet the result obtained was quite impressive. Once this technique becomes successful at large scale then surely global water scarcity problem can be resolved to some extent, especially during the difficult times of mankind survival in drought prone areas.
Keywords: Transpiration; Trees; Water Harvesting; Survival; Scarcity
Water is the most critical natural resource on this earth which overrides all the social and economic activity. Achieving water security is currently the most important environmental challenge to the researcher and policy planner. Further climate change is expected to exaggerate this problem by causing erratic and unpredictable weather, which could drastically diminish the water supply from the rainfall, rivers and glaciers [1]. Eventually, global water scarcity is expected to become a leading cause of international political conflicts in the future [2].
The uncertainty and unequal distribution of rainfall throughout the globe, led researchers to explore about new water harvesting techniques for meeting the water scarcity, rather than depending completely on the seasonal rainfall and existing water resources [3]. However, there are number of rain and underground water harvesting techniques available, even despite this water scarcity problem still exist, which shows urgent need to develop new water harvesting techniques to meet demand of water on the earth. Further in arid and semi-arid tropics the situation is worsened and people strive to meet their day to day requirement of potable water for their survival [4].
So far today no research has been conducted on possibility of harvesting transpiration water from trees throughout the world for ensuring water security. As a result, presently no dataset and technique are available for field studies on harvesting transpiration water, although research to quantify amount and rate of transpiration has been published world-wide [5,6]. Most of the previous studies used combinations and comparisons of methods, coupled to biophysical models to estimate transpiration [7]. Hence, an innovative and immediate solution was explored to harness the transpiration water from standing trees, because only a small amount of water is used by plants for carrying out physiological process necessary for growth and developments, and approximately 99-99.50% of total water absorbed is lost into the atmosphere. At the ecosystem scale, transpiration accounts for 61% of evapotranspiration and returns approximately 39% of incident precipitation to the atmosphere, creating a dominant force in the global water cycle [8]. In this direction a study was undertaken on possibility of harvesting transpiration water from the trees. The experiment was conducted using an improvised material to estimate the quantity of transpiration water from different trees available in the region. The objective of the research was to devise an innovative technique to harness the transpiration water and to estimate the water yield.
This study was conducted during April, 2014 at ICAR-IISWC, Research farm Vasad, Anand, Gujarat, India (22° 45’ 69” N and 73° 07’ 93” E) located at 32.91 m above mean sea level. Five tree species namely Azadirachtha indica, Prosopis cineraria, Syzygium cumini, Eucalyptus hybrid and Achras sapota were selected with three replications each to examine the possibility of harvesting transpiration water from leaves during three days period. Leaf area was estimated by taking dimensions, while numbers of branches were counted manually. Tree density per hectare was calculated by dividing number of individual of a species to distance between the plants.
To observe the effect of climate characteristics, meteorological data were recorded to analyse its relationship with water yield. Climatic data recorded during study period is presented in Table 1. The sunshine hours and humidity recorded during study period ranged from 8.40 h to 10.50 h and 34.30 % to 45.80 %, respectively. Similarly, maximum and minimum temperature recorded was ranged from 37.0 °C to 39.6 °C and 16.2 °C to 20.8 °C, respectively. Evaporation in open was ranged from 5.90 mm to 6.50 mm. During the study period there was one rainy day with 4mm rainfall on 21st, April, 2014. The greater temperature, and lesser humidity and rainfall were due to the prevailing climatic conditions peculiar to the region (Table 1).
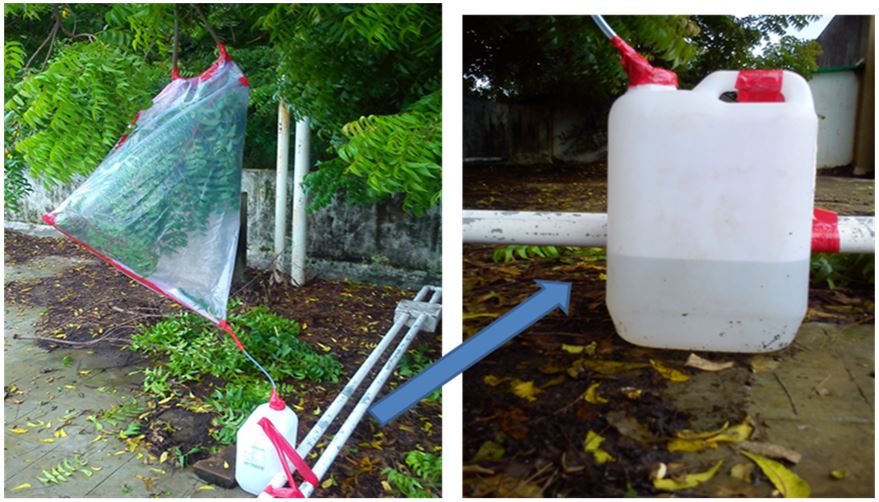
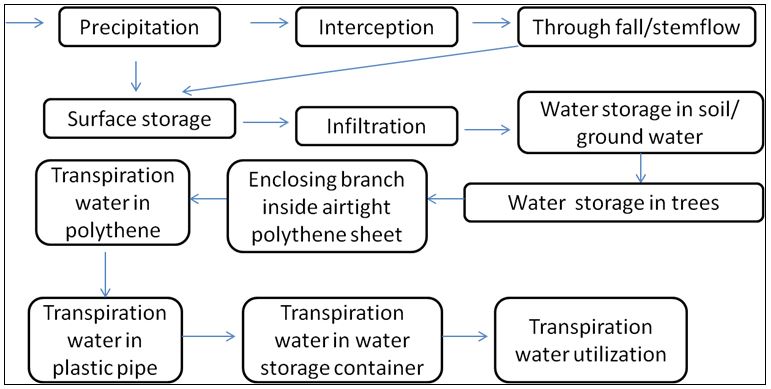
Technique of harnessing transpiration water:A transparent airtight rectangular polythene sheets of 1m x 0.5m x 0.5m sized having 125 micron thickness was used for the study. A medium sized branch in each tree was selected and kept enclosed inside polythene sheets to discontinue exchange of air between leaves and outside environment (Figure 1). A pipe was fixed at the lowest point of hanging polythene sheet, which opens in a water storage container to collect the condensed transpired water. All condensed water inside polythene sheet was accumulated in water storage container. The source of transpiration water and its movement is shown in Figure 2.
Calculation of Water Quantity: Whole tree water harvesting potential was calculated by multiplying the amount of actual water harvested from a branch with number of branches and calculated using the following formulae;

Where, wt is water harvesting potential per tree, n is totalling number of branches and b is the amount of water harvested from its branch. As different species have different potential to give transpiration water, so species wise water harvesting potential was calculated using following formulae;
Where, ws is the water harvesting potential per species per hectare, k is total number of trees of species and wt is the amount of water harvested from kth tree. Water harvesting potential per hectare was calculated using following formulae;
Where, Wh is the water harvesting potential per hectare and l is total number of species per hecatre.
The analysis of variance was performed using the general linear model (GLM) procedure of the statistical software SPSS version (10) for windows. Tukey’s HSD test was performed to determine possible differences between means (p ≤ 0.05) for various parameters [9].
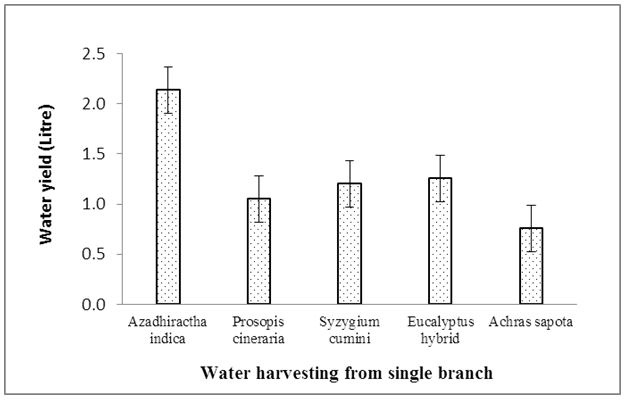
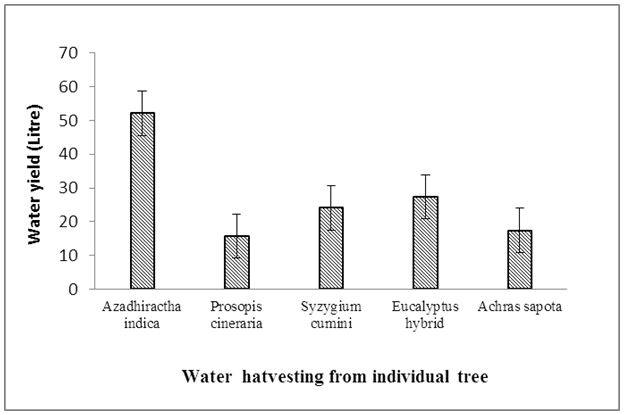
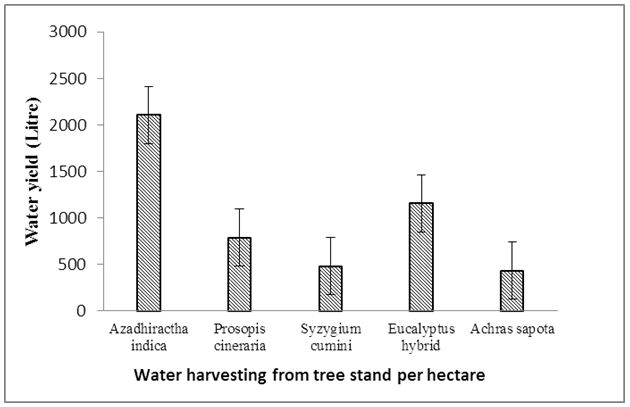
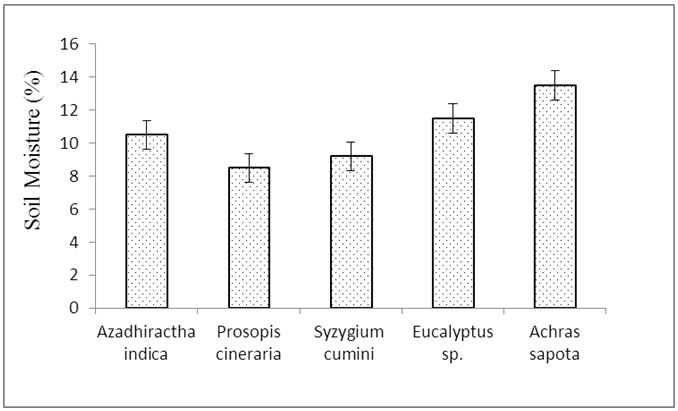
The various plant characters studied are presented in Table 2. Leaf area, number of branches per tree and tree density per hectare were recorded significantly higher for Syzgium cumini (9.97), Azadiractha indicai (25.0) and Prosopis cineraria (50.0), respectively. Among the values compiled for all the trees in Figure 3, yield of transpiration water harvested per branch was ranged from 2.10 L to 0.75 L in three days period during the month of April. Species wise data showed that significantly highest amount of water per branch was harvested from Azadiractha indicai, which was followed by Eucalyptus hybrid, Syzygium cumini, Prosopis cineraria and Achras sapota, respectively (Table 2). When whole tree was taken into consideration, significantly highest transpiration water yield was computed for Azadiractha indicai followed by Eucalyptus hybrid, Syzygium cumini, Achras sapota and Prosopis cineraria, respectively (Figure 4) (Using equation1). Total transpiration water harvesting potential computed from tree stand on per hectare basis was ranged from 431 to 2100 L (Using equation 2 and 3). In the entire experiment significantly highest and lowest values of water harvesting potential per hectare was computed in Azadiractha indicai and Achras sapota, respectively (Figure 5). In other case, soil moisture (0-30 cm depth) under different species recorded and 9.50 % to 13.50 %,respectively (Figure 6). The maximum transpiration water was harnessed from Azadiractha indicai because of its large size and deep roots systems. However, transpiration water harvesting potential of a tree species depends upon many factors viz. climatic, topographical and edaphic factors and season of the year and nature of tree (evergreen, deciduous, tropical, temperate etc), tree age, number of stomata per leaf, presence of cuticle and other modified structures or adaptations to reduce transpirations like phyllodes, needle, thorns etc [10].
The harvested transpiration water can be used as potable water in semi arid tropics even for survival in difficult times. Although the quantity of water harvested may be insufficient, but a better mechanism of transpiration water harvesting can be developed for getting higher quantity of water from trees for domestic and other uses. This non destructive approach ignores the potential effect of air tight polythene sheets on physiological functions of plants. Negative effect of air tight polythene sheets on physiology of plants can be ruled out as same trees are not to be kept with attached devices for more than 48 hours during study periods. Moreover, Transpiration is a major determinant of local microclimate and rainfall of a region [9]. Furthermore, vegetation transpiration accounts for 60–80% of evapotranspiration on land surface, there is no doubt that terrestrial vegetation is one of the dominant force in the global water cycle and that need to harnessed.
From present findings it can be concluded that transpiration water can be source of water supply for mankind survival in arid and semi arid tropics during the time of water scarcity. Repeating the process of harnessing transpiration water continuously from same tree may adversely affect the health of trees besides having certain environment implications, like altering water cycle and reduction of total global rainfall. Although it’s only initiation of new research in the direction of transpiration water harvesting, researcher have long way to go before some decisive and logical conclusions are made. Once this technique becomes widespread at large scale then global water scarcity problem can be resolved to the some extent.
Authors do not have any conflict of interest.