Hepatobiliary Alterations in Ulcerative Colitis: A Report from a Tertiary Care Centre in Odisha
Background and Aim:Hepatobiliary manifestations are amongst the most important extra intestinal manifestations in chronic ulcerative colitis patients. There is paucity of data on hepatobiliary alterations in ulcerative colitis patients from India. The study was carried out to evaluate the hepatobiliary alterations in ulcerative colitis patients admitted to a tertiary care center in Odisha.
Methods:Consecutive patients of Ulcerative colitis admitted to Gastroenterology Department SCB Medical College, Cuttack from 0ct 2013 to April 2015 were included in the study. Patients with history of liver diseases were excluded. All patients were subjected to clinical examination, liver function tests and ultrasonography for evaluation of hepatobiliary alterations. MRCP was performed in selected patients. Controls were recruited from healthy subjects (n=100).
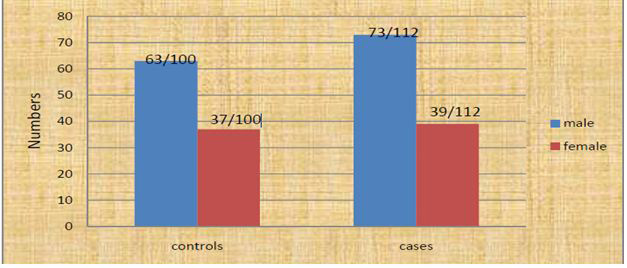
Results:A total of 112 patients [73(65.1 %%) male; 39(34.9%) female] with ulcerative colitis were included. The mean age and BMI were 40.2±14.01years and 21.3±3.5kg/m2 respectively. Patients with mild, moderate and severe disease activity were 22(19.6%), 67(59.8%) and 23(20.5%) respectively. The median duration of illness was 24 months (IQR: 6.5-48). Extra intestinal manifestations were found in 68 patients (60.7%). 40(35.7%) patients had arthralgia, 6(5.3%) had arthritis, 13(11.6%) had episcleritis,2(1.7%) had stomatitis, 3(2.6%) had Erythematic Nodosum, 1(0.9%) had pyoderma Gangrenosum. 60(53.8%) patients developed hepatobiliary alterations. 2(1.7%) had jaundice, pruritus and clay colored stool in whom MRCP revealed primary sclerosing cholangitis. 22(19.6%) had hepatic steatosis, 42(37.5%) had asymptomatic transaminitis, 17(15.1%) had elevated alkaline phosphatase and 67(60%) had hypoalbuminmia. In control groups 17(17%) had hepatic steatosis, 28(28%) had transaminitis, 8(8%) had elevated alkaline phosphatase.
Conclusion:The study revealed that approximately 61% of Ulcerative colitis patients had extra intestinal manifestations. Hepatobiliary alterations are the most common (53.5%) extra intestinal manifestations in Ulcerative colitis and asymptomatic transaminitis is the most common hepatobiliary alterations in the patients with Ulcerative colitis in the present study.
Keywords: Inflammatory bowel disease (IBD); Chronic ulcerative colitis (CUC); CRP (C-Reactive protein); Primary sclerosing cholangitis(PSC); Autoimmune hepatitis (AIH);ALT(Alanine transaminase) Autoimmunesclerosingcholangitis (ASC); ALP (Alkaline transferase); Gamma Glutamyl Transferase (GGT); PANCA(peri nuclear anti neutrophilic antibody); Ulcerative Colitis Disease Activity Index (UCDAI); EIM (Extraintestinal manifestations); Pyoderma Gangrenosum (PG); Erythema Nodosum (EN); ASA (Aminosalysilic acid)
Ulcerative colitis (UC) is an idiopathic, chronic-relapsing progressive, inflammatory bowel disease. The inflammatory process is limited to mucosa. Ulcerative colitis affects the distal rectum and extends for varying distances proximally. Clinically, it manifests most often through diarrhoea, blood and/or mucus in stools, tenesmus, abdominal pain and weight loss. The explicitness of intestinal symptomatology depends on the level of inflammatory process that is the activity of the disease. By complementary analysis of clinical symptoms and signs, as well as laboratory parameters, it is possible to clinically grade UC activity as mild, moderate and severe. Activity assessment has therapeutic and prognostic significance [1,2]. Chronic ulcerative colitis (CUC) though chiefly effects the gastrointestinal tract, is frequently associated with wide array of extra intestinal manifestation (EIM), the incidence of which varies between 25% and 36% [3-5]. Hepatobiliary manifestations are amongst the most common EIM associated with inflammatory bowel disease (IBD) They not only complicate the management of the primary disease but also contribute significantly to mortality and morbidity [5]. Even before CUC was recognized as a clinical entity, fatty liver changes with diffuse colonic ulceration were described as early as 1874 by Thomas who was confirmed by Lister in 1889 who reported a patient with CUC and secondary diffuse hepatitis. Further evidence of association between CUC and hepatic involvements emerged from an autopsy study [6-8]. In 80% cases EIM appear after the development of UC clinical symptoms and signs, in 10% they begin synchronically whereas in the remaining 10%, they precede clinical manifestations of the basic bowel disease. With their symptomatology, they can conceal the existing bowel disease and, at one point, become dominant disorder [2,9-11]. In the last 50years, extensive literature has shown that the existence of one EIM increases the risk of the development of other EIM [11]. Although the prevalence of hepatobiliary disease in patients with IBD varies widely in different series from 2%-95%, clinically significant liver disease occurs in only 5%-10% of patients [12]. Such a discrepancy between the various series occurs because of a number of factors which include (a) on aggressively diagnostic studies are pursued; (b) the number of patients included with mild, moderate and severe disease; (c) whether the disease was active or in remission and (d) the type of bowel involvement i.e., extensive or limited. There is no consistent temporal relationship between the onset of symptoms and hepatobiliary abnormalities [13]. Hepatobiliary involvement in ulcerative colitis is a spectrum that ranges from transient abnormalities in laboratory values (asymptomatic transaminitis), to liver diseases that can require transplantation. Hepatobiliary diseases associated with IBD include Primary sclerosingcholangitis (PSC), autoimmune hepatitis (AIH) and autoimmune sclerosingcholangitis (ASC, an overlap syndrome in which features of both PSC and AIH are detected on laboratory, histological and cholangiographic investigations). Medications used in IBD treatment can also cause significant hepatotoxicity, and thus require close monitoring during their administration. Other hepatobiliary manifestations reported in the IBD literature include cholangiocarcinoma, cholelithiasis, hepatic abscess, hepatic or portal vein thrombosis, fatty liver, and amyloidosis. Because the etiologic and pathogenesis of UC and the associated. Hepatobiliary complications remain elusive and speculative in the large part, and the hepatobiliary complications are on the rise [14-16]. It is important to find out if such increase rate of complications is seen inpatients of ulcerative colitis in our setup and to determine the features related or unrelated to the disease process leading to development ofsuch complications. Again there is paucity of data available on prevalence of hepatobiliary manifestations in ulcerative colitis patients in Indian scenario. Hence the present study is aimed to evaluate the hepatobiliary alterations in ulcerative colitis patients referred to a tertiary care centre in odisha.
This Study was conducted prospectively on adult patients above the age of 18 years, attending the outpatient department as well as admitted as indoor patients in the department of Gastroenterology, SCB Medical college hospital, Cuttack from Oct-2013 to Oct-2015. Controls were recruited from healthy subjects.
Consecutive patients with confirmed diagnosis of ulcerative colitis were included in the study. Controls were recruited from healthy subjects. The diagnosis of ulcerative colitis was done by the presence of following criteria: A history of diarrhoea or blood in stools for more than 4 weeks, macroscopic appearance by colonoscopy, microscopic features on biopsy compatible with the diagnosis of ulcerative colitis and no suspicion of crohn΄s disease on small bowel radiology, ileo-colonoscopy and biopsy.
The patients with following conditions were excluded from study 1) Patients with Crohn’s Disease. 2) Alcohol consumption of ≥ 20gm/day and alcoholic liver disease 3) Positive Hepatitis B surface Ag (HBSAg 4) Positive antibodies to Hepatitis C virus (Anti HCV antibody) 5) HIV infection 6) Positive Alpha-1 AT deficiency 7) Wilson disease 8) Diabetes mellitus 9) Use of Hepatotoxic drugs such as Anti tuberculosis therapy, Methotrexate, Tamoxifen etc. and indigenous drugs. 10) Clinical, Imaging or liver biopsy features of cirrhosis of liver 11) Patients with other systemic illness like extensive cardiac or pulmonary disease, autoimmune diseases like systemic lupus erythematous, Rheumatoid arthritis, Systemic sclerosis, Autoimmune hepatitis, Primary biliary cirrhosis were excluded from the study. All the patients were explained thoroughly about the study. Those who signed or gave informed consent were included in the study. Relevant clinical and demographic information in all ulcerative colitis patients were collected by questionnaire such as: Gender, age at diagnosis, familial aggregation, smoking, dietary habits, history of gluten Sensitivity, disease evolution, extension, extra intestinal manifestation, medical or surgical treatment and clinical course of disease. All patients included in the study had to undergo complete blood count, liver function test, ESR, CRP, serum protein, albumin globulin ratio, urea and creatinine. Electrolytes stool routine, microscopic and occult blood test and chest x-ray. The prevalence of abnormal liver biochemistries (as defined by any elevation of serum AST, ALT and/or ALP above upper limit of normal i.e AST>40 U/ml, ALT > 40 U/ml, ALP > 360 U/ml) was determined amongst the study population. GGT was estimated in all patients having raised ALP to determine hepatic source of raised ALP and GGT value > ULN were taken as confirmatory. The Liver function Test (LFT) abnormalities we reconsidered transient if the liver enzymes returned to normal level within a period of 3 months during follow up. Patients, who had abnormal LFTs, repeat LFTs done every 3 months. If LFTs didn’t normalise and the values were persistently abnormal the highest values of LFTs were taken into consideration. All patients with abnormal liver biochemistry underwent abdominal USG examination and subsequently MRCP, particularly in patients having persistent elevation of ALP for more than 3 months. All patients with a persistent rise in transaminase activities and without a previously established hepatobiliary diagnosis were examined with conventional laboratory tests and questioned regarding intake of alcohol or drugs and exposure to other hepatotoxic agents. Laboratory tests including assessment of serum GGT, calcium. Serum ceruloplasmin, ferritin, pANCA were assessed in selected cases. Immunofluorescence analyses of smooth muscle antinuclear and anti-mitochondrial antibodies were made in selected cases. Serological tests for Hepatitis B and Hepatitis C and HIV were done routinely. Abdominal ultrasonography was done in all patients. In those patients having inconclusive imaging findings and laboratory investigations, liver biopsy was planned after taking informed consent. The Montreal classification of disease extent of ulcerative colitis was used in all patients. The activity of disease was calculated using Ulcerative Colitis Disease Activity Index (UCDAI) (Southerland Index), which consists of four parameters such as stool frequency, rectal bleeding, mucosal appearance and physician´s rating of disease activity. All patients were followed up 3 monthly. The clinical details including the complications, treatment were recorded as per the specified proforma prepared for the study. The treatment principles were generally homogenous therapy with combination of Mesalamine, Folic acid, Proton pump inhibitor and Prednisolone (for moderate to severe UC) for out-patients. Patients who had severe disease and required hospitalization were treated with parenteral steroids (Hydrocortisone succinate) initially along with antimicrobials – ciprofloxacin and metronidazole. In case of failure of medical therapy, the patients were evaluated for surgery. Patients were followed-up for their disease course and relapse of the disease, or complete remission or Steroid dependant or steroid resistant pattern were documented. Complete remission was defined as clinical improvement with absence of symptoms of active disease (rectal bleeding, stool frequency) with endoscopic appearance of grade 0 or 1, [grade-0 normal mucosa, 1-granular oedematous mucosa with loss of vascular pattern, 2-bleeding to light touch, 3-spontaneous bleeding]. Relapse was defined as worsening of symptoms recognized by the patients (rectal bleeding, loose stools and bowel frequency) with endoscopic appearance of active colitis (granularity, friability and/or spontaneous bleeding) in previously remitted patients. Patient with UC was defined as steroid dependant if glucocorticoid cannot be tapered to less than 10mg/day within 3 months of starting treatment without recurrent disease or if relapse occurs within3 months of stopping glucocorticoid therapy. Patients who do not have meaningful clinical response to glucocorticoid up to a dose of prednisolone 40-60 mg/day within 30 days of oral therapy or 7-10 days of IV therapy were said to have steroid resistant or refractory ulcerative colitis.
The normally distributed variables were expressed as mean ± standard deviation (SD) or frequency (in percentage). The non-parametric data were expressed as medians and inter-quartile range. The normally distributed quantitative and categorical variables were compared using student’s t test and chi square test respectively. The non-parametric unpaired data were compared using Mann Whitney U test. A p-value of <0.05 was considered statistically significant. Multivariate logistic regression analysis was done for analysis of risk factors for hepatobiliary manifestation of ulcerative colitis. All the data were analysed by using the Statistical Package for Social Science (SPSS) version 16.0 for windows.
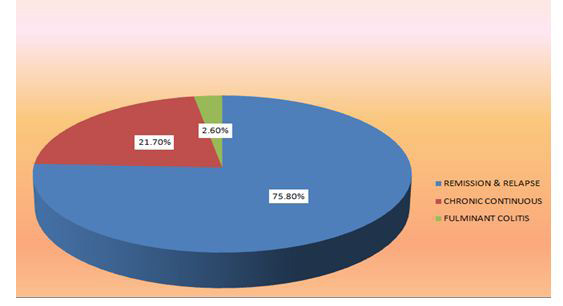
The study population consisted of 212 individuals, of which 112were confirmed case of ulcerative colitis (cases) and 100 were healthy controls. Of the total 112 patients with ulcerative colitis, 73 (65.1%) were males and 39 (34.9%) were females with male to female ratio1.8:1 (Graph 1). The average age was 40.26±14.01 years. The youngest patient was 18 year and oldest patient was 80 year of age. (Table 1, Table 2 and Table 3). Majority of study populations were Hindu i.e. 96.4% in cases and 90% in controls respectively. 100 (89.3%) of the 112UC patients were non- vegetarian and the rest of the 12 (10.7%) patients were vegetarians. On the contrary in the controls 81% and 19% were non-vegetarian and vegetarians respectively. Of the 112 UC patients only 8 (7.1%) were smokers and among the controls 20 (20%) were smokers. Sensitivity to gluten rich diet was found in 8(7.1%) UC patients and 6 (6%) healthy controls (Table 4). Of the 112 UC patients, 4.46% had family history of ulcerative colitis. The average duration of symptoms prior to diagnosis of UC was 6months in males and 4 months in females (1-48 months, IQR: 2-12months) with average duration of illness 24 months(1-240 months, IQR: 6-48 months) in both sex (Table 2). 66 UC patients (58.9%) had duration of less than 2 years, 30 (26.7%) had 2-5 years, 11 (9.8%) had5-10 years and 5(4.4%) had disease of more than 10 years. Disease duration is prolonged in males in compared to females (Table 5). On the basis of criteria of Ulcerative Colitis Disease Activity Index or Sutherland Index, 22 UC patients (19.6%) had mild disease, 67(59.8%) had moderate disease and 23 (20.5%) had severe disease activity with mean MAYO score was found to be 7.96±2.1(Table 6). Based on the extent of disease manifestations 56 (50%) hadpancolitis, 28 (25%) had left sided colitis, and 28 (25%) had proctitis at the time of presentation (Table 7). Majority of the patients presented with intestinal symptoms like chronic diarrhoea (n=110) and/or rectal bleeding (n=109). Extra intestinal manifestations found in 68 (60.7%) of112 UC patients. Hepatobiliary alterations were evident in 60 (53.5%), Arthralgia in 40 (35.7%), Peripheral arthritis in 6 (5.3%), Episcleritis in 13 (11.6%), Stomatitis in 2 (1.7%), Skin manifestations in 4 (3.5%) patients in the form of Pyoderma Gangrenosum (PG) in 1(0.9%) and Erythema Nodosum (EN) in 3 patients (2.6%) (Table 8). 42 patients (61.7%) had one extra intestinal manifestation whereas remaining 26(38.3%) patients had two or more extra intestinal manifestations. Of the 112 ulcerative colitis patients, 60 (53.5%) developed hepatobiliary alterations in the form of Primary Scleroging Cholangitis (PSC) in 2 (1.7%), Transaminitis in 42 (37.5%), Elevated Alkaline Phosphatase (ALP) in 17 (15.1%), elevated GGT in17 (15.1%) and Fatty liver in 22 (19.6%) patients. On the contrary in the control groups 28% had Transaminitis, 8% had elevated Alkaline Phophatase, 7% had elevated GGT & 17% had fatty liver (Table 9). 51 patients (76%) developed extra intestinal manifestations after diagnosis of UC, whereas 10 patients (15%) developed extra intestinal manifestations synchronically and 7 patients (9%) had manifestations before the diagnosis of ulcerative colitis. Primary Scleroging Cholangitis (PSC) in 2 patients were diagnosed due to presence of cholestatic features like pruritus, jaundice and elevated ALP with MRCP showing alternate stricture and dilatation in both intrahepatic and extra hepatic biliary radicles with beaded appearance. During follow-up 35 (83.3%) of 42 patients had transient transaminitis i.e Transaminase levels normalised within 3 months whereas 7 (16.7%) of 42 had persistently abnormal transaminitis. 17 patients had elevated ALP, out of which 14 (82.3%) had transient elevations whereas the rest 3 patients (17.7%) had persistent elevations. On univariate analysis risk factors associated with hepatobiliary alterations were severity of ulcerative colitis, and course where as in Multivariate analysis risk factors were severity of ulcerative colitis and response to various treatments like Mesalamine, corticosteroid and Azathioprine., whereas age, sex, duration of illness, colonic extension, smoking and other extra intestinal involvement were not associated as risk factors for hepatobiliary alterations in patients with ulcerative colitis in the present study (Table 10 and Table 11). 85 patients (75.8%) had episodic diseases with remission and relapse, 24 patients (21.4%) had chronic continuous course and 3 (2.6%) patients presented with acute fulminant colitis requiring surgery at the time of presentation (Figure 2). During follow-up 52 patients (46.4%) had more than 2 relapses per year and 10 patients (8.9%) had chronic relapsing course (more than 5relapses per year), 15 patients (13.3%) remained in remission for more than 1 year. 3 patients (2.6%) developed toxic mega colon, 1 patient(0.9%) developed perforation, 2 patients(1.7%) developed dyselectrolytemia in the form of hypokalaemia, hypomagnesaemia and hypocalcaemia. During follow up, skin manifestations of 4 patients (EN- 3 patients, PG-1 patient) disappeared within one month of treatment with ulcerative colitis, suggesting the fact that skin manifestations in ulcerative colitis could be in parallel with the disease activity in ulcerative colitis in the present study. 48 patients (42%) responded initially to Mesalamine, 51 patients (45.5%) responded to Mesalamine with corticosteroid, whereas 4 patients (3.5%) became steroid dependant and they were maintained with Azathioprine. 4 patients (3.5%) refractory to medical therapy underwent proctocolectomy (Table 12). 5 patients (4.46%) died, out of which 3 patients had toxicmegacolon and 2 patients presented with fulminant colitis. In our study during follow up though 46.4% patients had more than two relapses/year and 8.9 % patients had more than five relapses/year, only 5% patients had developed Hepatobiliary manifestations during relapse of disease activity. During follow up for two years, 83% patients had progression free survival and overall survival of patients is 95% and 5% patients died of complications like toxic megacolon and fulminant colitis.
Ulcerative colitis is a common disease in most of the industrialised countries in the world. The highest incidence is reported from Scandinavian countries and Scotland followed by England and North America [17-19]. It was thought to be uncommon in the developing countries [20-22]. In India the diagnosis of ulcerative colitis is made with some diffidence on account of high incidence of dysenteric disorders. Though the reported incidence in India is 9-10 per10, 000 hospital admission by Chuttani, et al. and 1.3% in patients attending Gastroenterology clinic in India, the present study showed ulcerative colitis in 1.35% patients admitted to Gastroenterology Department, SCB Medical college Cuttack, Odisha [23,24]. The reason for the reported low incidence in literatures is either the non-availability of adequate diagnostic measures or rampant prevalence of specific viral diarrheal diseases and dysenteries which mask UC in our population. Ulcerative colitis is a common disease in most of the industrialised countries in the world. The peak age for UC occurrence is 25-34 years of age (Shivananda, et al. 1996). Some studies have reported a second peak of incidence in UC at the age of 60-70 years (Bernstein, et al. 2006). In the present study. The average age of patient was 40.26±14.01 years. The youngest patient was 18 year and oldest patient was 80 year of age.
UC is slightly more common in men than in women, especially in the age groups after peak incidence (Shivananda, et al. 1996).However epidemiological study conducted by Sivaram Gunisetty, et al. 2008 in south of India showed males and females were equally affected in UC which was in line with those reported by Langan, et al. but study by Ajit Sood, et al. in a North Indian hospital showed males were affected slightly more than females, the ratio being 1.04:1. Similarly the present study showed males were affected slightly more than females, the ratio being 1.8:1 [21,25]. In the present study 96.4% patients found to be Hindu, the rest3.6% patients are Muslims, but religion was not found to be risk factor for UC in present study (p=0.059). In the present study 89.3% patients took non-vegetarian diet and 10.7% patients took vegetarian diet. However such dietary difference in study population was not found to be a predisposing factor for UC (P=0.088), similar to study conducted by Sivaram Gunisetty, et al. (2008). Active tobacco smoking has been recognised as one of the most prominent protective factors against UC and ex-smokers have an increased risk of UC The present study found UC to be more prevalent among non-smokers than smokers for development of UC (92.9% vs7.1%, p= 0.005). These findings are well in line with the study done by Lindberg E, et al. one of the reasons attributed to this may be nicotine which increases mucin synthesis in colon and rectum in UC patients and hence may impart protection to the epithelium [26,27]. Many prospective studies have already demonstrated that patients with UC, who avoid gluten rich food products have less number of relapse per year, and exposure to gluten significantly increases the number of UC relapse, as demonstrated by Gillberg, et al. However present study showed 7.1% patients (cases) were allergic to gluten rich diet compared to 6% healthy controls and this was found to be statistically insignificant (p=0.735) [28]. When these patients were followed with gluten restricted diet, the disease course was not influenced and duodenal biopsy and TTG results of such patients were inconclusive. In the present study 4.46% patients had family history of UC which is in accordance with the study by Peeters, et al. [29]. In the present study The average duration of symptoms prior to diagnosis of UC was 6 months (1-48 months, IQR: 2-12months) with average duration of illness 24 months (1-240 months, IQR: 6-48 months),and 66 patients (58.9%) had duration of less than 2 years, 30 (26.7%) had 2-5 years, 11 (9.8%) had 5-10 years and 5 (4.4%) had disease of more than 10 years. A study by Sood A, et al. from a north Indian hospital showed the average duration of symptoms prior to hospital entry was 2.7 Years, with 48.34% patients had disease duration of less than 2 years, 25% had 2-5 years, 18.34% had 5-10 years and 8.34% had disease of more than 10 years [21]. The delay in diagnosis in our patient may be due to lack of awareness about the disease amongst the patient as well as empirical treatment by primary care physician in the locality without prompt referral and few patients hesitate to attend hospitals for rectal bleeding due to social and cultural reasons. In the present study the disease activity was moderate in majority of patients (59.8%), severe in 20.5% patients with mean MAYO score7.96±2.1, a pattern which is contrary to the belief that UC in India runs mild course [30]. This may reflect a changing pattern of the disease here. This pattern is quite similar to one reported by Sivaram Gunisetty, et al. in a epidemiological study in south of India showing 60.5% patients had moderate UC and 39.4% had severe UC with mean MAYO score 8.3 ± 1.7. Half of the patients in the present study had pan colitis (50%), with left sided colitis in 25% and proctitis in 25% patients. This is in accordance to the Indian Task Force data, 18%, 38% and 42% of 724 patients with UC had Proctitis, Left side colitis and Pancolitisrespectively. 29 Similarly Walker et al reported that 63% of south asian patients with UC are pancolitis compared with 42.5% of the indigenous European population (p<0.0001) [31]. In the present study Extraintestinal manifestations were present in68 (60.7%) UC patients. Various authors report different values for the occurrence of extra intestinal manifestations in UC making it is somewhat difficult to identify the most prevalent extra intestinal manifestations. The prevalence of these manifestations in the study of Das, et al. is 21% Study by Ozdil, et al. 2004 showed approximately 42% of UC patients had extra intestinal manifestations [32]. Gumaste, et al. analysed group of 1274 UC patients and diagnosed extra intestinal manifestations in 21 patients it has been noted that extra intestinal manifestations prevalence is significantly lower in Asia and Africa, in contrast, the present study showed higher prevalence [33-35]. Whether different geographical area is having varying dietary, environmental and other factors have anything bearing on the development of extra intestinal manifestations still not known. In the present study 76% patients developed extra intestinal manifestations after diagnosis of UC, whereas 15% developed synchronically and 9% before diagnosis of UC, similar to study by Biljana Radovanovic-Dinic, et al. which showed 77% patients developed extra intestinal manifestations after diagnosis of UC where as 9% synchronically and 14% before diagnosis of UC. In the present study Peripheral arthritis/arthralgia is the second (41%) most common extra intestinal manifestations next to Hepatobiliary alterations (53.5%). However in the study by Tromm, et al. arthritis was the most frequent (28.8%) associated extra intestinal manifestations [36]. In the present study the clinical course of peripheral arthritis paralleled UC activity, as effective therapy of UC was associated with the remission of both UC and peripheral arthritis. The present study showed ocular manifestation in the form of Episcleritis in 11.6% patients, which is similar to a study by Billson, et al. 1997 (9.7%). In the present study ocular manifestations followed UC activity and disappeared during UC remission. Therefore in view of significant prevalence of changes in Eyes in this study as well as in other studies, regular ophthalmic examinations in all UC patients should be mandatory. In the present study skin manifestations were present in 4(3.5%) patients in the form of Pyoderma Gangrenosum (PG) in 1 (0.9%) and ErythemaNodosum (EN) in 3(2.6%) patients [37]. This was in accordance with the study by Aresia and Garcia Esilva 1987, Evan and Pardi 2007which showed EN present in 3% patients and PG in 1.4-5% patients of UC. However in contrast to the data from literature, in the present study both EN and PG correlated with UC activity as both the skin lesions disappeared within one month of treatment of UC patients with remission. Although the prevalence of Hepatobiliary manifestations inpatients with IBD varies widely in different series from 2-95%, clinically significant liver disease occurs in only 5-10% of patients. In the present study 53.5% patients developed hepatobiliary alterations, signifying that they are the most common extraintestinal manifestations. In the present study hepatobiliary alterations were found to be more prevalent in patients with pancolitis than distal colitis (25.8% vs14.28%), although the difference did not reach statistical significance. (p=0.89) Majority of patients with Hepatobiliary manifestations in present study had moderate severe UC (46.4% vs 7.1%, p=0.03.In the present study 1.7% patients developed Primary sclerosingcholangitis (PSC). This finding is almost similar to observation in a study by Olson, et al. where out of 1500 patients of ulcerative colitis 3.7% have developed PSC [38] The outcome of PSC did not relate at all to the activity and clinical course of UC in either present study or others.238. 19.6% patients in the study had fatty liver, contrary to controls having 17% fatty liver, which was not statistically significant (p=0.486).Bargiggia et al evaluated the prevalence of fatty liver in large IBD population and found these abnormalities > 35% of UC patients, a higher prevalence than among healthy controls. The prevalence of abnormal Liver Function Test (LFT) in the present study cohort was asymptomatic transaminitis in 37.5% of cases and 28% in controls(p=0.142), Elevation of Alkaline Phosphatase (ALP)was noted in 15.1% of UC cases and 8% in control (p=0.11), Elevated Gamma Glutamyl Transferase (GGT) in15.1% of cases & 7% in controls (p = 0.10). Similarly the prevalence of abnormal LFTs in study by Maria Cappello, et al. was 20.9% in asymptomatic patients. An epidemiologic study conducted in the country of Stockholm enrolling more than 1000UC patients, followed for15years reported an 11% prevalence of altered LFT, Gisbert et al observed LFTs abnormalities in 15% IBD patients at some time during five years study [39]. In the present study 83.3% patients had transient transaminitis and 16.7% had persistently abnormal transaminitis, similarly 82.3% had transient elevated ALP and 17.7% had persistently elevated ALP. These findings were similar to a large Swedish follow up study Similarly persistent LFTs alterations were found by Schrum pf, et al. in 3-15% of IBD patients [40]. The cause of transient transaminitis and elevated ALP may be related to disease activity, use of antibiotics, corticosteroids and persistent transaminitis may be related to fatty liver, disease activity, use of ASA. The cause of persistent elevated ALP in present study mostly related to coexistence of PSC and Fatty Liver. On univariate analysis risk factors associated with hepatobiliary alterations were severity of ulcerative colitis, and course of disease, where as in Multivariate analysis risk factors were severity of ulcerative colitis and response to various treatments like mesalamine, corticosteroid and Azathioprine. Age, sex, duration of illness, colonic extension, smoking and other extra intestinal involvement were not associated asrisk factors for hepatobiliary alterations in patients with ulcerative colitisin the present study. In the present study the course of the disease was characterised by relapse and remission in majority (75.8%) with only 21.4% pursuing achronic continuous course, similar to study by Ajit Sood, et al. showing relapses ad remission in 90% with only10% had chronic continuous course [21]. In the present study it was found that, drug compliance was not strictly adhered, as patients had a tendency to omit or reduce drugs on their own once the symptomatic recovery occurred, indicating that proper awareness of the disease is necessary to ensure compliance. In the present study 46.4% patients suffered more than two relapses per year, similar to study by Ajit Sood, et al. showing 45% relapses within one year [21]. Various factors incriminated by patients as precipitating cause for relapses such as stoppage of drugs by self, emotional disturbances like family feuds, death of family members, academic Examinations, dietary factors, infections and use of other drugs. The complication rate in the present study was less (5.2%) as compared to reports 17.5% in other Indian study by Ajit Sood, et al. and 31-40% in western countries. 243 2.6% patients developed Toxic Megacolon, 0.9% developed perforation, 1.7% developed dyselectrolytemia, no patients found to have carcinoma colon [21]. In the present study majority patients responded to Mesalamine (42%) and Mesalamine plus corticosteroid (45.5%). The clinical response to glucocorticoid was very dramatic at first use of drug while patients who had chronic active disease showed less prompt response, so that in the present study 3.5% patients became steroid dependant and they were maintained on Azathioprine (AZA), while 3.5% patients became steroid refractory and underwent proctocolectomy as they could not afford for Biologicals like Infliximab. During study period 5 patients (4.46%) died out of which 3 patients had toxic megacolon and 2 patients presented with fulminant colitis.
Present Study showed Ulcerative colitis in 1.35% patients admitted to Gastroenterology Department, SCB Medical College, Cuttack, Odisha. 2/3rd patients with ulcerative colitis had extra intestinal manifestations. Hepatobiliary alterations found to be the most common (53.5%) extra intestinal manifestations in the patients with UC in the present study. Hepatobiliary alterations were more prevalent in patients with pancolitis than distal colitis. Majority of patients with Hepatobiliary alterations had moderately severe disease activity. Asymptomatic transaminitis is the most common hepatobiliary alterations in the patients with Ulcerative colitis in the present study. The study suggests that even in the absence of symptoms, hepatobiliary functions should be monitored in UC patients, given the high incidence of LFTs abnormality and patients taking ASA and immunosuppressive. Moreover most of the cases of abnormal LFTs in UC patients are mild and spontaneously returned to normal value within 3 months in close to 80% patients. However these data need to be further explored in larger prospective study. 1.7% patients in study cohort had PSC, the outcome of which did not relate to the activity and clinical course of ulcerative colitis. Severity of UC, response to various treatments like ASA, corticosteroid and AZA are correlated with the prevalence of hepatobiliary alterations in UC patients, but Age, sex, duration of illness, colonic extension, smoking and presence of other extra intestinal involvement were not shown to be the risk factors for hepatobiliary alterations in patients UC in the present study.
PKP, CRP, SPS, JN, PN, PP, KRD, SKB, SKP and HSD declare that they have no conflict of interest.
All procedures followed were in accordance with the ethical standards of the responsible committee on human experimentation (institutional and national) and with the Helsinki Declaration of 1975 as revised in 2008. We obtained informed consent from individual patients and Institutional ethics committee clearance was obtained.