Impact Response of Nano-Ferrocement Plates under Drop Weight
In the present investigation, nanoferrocement plate specimens (500x500) were cast using Nano cement mortar varying mix proportions. The plate specimens were tested under impact loads by dropping steel striker and the impact energy that causes first crack and full perforation and impact residual strength ratio, Irs, were determined. The plates were tested with all four edges simply supported. The number of wire mesh layers, plate thickness, and mix proportion were considered to be the parameters of the investigation. It was concluded that the average values of first crack and full perforation impact energies are increased when the mix proportion varying from 1:1 to 1:1.5 and the first crack impact energy is not affected by changing the plate thickness, but the full perforation impact energy is affected by thickness of plate specimens.
Keywords: Nanotechnology; High performance; Ferrocement; Impact loads
Urban development is a key consumer of energy. Green buildings must design to meet one of certain objective such as the use of energy more efficiently. A structural system based on generic services facilities is introduced by Al-Rifaie and prefabricated ferrocement cavity walls/ and roofs within the proposed system present a series of possibilities for the solution of building construction at maximum reduction of the electrical energy.
Ferrocement is recognized as a composite material of great potential made of cement- sand mortar and layers with very fine steel wire meshes. The material was found wide applications because of high tensile strength, imperviousness to water and crack free performance [1-3].
The present work is the continuity of the work carried out by the authors [4,5]. In reference, the authors present a research work to examine the mechanical properties of Nano particles in developing a cement mortar which can lead to improvements in the performance of ferrocement as structural elements in the structural system for green housing. Cubes and prisms were cast and tested for determining compressive strength, and modulus of rupture of nano cement mortar. The parameters considered during the investigation were micro sand, micro cement, and wire mesh layers. It was concluded that the flexural strength of Nano ferrocement is higher than that of normal ferrocement.
In reference, the structural behavior of 50 nano ferrocement slab specimens (500 x 500 mm), using nano cement mortar as it was developed by the authors and tested under central patch loads and the central deflections were measured [5]. The ferrocement slab specimens were tested with all four edges simply supported. The number of wire mesh layers, slab thickness, and mix proportion were considered to be the parameters of the investigation. It was concluded that the first cracking and ultimate loads increased by changing the mix proportion from 1:1 to 1:1.5, but the ultimate load is decreased by increasing the ratio of sand in mix proportion.
In reference an experimental investigation concerning the low-velocity impact response of woven glass fiber epoxy matrix composite laminates was carried out. Experimental tests were performed according to ASTM standards using an instrumented falling weight impact testing machine [6]. Impact tests were conducted to characterize the type and extent of the damages observed in laminate subjected to different impact velocities: 2 to 4.5 m/sec. The response of these laminates to drop-weight low velocity impact at energy levels ranging from 3 to 15 J was investigated. At impact velocity of 4.429 m/sec, there is clearly a catastrophic failure of laminates. It was found that the laminates exhibited two types of failure modes viz., crack initiation and perforation of the laminate.
In the present work, ferrocement plate specimens (500x500 mm), were cast using nano cement mortar as developed in references [4,5]. The plate specimens were tested under impact loads by dropping steel striker with spherical head of weight 15N (1.53kg) with 1m drop height and the impact energy that causes first crack and full perforation and impact residual strength ratio (Irs) were determined. The plates were tested with all four edges simply supported. The number of wire mesh layers, plate thickness, and mix proportion were considered to be the parameters of the investigation. It was concluded that the values of first crack and full perforation impact energies are increased when the mix proportion varying from 1:1 to 1:1.5, and for mix proportions 1:2, 1:2.5, and 1:3 the values are decreased for both impact energies, and the first crack impact energy is not affected by changing the plate thickness, but the full perforation impact energy is affected by thickness of plate specimens.
The following materials are used in producing the nano ferrocement plate specimens:
a. Micro Portland cement, conforming ASTM C150 type I [7].
b. Micro sand (150-600 μm), conforming ASTM C33-01[8].
c. Fumed silica(9,10), the chemical composition is given in Table 1.
d. Metakaoline clay (200-3 μm) by burning kaoline clay up to 700 oC for a period of 2 hrs. The chemical composition is given in
Table 2.
e. Wire mesh: welded square mesh used in the present work had an average wire diameter and aperture of 0.25mm and 2.5x2.5mm respectively. The yield strength Fy, elastic modulus Ew, and ultimate tensile strength Fu, were obtained using direct tensile tests. The test was conducted on wire mesh according to ACI-Code 549. The average values of modulus of elasticity (Ew), upper yield stress (Fy), and ultimate tensile stress (Fult) of wire mesh were 66100MPa, 320.5MPa, and 350 MPa respectively.
The Nano cement mortar matrices considered during the present investigation may be summarized in the following groups:
• Group (A): Micro sand/ micro cement ratio 1/ 1, 1.5/1, 2/ 1, 2.5/1, 3/1 with w: c ratio = 0.4.
• Group (B): Micro sand/ micro cement ratio 1/ 1, 1.5/1, 2/ 1, 2.5/1, 3/1, each with fumed silica (1% of micro cement by weight) and 10% of micro cement by weight was replaced by metakaoline clay. W: c ratio = 0.4.
Moulds were made for casting ferrocement plate specimens, each of the moulds consists of a flat steel plate 700x700xt mm (t = 4,6,8,10mm) on which steel angle pieces have been bolted to form square inside dimensions of 500x500mm. The number of wire mesh layers, plate thickness, and mix proportion were considered to be the parameters. A total of 50 simply supported square plates (500x500mm) having mortar with cement/ sand proportions 1:1, 1.5:1, 2:1, 2.5:1, 3:1 by weight have been cast and tested under impact load varying the number of mesh layers, and the plate thickness.
The Nano ferrocement plate specimens considered in the present work are detailed in Table 3
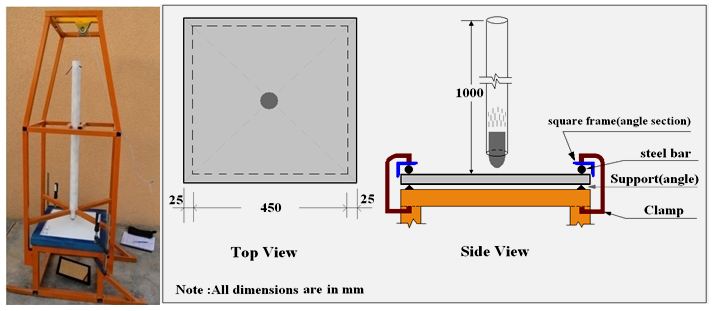
The impact tests were carried out on nano ferrocement plate specimens with all four edges are simply supported over a spans of 450x450mm as shown in Figure 1. The impact load was produced by means of falling weight (1.53 kg) and the height of falling was 1 m, Figure 1, i.e., with a velocity of (4.429 m/sec) which gives energy equal (15J/hit).
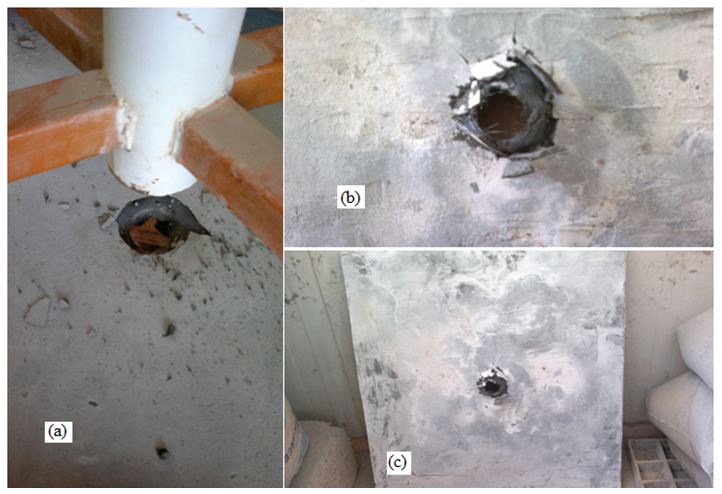
Photo 1 shows the damage which was generally local to the impact site and the failure mode was punching shear.
Through the results given in Table 4:
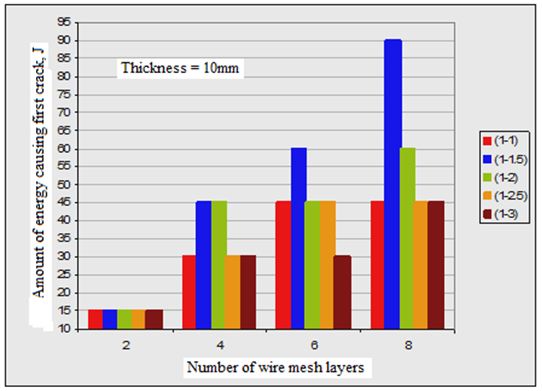
1. It may be noticed that the impact energy needed to cause full perforation for nano ferrocement plate specimens with the same thickness and number of wire mesh layers is increased when the mixing ratio is increased from 1:1 to 1:1.5 and the energy is decreased as the amount of sand in mixing ratio is increased. It may also been seen that the number of blows or impact energy to cause first crack is not affected by mixing ratio of cement mortar.
2. By having the same mortar mixing ratio and number of wire mesh layers, the required impact energy to cause full perforation is affected by plate thickness, but the first crack is not affected by increasing the plate thickness.
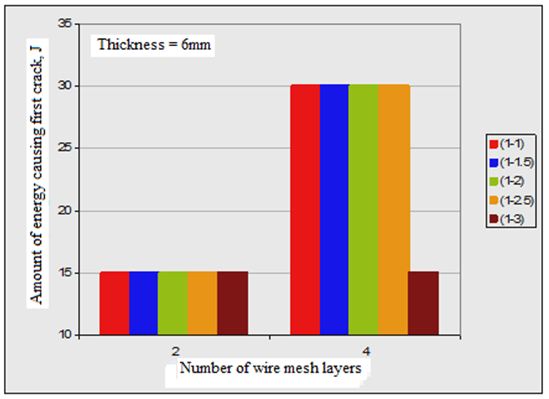
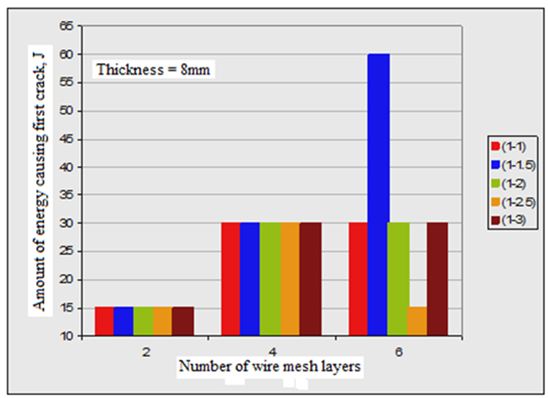
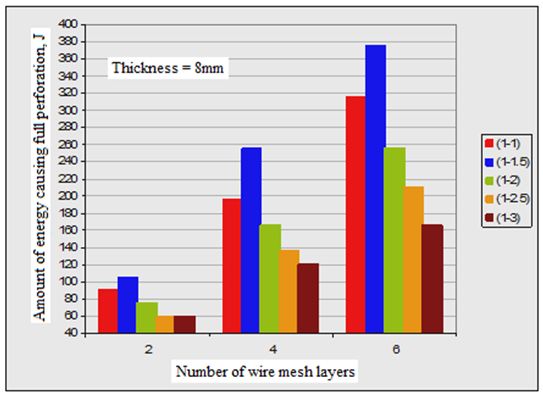
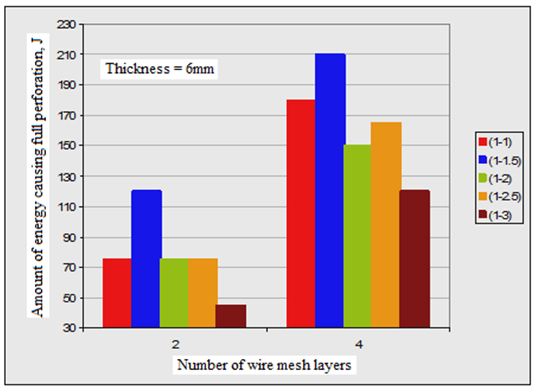
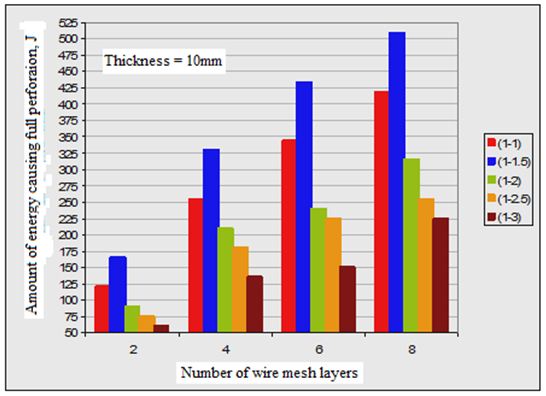
3. In all plate specimens, the required impact energy to cause both first crack and full perforation is much affected by number of wire mesh. Figures (2, 3 and 4) show the effect of number of wire mesh layers and mixing ratio on impact energy required to cause first crack and full perforation in the nano ferrocement plate specimens with different plate thickness.
Residual strength is the load that a damaged objects or material can still carry without failing. The residual impact strength ratio is the ratio of absorbed energy causing full perforation to the absorbed energy causing first cracking.
Table 4 gives the measured values of number of blows and impact energy (J), to cause first cracking and full perforation and the residual impact strength ratio (Irs)
It may be seen from the measured values as tabulated in Table 4 which are obtained by testing nano ferrocement plate specimens having same thickness and reinforced with the same number of wire mesh layers, the impact energy required to make the plates to be failed completely is increased by changing the mix proportion (c: s) from 1:1 and 1:1.5, then the energy decreased gradually when the ratio of sand: cement is increased. It can also be seen that the first crack is not affected by changing the mix proportion.
It was observed from the measured values as given in Table (4), the nano ferrocement plate specimens having the same thickness and number of wire mesh layers, that the energy required to cause complete failure of the specimens increases when the mixing ratio of nano materials from 1:1 to 1:1.5. This energy is gradually reduced by increasing the ratio of sand to cement in the mix until the ratio of cement/ sand is equal to 1:3.
It may be seen from Table 4 that the amount of energy needed to make full perforation is increased when plate thickness is increased. But the amount of energy to cause first crack is not affected by the thickness of plate specimen.
The measured values of impact energy, number of wire mesh layers have a significant effect on the required energy to cause first cracks and complete failure i.e., full perforation.
Figures (2 and 3) show the effect of number of wire mesh layers vs. the amount of energy causing the first crack and full perforation of the tested nano ferrocement plate specimens.
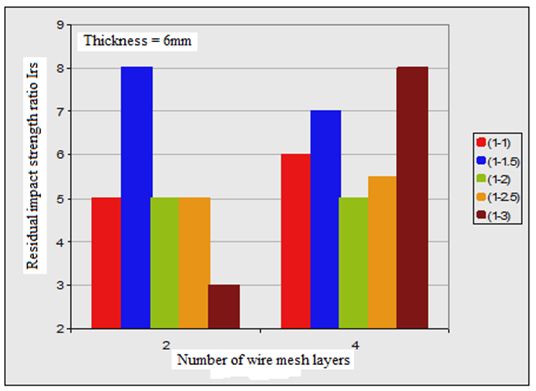
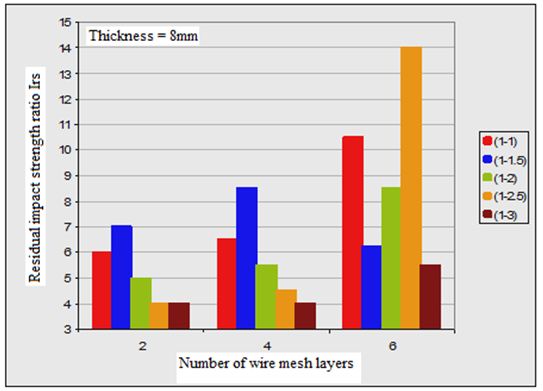
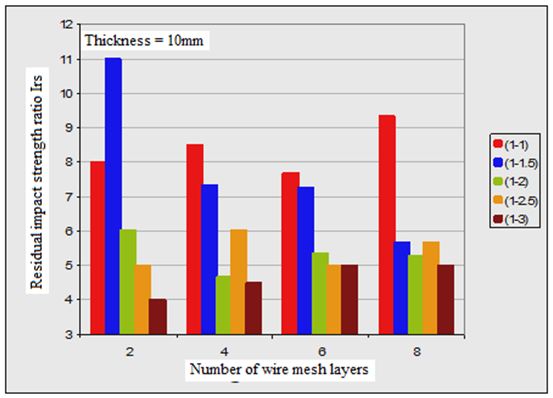
As it was mentioned earlier, the definition of residual impact strength ratio (Irs) is the ratio of absorbed energy causing full perforation to the absorbed energy causing first cracking. The determined values of the tested nano ferrocement plate specimens are tabulated in Table (4) and may be seen that (Irs) is affected by three parameters i.e., mix proportion, thickness of plate specimens, and number of wire mesh layers.
By having same specimen thickness and number of wire mesh layers; the residual impact strength (Irs) ratio is increased when the mixing ratio changed from 1:1 to 1:1.5, and decreased by increasing the amount of sand in the mixture.
Figure 4 shows the effect of changing the number of wire mesh layers and mixing ratios with different thickness values on (Irs) values.
The resistance of nano ferrocement plate to the impact loads is affected by mixing ratio, plate thickness and number of reinforcing layers. The change of these factors affects the impact energy that causes initial crack and full perforation.