Investigating the Cr Dynamics in Sweet Pepper Plants Cultivated with Vermicomposted Tannery Waste
In this study, the dynamics of Cr forms was investigated in sweet pepper plants cultivated with vermicomposted tannery waste, in a greenhouse. Additionally, Cr conversion during vermicomposting was investigated to mitigate the levels of Cr (VI) and Cr (III) that were transformed by bioprocesses. Vermicomposts were prepared by mixing sludge and tanned chips of wet-blue leather, cattle manure, and sawdust. Bioassays of Cr transport were performed by testing its assimilation and distribution during the cultivation. The assimilation was understood as the difference between the Cr content in the substrate at the beginning and in the end of cultivation. After assimilation, the Cr distribution was investigated, being determined in the plant tissues and organs, e.g., roots, stems and stalks, leaves, and fruits. All Cr (VI) was reduced to Cr (III) during the vermicomposting, its concentration coming below the detectable level (LOQ). During cultivation, a significant quantity of Cr (III) decreased in the substrates, being transported to the plants, varying in leaves < stalks < roots < fruits. Cr (VI) was not reported in any sample, substrate and plant. Differences in the chromium contents were not observed between fruits produced by sweet peppers cultivated by adding vermicomposted tannery waste and those grown without addition of Cr residues. This finding can indicate that fertilizing substrates by adding vermicomposted tannery waste presents no risk to food security and human health.
Keywords: Tannery Waste; Vermicomposting; Chromium; Sweet Peppers; Eisenia fetida
The demand for safe disposal of industrial waste is an important topic of concern. After a long history of environmental degradation caused by anthropogenic action (e.g., farming and industrial activity), disposing of waste in the environment is no longer accepted by the society, neither by governmental organs nor for the environmental protection. In a near past, the change of human mentality has driven the investigation of new technologies to reuse and recycle different kind of residues, reducing damage caused mainly to the soil, the water bodies, and atmosphere. [1-4].
An example of industry associated with the generation of huge amounts of solid residues and waste disposal is the leather industry (tanneries). In a typical tanning process, only 20% of the raw material (salted skin) is converted in leather, in a water-intensive process that generates significant volumes of liquid and solid waste, usually rich in chromium and organic matter (OM). [4-6].
To avoid such pollution, specific advanced technologies based in chemical, physical and biological processes have been adopted to reduce waste toxicity and enhance tannery waste use/recycling systems. In this context, vermicomposting is an effective technology for reducing the toxic effects of tannery effluent, based on earthworm Eisenia fetida L. activity. [7, 8] Moreover, earthworms can accumulate heavy metals in their chloragogen cells, resulting in detoxification of polluted biomass. [9, ,10].
The most notorious case is the reduction of Cr (VI) to Cr (III). Chromium is a redox reactive element with oxidation states ranging from −2 to +6, and, in the environment, the +3 and +6 states are predominant. The oxidized Cr (VI) form is well known about its toxicity and its carcinogenic and teratogenic effect, commonly present in the environment as relatively soluble oxyanions, i.e., CrO4−2, HCrO4−, and Cr2O7−2. In other hand, the reduced Cr (III) form is nontoxic and essential for maintaining the normal physiological functions of living organisms. [11] In the agriculture, Cr (III) is an important micronutrient, responsible for the operation of many important metabolic pathways in the vegetal organism, leading to the growth and development of the plants. [12] In the soil and water, Cr (VI) and Cr (III) present high mobility. Since soil particles are predominantly negatively charged, ions are easily electrostatically repulsed, preventing some adsorption and retention to the soil particles. [13].
Due to the potential toxicity and high mobility of Cr forms, it is important to determine its dynamics and transport in the environment. In addition, the fertilizing of a substrate by applying a rich-Cr compost makes understanding possible risks to human health and food security a mandatory task. Several types of industrial waste (i.e., sugar industry waste, textile waste and paper mill sludge) have been successfully vermicomposted to obtain safe composts, [14, 15] therefore able to be applied, e.g., in the organic and family farming systems.
Sweet pepper (Capsicum annuum L.), also known as bell pepper, is a highly consumed vegetable that is better adjusted and most frequently produced under greenhouse conditions. [16-19] Greenhouse cultivation usually demands less use of agri-inputs and labor; although this intense activity is part of a dynamic market in which seasonal prices fluctuate, demanding rigorous planning by the producer for both crop production and the use of technology to decrease production risks and increase profits. [19-21].
In some previous studies, results of vermicomposting have been applied as technology in the tannery waste treatment and organic matter recycling, [22] and its use in the substrate fertilizing [23] have been reported in the literature, showing the benefits of the vermicomposting production. In addition, considering environmental and agronomic aspects, data related to the hormone-like activity and biostimulant effect also indicated the potential of the vermicomposted tannery waste to be used in the organic farming [24].
The aim of this work was to study the dynamics and transport of chromium in plants of sweet pepper cultivated with vermicomposted tannery waste, in a greenhouse. In particular, by using different analytical approaches, we assessed the bioconversion of Cr (VI) in Cr (III) during the vermicomposting process and, in addition to their assimilation (from the substrate) followed by its transport through vegetal tissues and organs. Results were understood in terms of the Cr biostimulant effects and the food security of the harvested fruits.
This study was conducted using vermicomposted tannery wastes in the form of both sludge and tanned chips mixed with an organic substrate, composed of cattle manure and sawdust. The vermicomposters were established in 25 L plastic barrels containing different proportions of fresh waste (based on dry volume). The proportion of the residues was determined by a combination of their C:N ratios. Each barrel received 20 L of the mixture of waste as follows, based on fresh volume: i. Sludge mix (S): 14.5 L of cattle manure, STD: Vermicompost control; S: Tannery sludge; C: Tanned chips; SC: Mixture of tannery sludge and tanned chips; OM: Organic matter; TOC: Total organic carbon; HA: Humic acids; CEC: Cation exchange capacity.
Values in the same row followed by the same letter are not statistically different at P < 0.05 from each other, according to Duncan’s test.
2.5 L of sawdust, and 3 L of sludge; ii. Tanned Chips mix (C): 14 L of cattle manure, 2 L of sawdust, and 4 L of tanned chips; and iii. Sludge + Tanned Chips mix (SC): 14 L of cattle manure, 2 L of sawdust, 1.5 L of sludge, and 2.5 L of tanned chips. For comparison, a vermicomposter with no leather waste was also prepared (standard treatment, STD) by mixing fresh-volume 17 L of cattle manure and 3 L of sawdust. For vermicompost production, 500 newly born earthworms (Eisenia fetida L.) were added to each vermicomposter. [22-24].
From previous analyses, the raw materials presented as main characteristics: i. Sludge (S): pH 7.83, OM 36.32%, TOC 17.20%, N 4.63%; ii. Tanned chips (C): pH 3.31, OM 84.96%, TOC 48.26%, N 13.30%; iii. Cattle manure: pH 8.88, OM 63.02%, TOC 34.30%, N 2.02%; and iv. Sawdust pH 4.84, OM 89.11%, TOC 52.69%, N 0.43%.
Regarding their chemical composition, the resulting vermicomposts were characterized based on their organic matter contents (OM) [25], total organic carbon (TOC) [26], pH [27], cation exchange capacity (CEC) [28], humic acid content (HA) [29], macro and micronutrients (using a Perkin Elmer Avio 200; North Billerica, MA, USA), and C:N ratio (using a Perkin Elmer 2400 CHNO/S; North Billerica, MA, USA) (Table 1).
Organic sweet peppers were cultivated in samples of a dystrophic yellow latosol (dYL) collected from the Campus II of the University of São Paulo (21°59’51” S, 47°56’20” W). Using a tractor, 1.0 ton of soil was drilled at a 40.0 cm depth in the arable fraction. Chemical characteristics are shown in Table 2. As main attributes, the soil collected showed the typical characteristics of a dYL, [30] showing an acid region of pH 5.74, poor OM content (1.52%) and TOC (0.25%), and small CEC (64.91 cmolc kg−1) and base saturation (BS 27.99%). For soil particles size distribution, the texture of the dYL was classified as sandy clay loam, with 31.00% clay, 11.00% silt and 58.00% sand.
Therefore, the dYL was ideally suited to evaluate the nutritive potential of the vermicomposts and consequently the Cr dynamics. A soil rich in OM could confound interpretation since the effects of soil OM and OM added from the vermicompost on plant nutrition cannot be discerned individually. [31-34]
Sweet pepper seedlings (biologically certified) were purchased from SouAgro Sociedade Agropecuária (São Carlos, SP, Brazil). Each seedling was grown in a 25 L vessel containing 20 L of substrate. The cultivation was monitored daily, and to prevent pests, an aqueous extract of orange peel was sprayed on the leaves, a natural repellent that insects avoid. The invasive plants were eliminated manually.
Using a watering can (manual watering), 1.0 L of water was added daily to each plant. The volume of 1.0 L was determined from the wilting point, obtained by preliminary tests.
For the organization of the experiment, the vessels were distributed randomly on benches, with 42 vessels distributed on 2 benches, constructed from 2 boards on 3 tripods, with a size of 6.0 × 0.6 m. In total, 24 vessels were arranged in a 2 × 12 system (column × row) and the other 14 vessels in a 2 × 7 system (column × row). Each column corresponded to one board. The distance between the vessels was 10.0 cm and positions were changed weekly at random.
According to the different types of substrates, the following treatments were studied: i. dYL: Soil, without previous treatment (control treatment); ii. NPK: Soil and 3.0% (V/V) of mineral NPK fertilizer at 12:5:14 (reference treatment); and iii. VRC: Soil and vermicompost at concentrations of 1.5, 3.0 and 6.0% (V/V). The VRC treatments were divided according to the type of the applied vermicompost: STD, S, C, or SC.
Results regarding the sweet pepper organic cultivation, e.g., growth, nutritive value and production, were previously published by Nunes, et al. [23].
Initially, the investigation about the chromium dynamics began during the vermicomposting process, with the study of the Cr (VI) conversion to Cr (III). In this stage, contents of Cr total and extractable Cr (VI)/Cr (III) were quantified, and its metabolizing was explored.
Subsequently, the study about the chromium dynamics was divided into two parts: assimilation and distribution. The Cr assimilation was considered to be the difference between the Cr content in the substrate at the beginning and in the end of cultivation (90 days), called as ΔCr (III). Considering the cultivation system as closed, ΔCr (III) must be negative, since any Cr that was added would only be removed from the soil by moving to the sweet pepper plants, through their root system.
After the assimilation, the Cr transportation was investigated. At post-harvest, Cr (III) were determined in the vegetal tissues and organs: roots, stems and stalks, leaves, and fruits. It is expected that the sum of all these Cr content (m/m) must be equal to ΔCr (III), previously calculated.
For the Cr determination, each part of the plant was dehydrated at 40°C during 48 h in a furnace, followed by maceration and sieving through 0.5 meshes. Cr (III) and Cr (VI) were extracted in deionized water using mechanic agitation at 60 rpm for 30 min, followed by vacuum filtration. The chromium concentration was quantified using an Atomic Absorption Perkin Elmer, model PINAACLE 900T (Waltham, MA, USA).
Following one-way bootstrap ANOVA, the differences among means were evaluated using Duncan's multiple range tests at p < 0.05. The IBM SPSS statistical software package v. 20 was used for data analyses.
During the vermicomposting process, Cr (III) and Cr (VI) were determined in order to investigate the possible conversions among chromium forms (Table 3), which were quantified around 4.62-8.17 and 0.08-0.81 mg L−1, respectively, in the beginning of the vermicomposting, in the treatments S, C, and SC. In the treatment STD, both forms of Cr were quantified below the detectable level (LOQ), 79.80 μg L−1, as expected, since the vermicompost control did not receive tannery waste in its preparation.
By considering the bioconversion of Cr (VI) to Cr (III), all the treatments showed some variation in their chromium contents. In general, this change was characterized by a decrease in the levels of Cr (VI), followed by a rise in the contents of Cr (III), except for the sample S, even with a non-statistically difference at these concentrations (ANOVA bootstrap, p > 0.05). On other hand, the most significant difference between initial and final concentration of Cr was observed in the treatment SC, with a 388.55 % increase in Cr (III), significant statistically different (ANOVA bootstrap, p > 0.05).
Focusing on Cr (VI), due its health and environmental risk, all treatments showed a decrease in this value, reaching a concentration below the detectable level (LOQ). This range is attributed to the bio-conversion of Cr (VI) to Cr (III), which occurred as consequence of the action of earthworms E. fetida, confirming the use of the vermicomposting technology as an advanced biological treatment. [34, 35]
Ackerley et al. [34] and Arillo and Melodia [35] suggested that the reduction of Cr (VI) to Cr (III) occurs due to the action of living organisms in the earthworms E. fetida guts, metabolizing the chromium, as showed in the results (Table 3). At this moment, it is not possible to know clearly how this reduction occurs, the mechanism of the reaction and the biotransformation involving the Cr forms. However, concerning the environmental chemistry, the most important achievement was to propose an alternative method to treat tannery waste, containing a toxic and carcinogenic element, and, in the end, reach an organic agricultural input, free of Cr (VI) and other pathogenic forms of chromium, even rich in nutrients with potential for vegetable production in agroecological and family farming systems.
At first, the study of Cr dynamics was conducted through the transfer of the Cr (III) from the soil to the plant and its transport along the plant organs and tissues. The first step aimed to investigate the Cr (III) levels in the substrate, before cultivation and post-harvest, at the end of the experiments (Table 4).
A priori, we hypothesize that the difference between the chromium contents (initial vs. final) is related to the transfer of the Cr (III) to the plant through root absorption. In the samples where Cr (III) was determined above the detectable level (samples S, C and SC), there was a decrease in the concentration of this ion in the substrate, between the beginning of the culture and post-harvest, resulting in negative values of ΔCr (III).
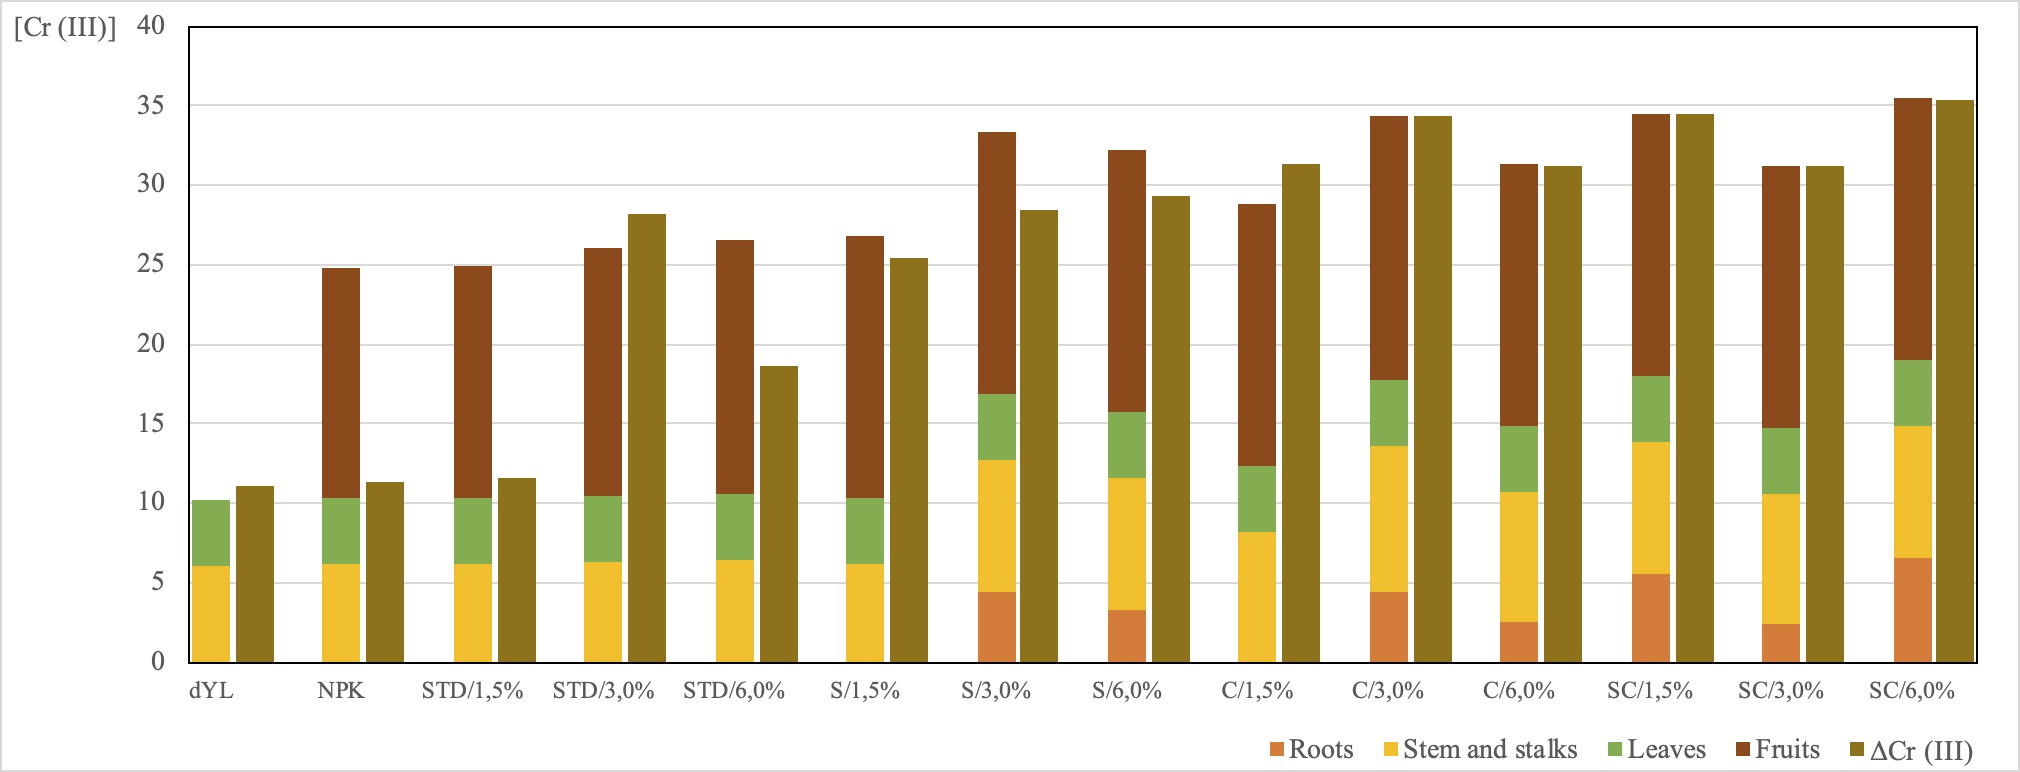
The highest variations on ΔCr (III) were observed in the samples SC/6.0% (353.57 μg kg−1) > SC/1.5% (344.73 μg kg−1) > C/3.0% (343.28 μg kg−1), statistically showing the same values (ANOVA bootstrap, p > 0.05). On the other hand, samples with smaller ΔCr (III) were S/1.5% (254.94 μg kg−1) < S/3.0% (284.72 μg kg−1) < S/6.0% (293.13 μg kg−1), with statistically different values (ANOVA bootstrap, p < 0.05; Table 4).After investigating the Cr assimilation by the plants, it is mandatory to know the transport paths of this nutrient in the vegetal tissues and organs. In general, the concentration of Cr (III) varied in fruits > stalks > leaves = root, with minor exceptions (Table 5).
After investigating the Cr assimilation by the plants, it is mandatory to know the transport paths of this nutrient in the vegetal tissues and organs. In general, the concentration of Cr (III) varied in fruits > stalks > leaves = root, with minor exceptions (Table 5).
In general, the sum of levels of Cr (III) (m/m) in each part of the plant (fruits, stalks, leaves and root) was close to its respective value of ΔCr (III), confirming that chromium from the substrate was transported to the plants (Figure 1).
Initially, the root was expected to act as a type of filter that prevents assimilation of an excessive concentration of Cr by the plant, with accumulation in root tissues. [36-38] In the rhizosphere, the Cr (III) levels varied among treatments, ranging from 23.86 to 65.12 μg kg−1. However, for the treatments dYL, NPK, STD, and S/1.5%, Cr (III) was detected below the LOQ in roots, indicating a metal absorption followed by its transport, without accumulation in the root system.
In the leaves, the levels of Cr (III) were not significantly different among the treatments, approximately 41 μg kg−1. In the stems and stalks, the levels of Cr (III) in the treatments dYL, NPK, STD, and S/1.5% were statistically similar, ranging between 60.71 and 64.50 μg kg−1; in the other treatments, levels of Cr (III) ranging from 82.19 to 92.44 μg kg−1 (ANOVA bootstrap, p < 0.05; Table 5).
Fruits and stalks showed the highest values of Cr (III). However, fruits have a focus due to the concern about food and health security. No fruit was harvested in the sample dYL. In the sweet peppers, the concentration of Cr (III) varied between 145.06 and 165.20 μg kg−1. Fruits harvested in the NPK and STD treatments, at all concentrations, showed levels of Cr (III) statistically similar. In addition, fruits harvested in STD presented, statistically, the same level of chromium that all the others treatments, that also received some vermicompost, despite containing tannery waste (S, C and SC, at all concentrations; ANOVA bootstrap, p < 0.05; Table 5).
Since the fruits harvested in the treatments that received the vermicompost control, STD, showed statistically the same concentration of Cr (III) as the others (samples S, C and SC), it is possible to consider producing vermicompost by adding tannery waste to not increase the Cr content in the fruits, as observed.
Even without specific worldwide legislation about a maximum permissible level (MPL) of chromium in food, it is not possible to assess the harvested sweet peppers in the terms of environmental law. However, an important parameter are the values of reference for nutrients in an ideal dietary intake, established by the Food Nutrition Board (USDA, United States Department of Agriculture), which recommend the ingestion of 25.0 μg Cr day−1 for adult women (19-50 years old) and 35.0 μg Cr day−1 for adult men. Considering that plants cultivated with 1.5%, 3.0% and 6.0% of vermicompost produced sweet peppers with approximately 5.3, 11.1 and 19.0 μg Cr per 100.0 g of fruit, it is possible to estimate that the Cr content presents no risk to human health and food security. In addition, when comparing the Cr (III) determined in the fruits with other foods, the levels reported in our study were close to other values reported as 'Cr-rich' or a 'Cr-source' in the literature (Table 6), also indicating that the harvested sweet pepper are available for human consumption. For example, broccoli has 22.0 μg Cr 100 g−1, and brown bread and potatoes have 4.4 and 1.5 μg Cr 100 g−1, respectively. In red and green grapes, the Cr concentrations are 6.5 and 2.1 μg Cr 100 g−1. In our study, red sweet pepper showed, in general, concentrations ranging from 3.8 to 21.4 μg Cr 100 g−1, which are close to the concentrations present in other foods. [39-41] It is worth noting that this study encompasses one harvest. For food safety, it is mandatory for other crops to be evaluated after successive additions of vermicompost produced with residues from the leather industry.
Firstly, vermicomposting was efficient reducing the Cr (VI) in Cr (III). In the cultivation, a significant quantity of Cr (III) decreased in the substrates between the beginning of the experiments and the post-harvest, being transported to the plants. In their tissues, Cr (III) varied in leaves < stalks < roots < fruits. As expected, Cr (VI) was not reported in any sample, substrate and plant. Differences in the chromium contents were not observed between fruits harvested in plants cultivated adding vermicomposted tannery waste with others, without addition of chromium residues, indicating that fruits harvested in fertilized substrates adding vermicomposted tannery waste present no risk to human health and food security.
The authors thank FAPESP - Fundação de Amparo à Pesquisa do Estado de São Paulo, State of São Paulo, Brazil (Process 2013/00744-0) and CNPq - Conselho Nacional de Desenvolvimento Científico e Tecnológico, Brazil (Process 306715/2013-9) for the support.