Characterization of Municipal Solid Waste: A Case Study in Patuakhali City
A comparative study was carried out among healthcare workers in Sweden and Hungaray with a view of assessing their knowledge, attitude and practice (KAP) towards healthcare waste management. Being a potential source of hazard and infections, healthcare waste continues to be a public health concern worldwide. Pretested questionnaire was instrument used for data collection. In both areas more female participated in the study than male. However, age groups of <20 years, 20-30years, 31-40years, 41-50years,51-60years and 61-70years yielded frequencies of 5.7%, 56.2%, 22.9%, 3.8%, 6.7% and 4.8% respectively for Swedish respondents. While amongst the Hungarian respondents, the respective age groups yielded frequencies of 1.0%, 18.1%, 21.0%, 36.2%, 17.1% and 6.7% respectively(p<0.05). Furthermore, results showed that 58.0% of Hungarian Healthcare workers demonstrated good knowledge of waste management guidelines, while 67.0% received training on waste handling and 84.0% had good knowledge on implementation of guidelines. Conversely, Sweden healthcare workers demonstrated poor knowledge towards waste management guidelines (34.4%), training on waste handling (47.9%) and implementation of waste management guidelines (35. 7%).Amongst the Hungarian healthcare workers, good attitude was observed towards hazardous waste disposal, labeling of containers, colour coding, waste segregation and occupation safety as evidenced by 99.0%, 95.2%, 82.9%, 99.0% and 94.3% good response to the research questions. while poor attitude (39.9%) on report of industrial accident was noted, and 31.4% poor attitude on safe management of healthcare waste was observed. Swedish healthcare workers also yielded good attitude towards hazardous waste disposal (81.0%), labeling of containers (85.7%), colour coding (56.2%), waste segregation (77.1%) and occupation safety (80.0%). While poor attitude was noted for report of industrial accident (44.9%) and safe management of waste. Total of 71.5% good response depicting good practice was observed amongst the Hungarian respondents towards waste management while the Swedish Healthcare workers yielded 72.0% good response on practices towards healthcare waste management which includes activities bordering waste segregation, use of personal protective equipments and prevention of infection. This result stands to be a useful tool to relevant authorities in healthcare facilities for drawing effective action plan towards healthcare waste management.
Keywords:Knowledge; Attitude; Practice; Healthcare Waste
Healthcare waste has continued to be a concern across the whole world. “Hospital waste” is a subset of healthcare waste; it is all waste, biological or non-biological, that is discarded from the hospital and not intended for further use [1].
However, healthcare waste refers to all kinds of waste generated from healthcare environments, whether infectious or noninfectious in nature, chemicals; hazardous as well as nonhazardous materials [2]. Globally, healthcare wastes pose serious threat to public health due to its potential of causing environmental and public health hazards. Healthcare wastes include wastes arising from delivery of support services, vaccinations, diagnosis, monitoring or alleviation of handicap in humans and animals, drug compounding centers, chemist shops, funeral homes (mortuaries) and as a result of informal health care [3].
About 10-25% of healthcare wastes is hazardous and creates a variety of health risks if not properly managed [4 ,5]. Unsafe healthcare waste management practice exposes the healthcare worker, patients and surrounding communities to nosocomial infections and has negative impacts on soil and water [4,5]. However, evidence reveals that wastes originating from healthcare establishments when properly managed, generally pose no greater risks [6].
Healthcare waste (HCW) is generated from both public and private healthcare facilities (HCFs). Healthcare waste in healthcare facilities can be classified as major or minor sources depending on the volume of healthcare waste generated [7]. Major sources include laboratories, mortuaries, and research centers. Minor sources include, small private laboratories, health center /posts, dental clinics, pharmacies, veterinary, maternity homes, bone setting centers, tattoo centers, acupuncture clinics and traditional medicine homes [7].
However, waste management could be defined as the various activities from generation of waste to final disposal involving strategic measures taken in the generation, characterization, quantification, storage, handling, collection, transportation and disposal of wastes [8].
Good knowledge, attitude and practice of healthcare workers towards waste management are very essential and indispensable. The results of previous researchers [9] elucidate the knowledge of their study participants regarding waste management. In their results, majority of doctors (83.6%) had some training in waste management, followed by nurses (69.4%).
They also noted that all the categories of healthcare workers had poor knowledge of presence of recycling services in the hospital; the worst being doctors. Approximately half of their study participants (49.8%) stated that healthcare workers received training in medical waste management [9]. High scores were recorded by most healthcare workers regarding knowledge of the basics of healthcare waste management and handling aspects, such as the categorization of different types of waste, policies on needle-stick injury, existence of infection control department within the hospital, and the health risks associated with poor waste handling. Also in the same study [9], it was noted that training and awareness of recycling of medical waste scored lowest and also 49.8% of participants stated that they received some training in medical waste management [9]. Regarding attitude toward waste management among respondents, most respondents agreed that medical waste should be segregated at the point where it is generated [9].
Makhura et al [10] reported that only 47.2% of healthcare workers had adequate knowledge of correct disposal of healthcare waste and only 36.0% applied appropriate disposal practices of medical waste.
In another study [11], it was reported that 28% of respondents did not adhere to disposal of waste into appropriately color-coded receptacles. Respondents reported several challenges to proper practice of medical waste. Half of the participants reported inadequacy or inappropriate receptacles. The next most reported challenge was absence of protective wear, such as heavy-duty gloves for the cleaners, followed by doctors’ failure to dispose of waste after medical procedures [9, 11].
More so, another study [12] showed that half of the respondents had an unsatisfactory level of knowledge, and 91.0% of them stated that they did not have training on management of biomedical waste. Two groups of researchers working independently reported responses of 51.0% and 75.0% respectively for lack of training as a contributor to poor attitude of healthcare waste management [13, 14].
According to Saizonou [15], 65.5% of healthcare workers had unfavourable attitudes about waste management. As reported by Slyvan et al 12, minority of employees (36.0%) sorted the waste and 67.0% had undergone at least one bloodshed accident. 33.0%, disinfected the storage room once a day. Practices were mostly poor in 50.0% of cases [12]. The researchers interviewed 100 healthcare workers; their ages ranged from 18 to 59 years with a median of 27 years and female health workers accounted for 62.0%. Among the participants, nurses accounted for 32.0% [12].
In another study as reported by Pensiri et al16, out of 344 respondents examined on knowledge, attitude and practice towards health care waste, 87.2% were female and common age range in their study was 20-29 years with a frequency of 36.9%.
Bassey et al [17] reported that doctors, nurses and laboratory technicians have been found to have better knowledge than sanitary staff regarding biomedical waste management. They also pointed out that knowledge regarding color coding and waste segregation at source was found to be better among nurses and laboratory staff when compared to doctors, while sanitary members of staff were ignorant on all counts as regards practices related to biomedical waste management.
Medical wastes need attention and action due to growing population of patients [18].
Other researchers [10,19] opined that disposal of healthcare waste in general may involve incineration, landfill disposal, or deep burial, the choice depending on the category of waste and probably cost and availability of the technology. There could be exceptions and special cases, for example, waste containing recognizable body parts or foetal materials such as placenta, religious and cultural preferences should be considered and such waste should be disposed using acceptable and sensitive modalities [20].
J.Emmanuel et al [21] who worked on the awareness of health hazards for sanitary workers reported that none of the sanitary workers ever received any training nor were aware of the risks and hazards associated with handling of wastes Philip [22] noted that handling of bio-medical waste is proving to be an overwhelming challenge both to government and the health sector. He also reported that has aberrant physico-chemical characteristics and high load of multiple drug resistant bacteria and discharging of the effluent in a municipal sewage system could be a grave public health hazard [22].
Arvind and Girish [23] reported that the proper management of biomedical waste is still in its infancy all over the world. However, Catherine Perrot [24] in her study documented positive attitude of healthcare staff in managing biomedical waste.
Therefore, healthcare waste has continued to pose a significant global challenge due to potential hazards to the environment and public health. Healthcare workers still remain at a high risk of infection from medical waste by the nature of their work and proximity to this kind of waste [10].
Thus, good and correct knowledge, attitude and practice of healthcare workers remain pivotal towards medical waste disposal and management. Poor knowledge, attitude and practice of healthcare workers towards waste disposal are major concern in most countries especially in countries where health education and environmental awareness is inadequate e and uncertain. Therefore, this study which aims at assessing the knowledge, attitudes, and practices among healthcare workers in Sweden and Hungary towards healthcare waste management is necessitated.
The result of the study will serve to identify the gaps in knowledge, attitude and practice towards handling and management of Healthcare wastes, and then solutions will be proffered where necessary.
Study design and duration:This study is designed to be a comparative cross sectional study which lasted for a period of three months.
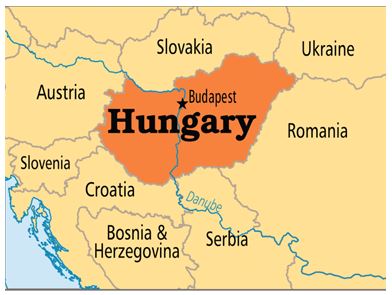
Study area and study site:The study was conducted in Hungary and Sweden. Hungary is situated in Central Europe and covers an area of 93,030 square kilometers. It is bordered by Slovakia to the north, Romania to the east, Serbia to the south, Croatia to the southwest, Slovenia to the west, Austria to the northwest and Ukraine to the northeast. There are about 10 million inhabitants in Hungary in 2016. The population density is 105.9 per square kilometer. The capital of Hungary is Budapest.
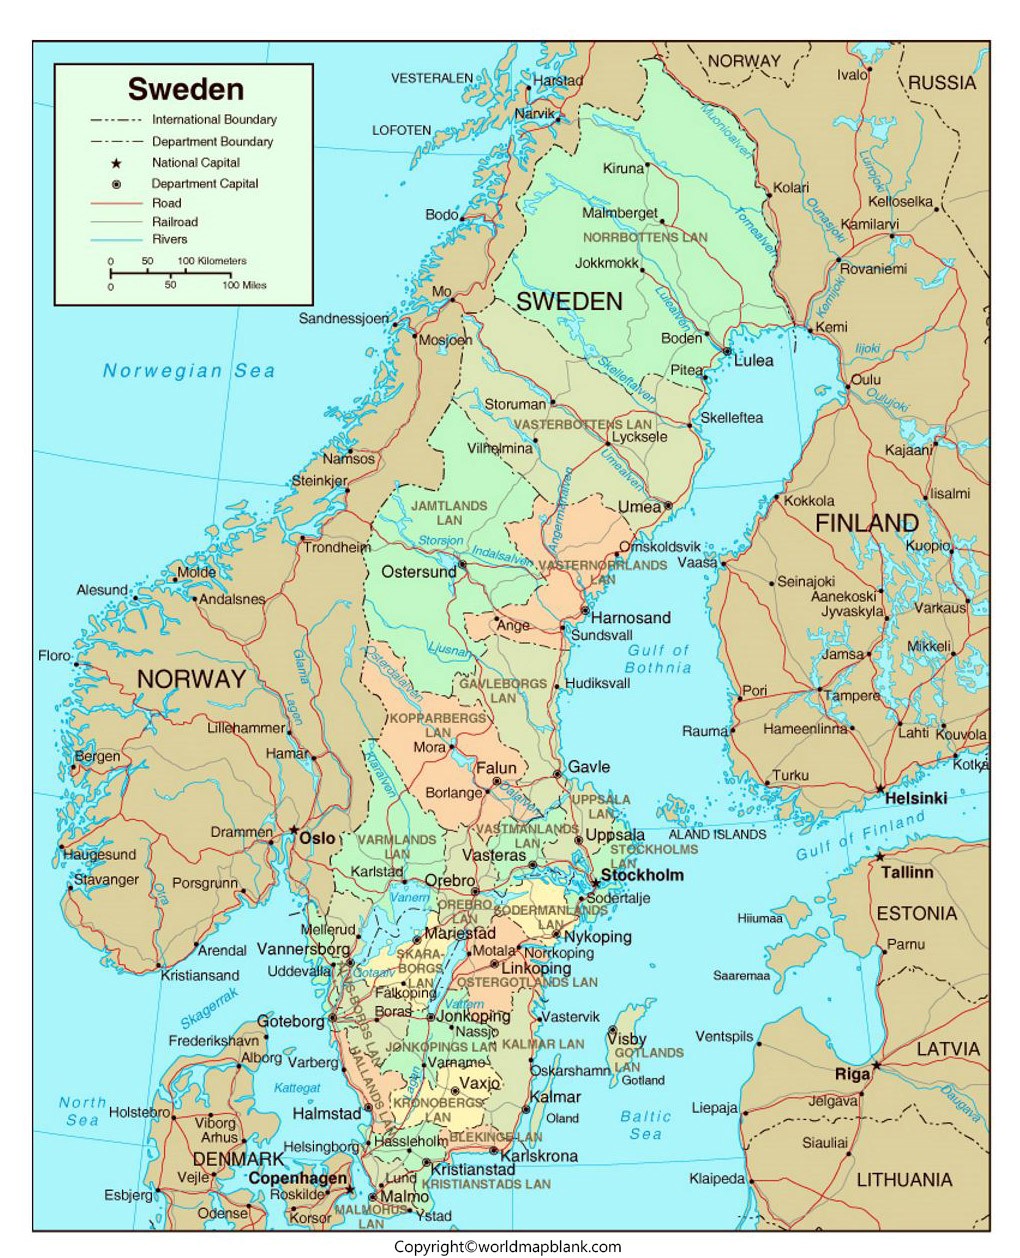
Conversely, Sweden is situated in northern part of Europe. Borders Norway, Finland and Denmark to the west, north and south-west respectively. It has as a population of about 10,3 million inhabitants with a population density of 23 inhabitants per square kilometre. It is known to be the largest in the northern Europe, 3rd largest in European union and 5th largest in Europe. Sweden joined the European union in 1995. Sweden has a GDP of 563,882 billion dollars and per capita income of 54,628 dollars.
The study sites were different healthcare institutions in Hungary and Sweden. Sample population includes healthcare workers working in Szigetivar Korhaz and Mohacs Korhaz in Hungary. The workers of the Karolinska University Medical School and Dental School as well as Unilabs Laboratory in Huddinge, Sweden participated in the study. None of the population in the health care staff above were equally represented as the questionnaires were distributed based on availability of the health care workers due to their tight work schedule and interest in participating in the study. Not all the units of the health care facilities were represented.
As developed part of the world, health care situation in the study areas were observed to be stable; operating under acceptable standard practices, though attitude to waste disposal varies according to health facilities.
Sample size was determined by applying the formula:
(n) = z2 p q / d2
The proportion of healthcare workers with good attitude(p) was 84% of nurses from a previous study [25]. Therefore, p=0.84 and q=1-0.84=0.16.
n = 3.84x0.84x0.16/0.0025
n=206.4 ~ 206
However, in order to allow for non-responders during recruitment, an attrition value was added to round up ‘n’=210. This gave a sample size of 210 participants that was used for the study
The study included doctors, nurses, medical students, staff offering cleaning services and staff grouped as others which include the laboratory technologists, pharmacists, hospital attendants. The target population considered the major producers of HCW especially the hazardous type. Deliberate effort was made to avoid the health care workers that generate majorly waste that are like household waste.
Of the 210 respondents examined in the two study areas,105 were sampled from each area namely Sweden and Hungaray. Out of the 105 respondents from Hungaray, 11(10.5%) were male while 94(89.5%) were female. Conversely, of the 105 respondents from Sweden, 28(26.7%) were male while 77(73.3%) were female.
The instrument for data collection was a pretested researcher administered closed-ended questionnaire. 210 questionnaires were used for this study. It was distributed equally between the health care workers in the two countries i.e. 105 questionnaires for health care workers in Hungary and 105 questionnaires for health care workers in Sweden.
33 questions were designed for the study, out of which, 25 were the core questions required for assessment while 8 were designed to keep the respondents’ psycho within the limit of unbiased mind.
The questions were designed to give “Yes”, “No” and “No Idea” as responses. “Yes” is a positive and correct answer while “No” is a negative answer except for questions 8-12-part B and 25, 27 and 28-part C of the questionnaires. “Yes” and “No” is regarded as a form of idea and the response. “No idea” is regarded as having no basic information/knowledge about the subject in the respective variables. Even though “No” response is a negative answer but it is still a better response than a “No idea” as the later gives the impression of complete lack of KAP. Responses for individual variables were recorded as percentages; 50% and above was marked as good while 49% and below was marked as poor.
“Knowledge “was assessed via 3-variables viz;
on waste guidelines (questions 15,16,17,29),
Training/education on waste handling (questions 18,19,20) and waste guideline implementation (questions 21,22,23,24).
“Attitude” on HCW was assessed using 7 variables i.e.;
Attitude on industrial accident (questions 7 and 11).
Attitude on waste disposal (question 1).
Attitude on safe management of HCW (question 2)
Attitude on labeling of containers (question 4)
Attitude on color-coding (question 5)
Attitude on waste segregation (question 3).
Attitude on occupation safety of waste handling (question 6).
“Practice "was assessed using 3 variables i.e.;
Practice on segregation of waste (question 26)
Practice on use of personal protective equipment (questions 30,32,33)
Practice on protection/prevention of infection (questions 13 and 14).
Bias/Ethical Consideration: Approval to conduct the research from Ethical Committee - Doctoral Research Council board in University of Pecs School of Health. Written consent from participants was taken before including them in the study. The questionnaires were anonymous and this was taken into consideration during the collection of the completed questionnaires. Questionnaires were shared both as soft copy and as hard copy. The soft copy was done through a google link and contained exact same copy as the paper form. Autonomy and beneficence of the participants were also considered.
Bias was avoided by employing random selection through collection of questionnaires in paper form in a ballot box and distribution through google link.
Data were extracted from the self-administered questionnaire and was analyzed using SPSS. The empirical data and figures collected during the study was used for data analysis deriving statistical significance of associations between variables. The level of significance was set at 5% confidence level
The result shows that in both areas more female participated in the study than male. Age groups of <20 years,20-30years,31-40years, 41-50years, 51-60years and 61-70years yielded frequencies of 5.7%, 56.2%, 22.9%, 3.8%,6.7% and 4.8% respectively for respondents from Sweden. While amongst the Hungarian respondents, the respective age groups yielded frequencies of 1.0%, 18.1%, 21.0%, 36.2%, 17.1% and 6.7% respectively (Table 1). Statistical difference was noted amongst frequencies of the various age groups in the two areas (X2Wed.=1.36;df=5;p<0.05: X2Hung.=1.47.17;df=5;p<0.05).
Table 2 shows the knowledge of Hungarian respondents on health care waste disposal. The highest proportion (58.0%) of the respondents gave a correct answer (yes) to the test questions; reflecting a good knowledge on waste management guidelines. While 35.9% responded “no” to the questions and 6.1% had no idea. In similar vein, highest proportion (67.0%) had a good knowledge/training on waste handling protocols. While 26.0% and 7.0% of the respondents yielded a negative(“No”) and neutral(“No Idea”) answers respectively. More so, highest percentage of the respondents(84.0%) demonstrated a good knowledge on implementation of waste disposal guide lines while,11.4% had a poor knowledge on implementation of waste disposal guidelines.
Conversely, amongst the Swedish respondents in Table 3, the proportion that responded “Yes” (34.4%) is almost the same with those that said “No” (34.1%) showing a poor knowledge on waste management guidelines, while 31.5% said they have no idea on waste management guidelines as applied in their place of work. More so, 47.9% had adequate training and education on waste handling protocols while 30.0%gave a negative response (“No”) for such knowledge. 22.0% said they have no idea.
Assessing their knowledge on implementation of waste disposal guideline, highest proportion (35.7%) responded “yes” for having the knowledge while 29.1% responded “no” showing lack of such knowledge. Then, 35.2% said they have no idea of such waste disposal guideline implementation in their work place (Table 3).
Furthermore, Table 4 shows the result of the attitude of Hungarian respondents on health care waste disposal. Assessing their attitude on reporting industrial accident, highest proportion (59.5%) responded “No”; that they had not reported industrial accident; which is a poor attitude while low proportion(39.9%) responded “yes” for reporting industrial accident. Least proportion (0.7%) of the respondents said they had no idea. The result further shows that 99.0% of the respondents showed a good attitude towards hazardous waste disposal. This proportion answered “yes” which a good answer is depicting a good attitude to the test questions assessing their attitude on hazardous waste disposal, while 1% of the respondents said “No” to the test question. However, good attitude was recorded for the respondents while examining them on safe management of health care waste. Of the 105 respondents,65.7% being the highest proportion said practicing of safe management of health care waste is not an extra burden on work by answering “No” to the test question thereby demonstrating a good attitude. While 31.4% said “yes” to the question, depicting a poor attitude, then the least proportion(2.9%) said “no idea”. Furthermore, good attitude was noted towards labeling of containers where 95.2% of the subjects agreed that labeling of containers before filling it with waste is of clinical significance by answering “Yes” to test question while 3.8% answered “No” and 1.0% answered “No idea”. Good attitude was also noted towards colour coding as 82.9% responded “yes” for using colour coding in segregation of waste while 16.2% said “No” and 1.0% said “No idea”. Furthermore, high percentage(99.0%) of the respondents demonstrated good attitude towards segregation of Healthcare waste while the least proportion(1.0%) said they have no idea. However, good attitude on occupation safety was recorded as 94.3% responded “yes”, that they consider occupational safety of waste handlers and waste generators a must.
Conversely, amongst the respondents from Sweden as shown in Table 5, proportion of 44.9% had reported industrial accident while 44.4% had not reported and 10.6% had no idea. Reasonable proportion(81.0%) showed a good attitude towards hazardous waste disposal as supported by their “yes” response to the test question while least proportion (3.8%) said “no” showing poor attitude, though 15.2% gave a response of “No idea” to the test question. The result also showed that the respondents demonstrated a good attitude towards safe management of health care waste as highest percentage of 70.5% responded “No”;that attitudes towards safe management of health care waste is not an extra burden on work while 21.9% responded “yes”;that it is a burden and 7.6% said they have no idea. More so, the highest proportion (85.7%) answered “yes”; that labeling of containers before filling it is of clinical significance, which is a good attitude while the least proportion (5.7%) answered “No” and 8.6% had no idea to the test question. Good attitude was also noted towards colour coding as 56.2% gave a positive response (yes) to the test question while 16.2% gave negative response(No) and 27.6% answered “no idea”. Regarding segregation of waste, good attitude was also demonstrated as highest proportion(77.1%) of respondents gave a positive response (yes) to the test question while 7.6% gave a negative response(no) and 15.2% said they have no idea. Furthermore, examining the attitude of the respondents towards occupational safety, the result showed that 80.0% of them had a good attitude while 4.8% demonstrated poor attitude and 15.2% said they have no idea to the test question (Table 5).
Table 6 shows the practice of the Hungarian respondents towards health care waste management. Good practice on waste segregation/separation was noted as 96.2% of the respondents answered “yes”; that in their various departments, practice of waste separation/segregation is routine. Only 2.9% said (“No”) they don’t practice it while 1.0% has no idea. Regarding practice on personal protective equipment, highest percentage (61.9%) of the respondents answered “yes” which is a positive answer depicting a good practice while 29.5% of the respondents answered “no” showing a proportion with a poor practice, and 8.3% said they have no idea on the test questions. In the same vein, highest proportion (73.3%) of the respondents demonstrated a good practice towards protection/prevention of health care waste related infections while few proportion (23.3%) responded “no” and least proportion (3.3%) said they have no idea.
Furthermore, Table 7 shows the result of the practice of the Swedish respondents on health care waste. Examining the respondents on practices towards waste segregation/separation, the result revealed a good practice, since 67.6% answered “yes” which is a positive response to a good practice regarding the test question while only 6.7% answered “No” and 14.3% said they have no Idea on the questions. Similarly, assessment was also done on practice towards personal protective equipments and good practice was recorded as 75.9% of the respondents yielded positive response(yes) while the least percentage (5.7%) answered “no” thereby demonstrating a poor practice and 18.4% had no idea. However, practice on protection/prevention on waste management related infections was also a studied. Highest proportion (64.3%) demonstrated a good practice by answering “yes” to the test question while the least proportion (4.8%) answered “no” to the test questions thereby reflecting a poor practice, though 31.0% said they have no idea on the questions.
The result of this present comparative study on Knowledge, attitude and practice (KAP) of healthcare workers towards healthcare waste management which lasted for a period of three months in some parts of Sweden and Hungary revealed variations and significant statistical differences among the socio-demographic characteristics and responses to different research questions designed as variables to assess Knowledge, Attitude and Practice towards healthcare waste.
However, more female health workers participated in the study than male; both in Sweden (female=73.3%; male=26.7%) and Hungary (female=89.5%; male=10.5%). The observed preponderance of female than male in both areas might be attributed to the fact that probably, more female health workers demonstrated their willingness to participate in the study than male counterpart. Alternatively, it might be that the work force favoured the recruitment of female health workers than male, hence their preponderance.
Thus, this present result on preponderance of female than male corroborates the report of Sylvain et al [12] who in their study interviewed 100 healthcare workers whose various ages ranged from 18 to 59 years with a median of 27 years and female health workers accounted for 62.0%. In another study by Pensiriet al [16], similar result in tandem with that of present study was also reported. Their result showed that, out of 344 respondents examined on knowledge, attitude and practice towards health care waste, 87.2% were female.
The result of this present study further revealed that healthcare workers within the age group of 20-30years examined in sweden occurred most (56.2%) while those within 41- 50years recorded the least (3.8%)occurrence. The younger ones were not only predominantly available but they were also more willing and open to participate in the study than the older ones. This result corroborates the result of pensiri et al [16] who reported that the common age range in their study is 20-29 years with a frequency of 36.9%. Divergent opinion was reported by Mugabiet al [9] who noted other age groups to be predominant in their study on knowledge, attitude and practice of healthcare workers regarding medical waste management in Botswana.
Conversely, health care workers in Hungary had age group of 41-50years as the highest occurrence (36.2%) while the least (1.0%) occurrence was noted for those below 20 years. This result is quite different from that of Swedish respondents; probably, the two areas do not have similarities in age-related employment policies, hence the preponderance of some age groups than others. Another reason might be that age group of 41-50 years showed more interest in the study than others as in the case of Sweden. However, the Hungarian result is in tandem with that of Mugabi et al 9 but does not support that of Sylvainet al [12] and Pensiriet al [16].
Furthermore, in this study, it is also noted that Healthcare workers from Hungary demonstrated good knowledge on waste management guidelines as evidenced by 58% good response to the related research questions. This observed proportion of 58% of the healthcare workers is aware of waste management guidelines including its contents as used or applied in their work place. They also acknowledged that hazardous medical waste is a problem to healthcare institutions thereby supporting the results of previous researchers4,5 who noted that about 10-25% of healthcare wastes is hazardous and creates a variety of health risks if not properly managed [4,5]. On the other hand, 35.9% responded that they do not have knowledge of the waste management guidelines (“No” response) while 6.1% had “no idea” about the knowledge of the management guidelines. From this present study it is evident that good waste management practice is key to a healthy environment as supported by previous researchers who also reported that unsafe healthcare waste management practice exposes the healthcare worker, patients and surrounding communities to nosocomial infections and have negative impacts on the natural resources i.e. air, soil and water [4,5].
More so, 67% good response on training/education was also observed among the health workers sampled in Hungary. According to their response, they have had some forms of training/education on waste handling. Good knowledge was also observed among the respondents with respect to implementation of waste management guidelines. Also according to the result of this present study, 84% of the sampled population can implement waste management guidelines. 26% and 7% did not get training/education on waste handling and have no idea about the training/education on waste handling respectively. Even with the later a good level of response was still received from the Hungarian healthcare workers.
However, the sampled Hungarian healthcare workers has demonstrated a good knowledge on waste management guidelines, the implementation and the prerequisite training on waste management as required of a health worker in a hospital where standard practice is obtainable (84%). Only 11% and 5% respectively stated that they do not have knowledge on guideline implementation and no idea about the knowledge on guideline implementation. This present result also is in tandem with that of Bassey et al [17] who reported that doctors, nurses and laboratory technicians have been found to have better knowledge than sanitary staff regarding biomedical waste management. They also pointed out that knowledge regarding color coding and waste segregation at source was found to be better among nurses and laboratory staff as compared to doctors, while sanitary members of staff were ignorant on all counts as regards practices related to biomedical waste management [17].
This present result is not in agreement with that of previous study 43 where half of the respondents had an unsatisfactory level of knowledge, and 91.0% of them stated that they did not have training on management of biomedical waste.
The result of Mugabi et al [9] also is in tandem with that of present study where good knowledge is noted towards medical waste. In their result, they reported that high scores were recorded by most Healthcare workers regarding knowledge of the basics of medical waste management and handling aspects, such as the categorization of different types of waste, policies on needle-stick injury, existence of infection control department within the hospital, and the health risks associated with poor waste handling.
Therefore, in view of the present result it is recommended that relevant stakeholders in healthcare system continue to support and sustain this kind of good knowledge of healthcare workers on waste management observed amongst the healthcare workers in Hungary so as to prevent waste related hazard in the area or outbreak of waste-related microbial infections; most of which may be bacteria which are antibiotic resistant. It is expected that this should be sustained through awareness and campaign targeted towards promoting good and healthy environment.
Unfortunately, reports had it that almost 80% of medical wastes are mixed with general waste, especially in developing countries9 and in the course of providing healthcare services; it is inevitable that medical waste will be generated. So, if these generated wastes are not handled and disposed properly, it may lead to adverse health consequences for man and entire nature.
Conversely, the sampled healthcare workers from Sweden demonstrated poor knowledge of waste management guidelines (34.4%), training on waste handling (47.9%) and implementation of waste management guidelines (35.7%). 31.4%, 30.0% and 29.1% respectively had no knowledge of waste management guidelines, had no training on waste handling and had no knowledge of guidelines implementation. Worse still, 31.5%, 22.0% and 35.2% respectively had no idea about the knowledge of waste management guideline, had no idea of training on waste handling and had no idea about the knowledge of guideline implementation. This is a worrisome development since healthcare waste is a potential source of infection both to the healthcare worker and the public. It has been previously documented [18] that waste management and especially medical wastes need attention and action due to growing population and the inevitable increasing number of patients and the medical waste they generate.
Healthcare wastes are very important because improper handling due to poor knowledge as observed among healthcare workers in Sweden can be a risk to both healthcare providers and the general population alike because of exposure to both infectious and contaminated waste-related objects.
Therefore, in a setting where proper knowledge of waste management is inadequate as reported in this present study amongst Swedish healthcare workers, there is a tendency for high risk of hazards associated with toxic wastes. Sequel to this development, it is pertinent in this area to intensify effort targeted towards upgrading the knowledge of Health care workers on proper management of medical waste, as supported in previous researchers [9,19] who opined that disposal of healthcare waste in general may involve incineration, landfill disposal, or deep burial [10,16], the choice depending on the category of waste and probably cost and availability of the technology. There could be exceptions and special cases, for example, waste containing recognizable body parts or foetal materials such as placenta, religious and cultural preferences should be considered and such waste should be disposed using acceptable and sensitive modalities [20]. But this is applicable where adequate knowledge of waste handling is optimum as observed amongst Hungarian health care workers when compared with the Swedish healthcare workers who demonstrated poor knowledge.
This result obtained from Sweden where poor knowledge was observed corroborates that of some of previous researchers like J. Emmanuel et al [21] who worked on the awareness of health hazards for sanitary workers and reported that none of the sanitary workers ever received any training and were aware of the risks and hazards associated with handling of wastes [21]. Another study [17] revealed that no sanitary worker had good knowledge of healthcare waste disposal in the healthcare facilities(HCFs) and 71.4% of HCF disposed of their waste in public waste-bin, while another study revealed low levels of training and awareness of waste legislation mostly, among staff [17].
It is therefore recommended that relevant stakeholders in Swedish healthcare system should ensure that more awareness on medical wastes and safety measures should be created in healthcare system in order to prevent hazards and exposures to dangerous wastes. When this is done, the resultant effect however will translate to good health of the health workers and safety of the environment.
This present study also assessed attitude of the healthcare workers towards waste management. From the result, poor attitude was observed amongst the Hungarian healthcare workers in the aspect of report of industrial accident. Only 39.9% of the sampled healthcare workers had reported industrial accident and 31.4% demonstrated safe management of healthcare waste. Amongst these two variables, poor attitude was at the optimum and merits lamentation because in a healthcare system where industrial accidents such as injuries due to sharps are made sinister, spread of diseases and death is inevitable.
However, two groups of researchers working independently reported responses of 51.0% and 75.0% respectively for lack of training as a contributor to poor attitude of healthcare waste management [13, 14].
According to Saizonou [15], 65.5% of healthcare workers had unfavorable attitudes about waste management. However, Catherine Perrot 24 reported positive attitudes of healthcare staff in managing biomedical waste. This difference was explained by the researchers that working conditions were more favorable in developed countries than in developing countries [12].
Therefore, good attitude to safe management of healthcare waste is indispensible and must be adopted in a standard healthcare institution, especially in an area like Sweden.
Furthermore, this present result that showed poor attitude towards safe management of healthcare waste is in tandem with the report of Philip [22] who noted that handling of bio-medical waste is proving to be an overwhelming challenge for the both to government and the health sector.
But this particular challenge should be faced squarely since it is evident that hospital wastes such as effluent has not only aberrant physico-chemical characteristics but also has high loads of multiple drug resistant bacteria and discharging of the effluent in a municipal sewage system could be a grave public health hazard [22].
Arvind and Girish [23] reported that the proper management of biomedical waste is still in its infancy all over the world. There is a lot of confusion among waste generators, operators, decision makers and the general community about the safe management of bio-medical waste.
Poor knowledge and attitude as noted in this present study has equally been reported by Philip [22] who in his study noted that, among the hospitals sampled, only one treated its own waste. One hundred and fifty other hospitals dump their biomedical waste within their premises or dispose of it with the other garbage that goes to municipality dumps; which is a clear demonstration of poor knowledge [22].
However, proper management of hospital waste ensures that infectious waste is handled in accordance with established and acceptable procedures from the time of generation through treatment of the waste and its ultimate disposal [22].
Also in this present study amongst the Hungarian healthcare workers, good attitude was observed towards hazardous waste disposal, labeling of containers, colour coding, waste segregation and occupation safety evidenced by 99.0%, 95.2%, 82.9%, 99.0% and 94.3% good response to the research questions assessing attitude to the variables. Overall, 75.1% good response was recorded for attitude to health care waste. This is a good result indeed which should be sustained and encouraged not only in the study area but in other areas as well.
Swedish healthcare workers showed similar result on attitude towards hazardous waste disposal, labeling containers, colour coding, healthcare waste segregation and occupation safety with response of 81%, 85%, 56%, 77%, and 80% respectively. However, poor attitude was observed for reporting industrial accident and for safe management of Healthcare waste evidenced by 44.9% poor response and 21.9% poor response respectively on reportage of work accidents and attitude on safe management of healthcare waste. This was also observed in their Hungarian counterparts (29% and 31% respectively). The percentage of “no idea” response was not significantly high for the Hungarian but varied between 7.6% to 27.6% on attitude towards hazardous waste disposal, labeling contains, colour coding, healthcare waste segregation and occupation safety including reportage of work accidents and attitude towards management of healthcare waste for the Swedish respondents. A better attitude towards healthcare is expected if a sustainable healthcare waste management is to be established as this shows that significant number of people working in healthcare sector in Sweden might have possibly have poor knowledge of the right attitude to have towards healthcare waste management.
Furthermore, total of 75.1% good response on practice was observed amongst the Hungarian respondents towards waste management while the Swedish Healthcare workers yielded 72.0% good response on practices towards medical waste management. From a comparative point of view, the healthcare workers in the two areas have immensely demonstrated good practices towards activities bordering waste segregation, use of personal protective equipments and protection/prevention of infection, including vaccination. This indeed is an appreciable and positive result; which means that healthcare workers in the two areas are compliant with basic and standard practices expected of a healthcare worker in a stable health care system. This observed result is very pivotal since good health is of utmost importance both to caregiver and the patient even though significant number of respondents had no idea of the practice on waste segregation/separation (14.3%), personal protective equipment (18.4%) and protection/infection prevention (31.0%) respectively for the Swedish counterparts.
However, this result contradicts that of Slyvain et al [12] who reported that the level of practice was poor among health workers, and that poor management practice of biomedical waste could be explained by the insufficiency of human and material resources. They further reported that heavy workload could reduce the time devoted to waste management.
Contrary to the results of this study, other researchers in a cross sectional study conducted at Pravara Rural Hospital, Loni and Maharashtra with an aim to characterize and quantify the waste generated at the hospital, found that there was no segregation of the waste starting from generation to disposal [22], thereby portraying a poor attitude to waste management.
However, health care providers are exceptionally at a high risk of infection from medical waste as a result of the nature of their work and proximity to the waste. In line with good practices on medical waste management observed in this present study, one can suggest that it is essential to adequately segregate medical waste so as to ensure that safe work system is ensured and this is the responsibility of the waste generator.
Both in Hungaray and Sweden, healthcare workers do sort the medical wastes into color coded plastic bags or containers and this remains the most appropriate way of identifying the categories of healthcare wastes according to WHO recommended color coding for biomedical and healthcare waste are: red for highly infectious waste; yellow marked “SHARPS” for sharps waste, brown for pharmaceutical waste, lead box labeled with radioactive symbol for radioactive waste and black for general or non infectious waste.
On-site transportation of healthcare waste is best carried out using mobile trolleys, containers or carts that are not used for any other purposes. Safe packaging and adequate labeling of wastes are essential ingredients for off-site transportation.
Summarily, good Knowledge, attitude and practice (KAP) of healthcare workers towards healthcare wastes management remain pivotal in healthcare institutions. Contrary to this expectation, hitherto variations in the above mentioned parameters, i.e. KAP still exist not just in developing countries alone but also in developed countries as demonstrated by the results of this present study. Therefore, relevant stakeholders in healthcare system should apply the result of this study as a guide while making decisions and policies on medical waste management since medical waste generation is inevitable both in developing and developed countries. Though, there may be some impediments to good KAP in healthcare system which inadequate equipment and inadequate periodic updates are inclusive.