Modeling and Simulation of Sorption of Pb(II) Ions onto Synthesized Graphene Oxide Surface
Herein the study of graphene oxide (GO), synthesized using Hummwe’s method, was used as low-cost adsorbent for removal of Pb(II) ions from aqueous solutions. Batch adsorption process was used to study the adsorption of Pb(II) onto the surface of GO. In order to optimize the adsorption process, various parameters such as pH, contact time, sorbate concentration, and adsorbent dosage, were performed. Equilibrium data were studied by different isotherm models such as Langmuir, Freundlich, Temkin and Dubinin-Radushkevich (D-R). It was found that the experimental data fitted well with Freundlich isotherm with highest value of R2 (0.9740) compared to other models. In order to study the adsorption mechanism, different kinetic models were also tested and the adsorption process undergoes the second order kinetic model. The interaction of graphene oxide with Pb(II) ions were probed by GaussVeiw 03. Simulation reveals that van der Waals force is mainly mechanism for Pb(II)-GO interaction which approved by KB isotherm. The lowest binding energy was observed for the complex is -1.204518 hartree. Also, it was found that the lowest binding energy of the inclusion complex between the guest (Lead chloride) and the host (GO) equal to -0.0174467 hartree at angle 45o. The computed adsorption energy of Pb(II)-GO was -0.0174467 j/mol k.
Keywords:Graphene oxide; Pb(II) ions; Molecular Simulation; Adsorption; Kinetic
Nowadays, the control of heavy metal emissions into our environment have been concerned as the exponentially increase of population. One of the most non-degradable and tend to accumulate in living organisms of interesting heavy metal for removal and recovery from waste and drinking waters is Lead (Pb) due to the toxicity and widely used in many industrial application such as batteries, printing, pigment, coating and steel industries in large amounts. The pollution and toxicity of lead (Pb) are well known to be highly accumulates in bones, kidney and muscles causing severe damage to nervous and reproductive systems. In drinking and waste waters, the maximum acceptable concentration of lead is set at 5-10 μg/L by Environmental Protection Agency (EPA), North American guidelines, Bureau of Indian Standard (BIS), WHO and EU [1]. In recent years, different traditional technologies for Pb(II) and other heavy metals from ground and surface waters have been applied such as precipitation, ion exchange, member processes , evaporation, chemical oxidation or reduction, solvent extraction, biological materials and adsorption [2]. However, the applications of these techniques bases on percentage of heavy metal removal, high consumption of reagent and energy, low selectivity, high operational cost and regeneration of the materials used for removing heavy metals. For many reasons, adsorption processes have been received a great attention due to their relatively low production cost and high adsorption capacity for pollutants. Numerous carbonaceous materials have been used as adsorbent of heavy metals including charcoal, silica, activated carbon and agriculture waste materials and activated slag, etc. However, it remains necessary to find a new low cost, easily prepare, available, more effective process, and high adsorption capacity materials for water treatment. Several researches have been extensively investigated to remove the heavy metals from wastewaters using either natural or synthesis materials. Some researchers reported that chemically preparation of raw materials was enhanced adsorption capacity in comparison with biomass. Among of them, graphene oxide has a great potential for many application especially in water treatment systems due to the surface chemistry and antibacterial agent [3].
Graphene oxide is a precursor for graphene which prepared by strong oxidation of graphite using different oxidation agents. On the oxidation process, large quantities of oxygen atoms introduces on the GO surface with a large surface area. These oxygen atoms can be in form of epoxy, hydroxyl and carboxyl and through sharing an electron pair, the GO can efficiently bind Pb(II) GO has been ions from aqueous solution . Graphene oxide can be prepared by chemical oxidation of graphene using different oxidizing agents. GO has been used in many fields such as coating, flexible rechargeable battery electrode, and water purification due to the unique properties (huge surface area, high stability and strong adsorption capacity). The results of GO using chemical oxidation introduce functional groups such as carboxyl, carbonyl, hydroxyl and peroxyl between carbon layers of graphite [4]. Also, intensive researches have subjected during the last decade on the application of computational methods due to the experimental work associated with theoretical calculations is the best way to investigate the molecular structure and its effect on the physical properties [5]. Moreover, molecular modelling has become a valuable and essential tool to study the design process of medicinal chemistry. Molecular modelling can be also used to predict the generation, manipulation or representation of three-dimensional structures of molecules and their physico-chemical properties by using a range of computerized techniques based on theoretical chemistry methods and experimental data [6].
The electrodes of the supercapacitor are normally made of porous carbon but recently, the researchers start to investigate the possibilities of using graphene as electrodes. This is because graphene-based materials haves shown interesting properties such as high surface area, high conductivity and capacitance and low production cost [7]. Large area graphene is highly desirable as it significantly reduces high intersheets contact resistance as compared with small area graphene [8].
However, to the best of our knowledge, little information regards to the adsorption of Pb(II) onto graphene oxide using experimental and theoretical processes. The adsorption and kinetic of Pb(II) ions onto GO is still being debated. The effects of various experimental parameters, such as contact time, solution pH, Pb concentration, graphene oxide dosage, were also investigated and optimized. The various equilibrium adsorption isotherms and kinetic models were applied to evaluate the experimental data.
All chemical reagents were of analytical grade and used without purification. Lead chloride [PbCl2], sodium hydroxide [NaOH; 0.1N] and hydrochloric acid [HCl; 0.1N] were purchased from Merck, Germany and BDH, England. GO sample used in this work was obtained from and used as received from GO was synthesized according to simplified Hummer’s method and was well characterized as previously published by Ban, et al. The appropriate pH was adjusted with a dropwise addition of 0.1N NaOH and 0.1N HCl. Deionized water was used in all the experiments [4].
Batch experiments were carried out to study the adsorption of Pb(II) onto GO surface. The parametric effects of GO dose, contact time, pH, and initial Pb concentration were also investigated. 70 mg of GO was added to 20 ml of 15, 20, 25, 40, 50 and 60 mg/L of Pb(II) solutions. The suspensions were agitated at 300 rpm on thermostatic hotplate equipped with magnetic stirrer for 120 min. For the dose effect, 10, 30, 50, 70 and 90 mg of GO were added to 10 ml of 25 mg/L Pb(II) solutions and was the stirred at 300 rpm for 120 min (time study).
For time study, 70 mg of GO was added to 100 ml of 20 mg/L Pb(II), stirred at 300 rpm with magnetic stirrer at 25 °C for 160 min and .5 ml aliquots of slurry was removed at specified time intervals and filtered out directly using what man No. 4. The initial and final concentrations of Pb(II) ions in the solutions were analyzed using an atomic absorption AA spectrophotometer Thermo series S operating with air-acetylene flame and a lead cathode lamp (λ=217.00 nm). Calibration curves have been prepared by several dilution of stock standard solution 1000 mg/L of Pb(II). All the adsorption experiments were performed triplicate to ensure repeatability, the mean values were considered and standard deviation was reported.
The amount of Pb(II) ions adsorbed onto GO surface per unit of mass and the percent sorption of Pb(II) ions were calculated by the following equations:
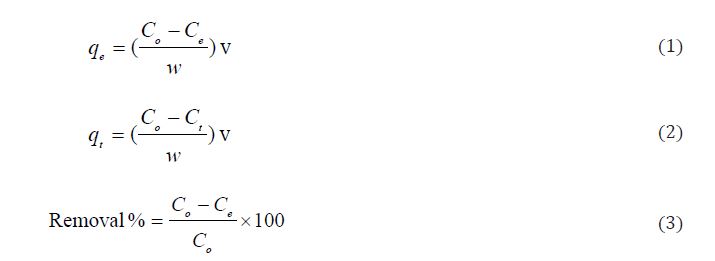
Where: initial Pb(II) concentration (Co, mg/L); Pb(II) concentration at time t(Ct, mg/L), final Pb(II) concentration at equilibrium (Ce, mg/L), volume of Pb(II) solution (v, ml); mass of adsorbent sample (w, mg).
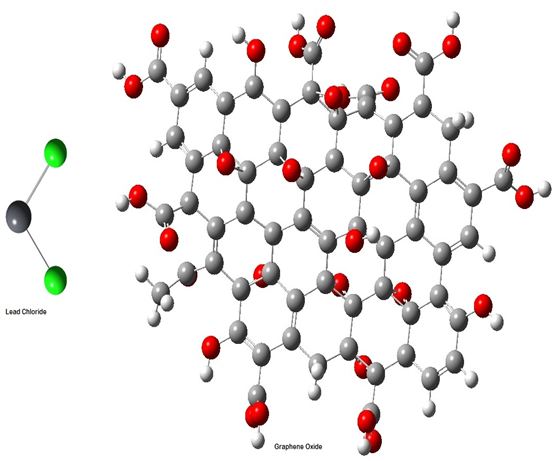
Theorerital calculations for adsoption of Pb(II)-GO were conducted using an Intel Xenon 3.0 Hz workstation with double operating system, 64-bit Windows OS desktop. The starting geometry of molecular coordinates for GO (host) and PbCl2 (guest) were obtained from Cambrige Structural Database (CSD) and viewed using GaussView software (Figure 1). The prepared structures were then fully optimized using semiempirical PM3 method available in Gaussian 03 software packages. Computational quantum mechanics for host/guest interaction in vacuum were carried out using Gaussian 03 software, while host/gust interaction in water interface was performed using Hyperchem molecular modeling software (Version 8.0, Hypercube, Gainesville, FL,USA). Minimization was performed using conjugate gradient algorithm with 0.1 k cal/Amol and further minimized at 0.01 k cal/A-mol [9]. The starting geometries of the inclusion complexes were constructed using HyperChem.
The inclusion interactions were simulated in vacuum and the presence of water molecules were ignored to save computational time. The complexation energy, E, was calculated for the minimum energy structures by the following equation:
where E: binding energy, EGO: energy of (Graphene oxide), and EPbCl2: energy of (PbCl2) represent the total energy of the host-guest complex, the free guest molecule and the free host molecule, respectively. The magnitude of the energy change is an indication of the driving force towards complexation. The more negative the complexation energy change is leading to the more thermodynamically favorable.
Thermo Flam atomic absorption spectrometer (FAAS) S-series with Lead hallow cathode lamp and air acetylene flame was used to determine Lead concentration. The optimum conditions for FAAS were wavelength 217 nm, HCL current 9.5 mA, acetylene flow rate 0.8 I/min, air flow rate 4 I/min and silt 0.5 nm. Standard solutions of Pb were prepared by dissolving 1000 mg/L of Pb in 1.0 mol/L nitric acid. FT-IR using Perkin-Elmer infrared spectrophotometer (IR200) was used to characterize the GO surface in a range of 400-4000cm-1. P H meter (Thermo, Orion 4 star) was used to determine pH value. All the experiments were carried out triplicates. The surface of GO were analyzed by scanning electron microscopy (SEM) in JEOL microscope, model JEOL JSM Nano SEM 400 using an acceleration voltage of 15.0 kV and magnification in ranging from 2000 to 5000.
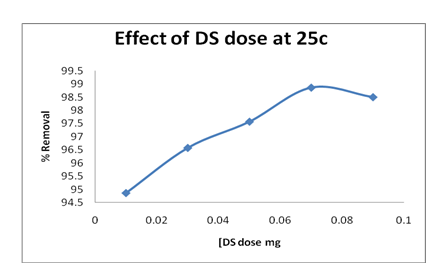
The removal of Pb(II) ions by GO were studied by changing sorbent dosage (0.01, 0.03, 0.05, 0.07 and 0.09 g) at fixed contact time (120 min), initial Pb(II) concentration (25 mg/L), pH (4.11), mixing speed 300 rpm and temperature (298K). The residual Pb(II) concentrations were measured by FAAS after filtration. Figure 5 shows that the removal of Pb(II) ions was increased with an increase in the adsorbent dose. Also, the more GO masses have a different effect and leads to decrease of Pb(II) adsorption. This could be due to the aggregation of adsorbent at high concentration of GO.
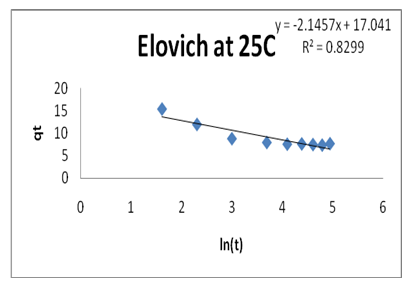
The adsorption kinetics uses to propose the adsorption mechanism. In this study, different kinetic models have been used in order to investigate the mechanism and the potential rate controlling step. The capabilities of Psudo-first-order, Pseudo-second-order, Elovich, intraparticle and extraparticle diffusion models were applied in this study.
Two kinetic models have been used in this study, lagergren Pseudo first-order and pseudo-second-order. First, the lagergren Pseudo first-order equation is:

Where: k1 is the adsorption rate; a plot of ln(qe−qt) versus t gives a straight line of slop and intercept, respectively. The kinetic constants for Pb(II)-GO adsorption are listed in Table 1. The regression value obtained for Pb(II)-GO adsorption was less than 0.9, suggesting that the pseudo-first-order equation does not provide a good fit to experimental data for Pb(II) ions.
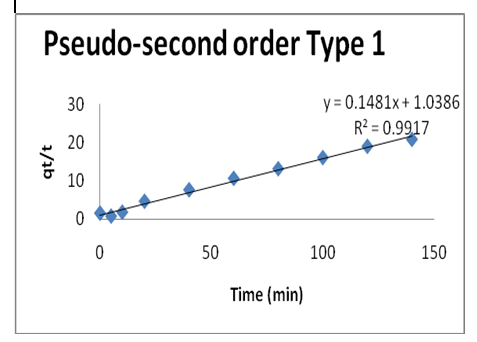
Second, the pseudo second-order kinetic models was used to study the mechanisms of the Pb(II)-GO adsorption by the following equation:

Where: k2 is the adsorption rate constant (g/mg.min). The plot of t/qt versus t gives qe=1/slop and k2=slop2/intercept. The kinetic constants for Pb(II)-GO adsorption are listed in Table 1. This model provides a better fit for Pb kinetic studies with regression R2=0.9917. It can be concluded that pseudo-second-order equation provides the best correlation coefficient (R2). This also confirms that the concentration of Pb(II) and GO involved in the rate determining steps.
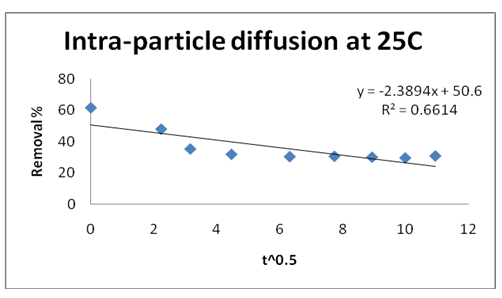
The Weber and Morris internal diffusion kinetic equation was applied.

Where: kdif is intra-particle diffusion rate constant, qt is amount of Pb(II) ions adsorbed per unit GO at time t. the plot of qt versus t0.5 gives kdif = slop and C= intercept. These values are given in Table 1. The regression value was less than unity and did not pass through the origin. Therefore, the rate limiting step was not intra-particle diffusion (Table 1).
The extra-particle diffusion kinetic equation was applied.

Kex is extra-particle diffusion rate constant (1/min), F is qt/qe. The regression value was less than unity and did not pass through the origin. Therefore, the rate limiting step was not extra-particle diffusion.
For the design of adsorption systems, the adsorption isotherms are basic requirements. Different parameters, contact time, GO dose, pH and Pb(II) concentration were used to optimize the adsorption process. Four isotherm models were used to study the experimental data.
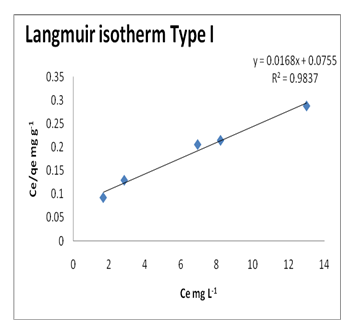
Langmuir equation was used to describe the adsorption data of Pb(II) ions onto the GO surface and to estimate the maximum adsorption capacity corresponding to monolayer coverage of Pb(II) ions on the GO surface. The Langmuir parameters can be determined by the following equation:

Where: qmax is the maximum Pb(II) ions uptake per unit mass of GO (mg/g), Ce is mg/L and b is Langmuir equilibrium constant related to the free energy of adsorption. A straight line plot of Ce/qe versus Ce yields a slope of 1/qm and intercept of 1/qmb.Figure 6 shows the Langmuir plot for the Pb(II)-GO adsorption at room temperature. The qm, b and R2 for Langmuir isotherm are listed in (Table 3). However, a low R2 suggests that the mode of Pb(II)-GO adsorption is not homogenous in nature.
The constant separation factor, RL, is used to study the isotherm shape. The RL values can be evaluated using the following equation:

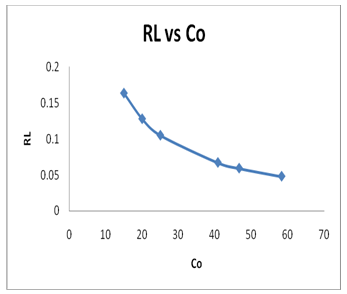
Where: b is Langmuir constant and Co is the initial Pb(II) concentration. RL values between 0 and 1 indicate the favorable adsorption, while RL values >1 or 0 indicate unfavorable adsorption isotherm. However, the RL values at different initial Pb(II) concentrations are listed in Table 2, which between 0 and 1 (Table 2).
These results indicate that the adsorption of Pb(II) ions onto GO surface is a highly favorable adsorption. Also, Figure 7 shows the plot of RL values versus initial Pb(II) concentrations (Figure 7). The RL values were decreased with an increase in the initial Pb(II) concentrations, which indicate the adsorption was favorable at high concentration of Pb(II) ions.
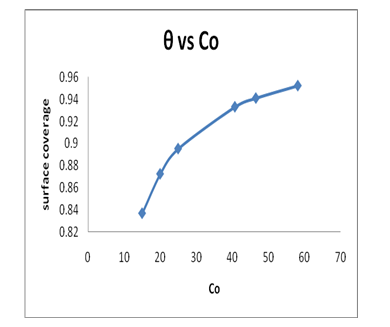
6.2.1 Surface Coverage: Surface coverage is another factor that can be used to understand the behavior of Pb(II)-GO adsorption by the following equation:

Where: KL is Langmuir constant, Co is the initial Pb(II) concentrations and θ is the surface coverage. Figure 8 shows the plot of surface coverage (θ) versus Co. As can be seen from Figure 8, the surface coverage increase rapidly with an increase of the initial Pb(II) concentration. This suggests that GO will be very effective adsorbent for removing the Pb(II) ions from aqueous media.
Freundlich isotherm model in liquid phase was used to study the heterogeneous sorption data and to estimate the adsorption intensity. The Freundlich parameters can be evaluated using as shown below:

Where, KF and n are adsorption equilibrium constants, which indicate the capacity and intensity of the adsorption. Figure 9 shows the Freundlich isotherm plot and the constants are listed in Table 3. The 1/n value was found to lie between 0 and 1, which indicated the favorable adsorption of Pb(II) ions onto GO surface. The Freundlich parameters and R2 for Freundlich isotherm are listed in Table 3. However, a high R2 suggests that the mode of Pb(II)-GO adsorption is heterogeneous in nature. The 1/n value is 0.3573, which indicates that the Pb(II)-GO adsorption is favorable of adsorption process (0.1<1/n<1).
The Dubinin-Radushkevich isotherm, D-R, was used to evaluate the energy (E) evolved from the sorption per molecule and its equation has the following form:

Where: β constant related to sorption energy (mol2.K/J2); ε is Polanyi potential. The plot of ln qe versus ε gives the slop of β (mol2.K/J2) and intercept of qm (mg/g). The energy (Ea) evolved from the sorption per molecule of the adsorbate to the surface of the solid:

The value of E is <8 kJ/mol, which reveals the sorption processes following physical sorption and the value of E is >8 kJ/mol, which reveals the sorption processes following chemical sorption. The D-R parameters and R2 for Langmuir isotherm are listed in Table 3. The obtained value of mean free energy (E) was 2.01 kJ/mol and found to be lower than 8 KJ/mole of Pb(II)-GO adsorption, which is a physical adsorption process. However, a low R2 suggests that the mode of Pb(II)-GO adsorption is not homogenous in nature.
Temkin isotherm model is used to evaluate adsorbent-adsorbate interaction by the following equation:

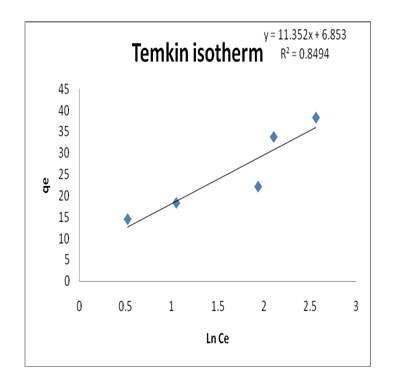
Where, b is Temkin isotherm constant; R is universal gas constant (0.008314 kJ/mol.K), T is temperature (298K), RT/b=B is constant related to heat of sorption (kJ/mol), A is Temkin isotherm equilibrium binding constant (L/g) which is obtained from the Temkin plot (qe versus ln Ce). The low R2 value (R2=0.9096) revealed that the heat of Pb(II)-GO adsorption in a layer did not decrease with the surface coverage of the adsorbate-adsorbent interaction and poorly described by the Temkin model [10].
The correlation coefficients (R2) for the four adsorption isotherms were listed in Table 3. The correlation coefficients from Figure 6,Figure 9,Figure 10 and Figure 11were compared and indicated that the adsorption of Pb(II)-GO was followed Freundlich model (R2 = 0.9740), in comparison to other tested isotherm models (Figure 6,Figure 9,Figure 10 and Figure 11)
Squared sum of errors (SSE) value is commonly used to predict the best-fit among the kinetic models in addition to using coefficient of determination (R2) by the following equation:

Where: qe.expt and qe.cal are the experimental sorption capacities at equilibrium the corresponding value obtained from the kinetic models. The lowest SSE values for kinetic model indicate the best model for particular system.
A monolayer graphene oxide and lead chloride were selected in this study. The computed energy (Ea), van der Waals energy (EV-A) and potential energy (Ep-a)
The behavior of the adsorption process is commonly described through isotherms. The dimensionless separation factor and Langmuir isotherm can be used to study the adsorption behavior. The RL values indicate the isotherm shape to be unfavorable (RL>1), favorable (0
Calculation of the binding energy for frees molecules and initial and final binding energy for inclusion complex: The binding energy for each of PbCl2 and GO molecules and binding energy for PbCl2-GO inclusion complex were calculated using G03 software. The results showed that the energies for the both GO and PbCl2 molecules were found to be equal to -1.1237369 and -0.0633344 hartree, respectively. While, the results showed that the lowest binding energy observe for the complex is -1.204518 hartree, which was confirmed by the study of the optimum energy (Figure 12). Therefore, it is concluded that these parameters are the best for the formation of (PbCl2-GO) inclusion complex. Also, the final binding energy for PbCl2-GO inclusion complex was calculated based on the above findings using equation 4.
However, it was found that the lowest binding energy was found the structure from angles 45o . These values were further confirmed using equation 4. Results showed that the lowest binding energy of the inclusion complex between the guest (Lead chloride) and the host (Graphene oxide) equals to -0.0174467 hartree at angle 45o (Table 4)(Figure 3).
Table 5, it was reported that the lowest bonding distance was founded between Pb1- Cl2 (ligand)---H112- O64 (GO) is 2.38720 A° at angle 45o (Figure 13).
Bonding distance (A°) between carboxylic group in GO and PbCl2 in the molecular inclusion complex is listed in Table 5 Showing the nine bonding distance between the ligand (PbCl2) and the host structure (GO). Those nine bonding distances are Cl2-----Hl12, Cl2-----Cl2, Cl2-----O64, Cl3-----Hl03, Cl3-----Cl8, Cl3-----O50, Pbl----Hl14, Pbl----C39 and Pbl-----O50.

