Monitoring Methylphenidate Dose Effects with AQT in Adults with Attention Deficit Disorder with Hyperactivity: A Validation Study
Background: Previous research introduced a model for monitoring dose effects with incremental increases of immediate-release methylphenidate. In the model, the monitoring process was performed within a three-day period, thereby reducing the potential wait time for dose optimization.
Aims: To validate the use of processing-speed and efficiency measures to monitor the effects of treatment with immediate-release methylphenidate after a short period off medication, using a monitoring protocol described in previous research.
Methods: A Quick Test of Cognitive Speed – AQT monitored the effects of incremental doses of immediate-release methylphenidate in 21 previously medicated adults with attention-deficits hyperactivity disorder - ADHD. Processing speed was evaluated with previously prescribed medication, no medication, low-dose (10/20 mg) and high-dose (20/40 mg) methylphenidate hydrochloride (Medikinet IR).
Results: Twenty patients responded to treatment and one-way ANOVA indicated significant main effects for color, form and color-form naming. Post-hoc analyses showed statistical differences between the no- and high-dose medication conditions for color and form. For color-form naming, there was a significant difference between the no-medication and low-dose and no-medication and high-dose conditions. There was no statistical difference between the low- and high-dose conditions..
Conclusions: The results validated the previously tested dose-monitoring protocol. High-dose methylphenidate normalized cognitive speed for color-form naming, measures of attention, working memory and set shifting, and processing efficiency (i.e., shift cost) for all participants. The results suggest that the protocol may provide quantitative measures of aspects of cognition that may complement behavioral- and self-ratings.
Keywords: ADHD; AQT processing speed; Adults; Methylphenidate IR effects
Processing-speed and set shifting deficits are recognized to be a part of the ADHD symptomatology in children, adolescents and adults [1-3]. These deficits reflect reductions or fluctuations in attention, working memory or cognitive control and can be monitored to quantify improvements as a result of pharmacological treatments. Finding reliable, quantifiable measures for dose monitoring has become of increasing interest to psychiatrists and allied health professionals in clinical practice. Several clinical studies suggest that processing-speed measures, as proxy measures of attention, working memory and set shifting, might be incorporated in day-to-day clinical practice to monitor the effects of pharmacological treatment for ADHD in adults [1-7]. These tests may serve to complement other tests and measures that have been found appropriate for documenting cognitive changes associated with effective treatment of ADHD. Among accepted measures are the Stroop, working memory measures of the ability to process and store visual-spatial information, and functional magnetic resonance imaging [1,9,10].
Of the commonly used processing-speed tests, the Stroop color-word test shows the greatest similarity to the AQT processing-speed tests and the original version provided the impetus for the earliest version of the AQT test [11]. It contained the color, form and color-form naming tests, but with fewer stimuli in each test than in the current version. The tests were originally used in clinical practice with patients with transient ischemic attacks, for whom the written words used in the Stroop no longer provided a source of inhibition. For children and adults with ADHD, research in which the Stroop assessed the effects of methylphenidate has indicated significant improvements in processing and naming speed, but not in the measures of inhibition [1,4].
The AQT dual dimension color-form naming measure has been found to be associated with bilateral activation of the posterior temporal-parietal and subcortical regions, and with concurrently decreased activation of the orbital-frontal regions [12-14]. The regions of activation have been reported to be essential for visual working memory, set shifting and cognitive control, executive dysfunctions commonly found in ADHD [15-17]. The AQT tests have been norm-and criterion referenced for ages 15-90 years [18-20]. They show high test-retest reliability, minimal changes associated with learning or habituation with repeated trials, and minimal changes (about 1 s per decade) as a function of increases in age [13,14,19,20].
The processing-speed tests (color, form, and color-form) have been used in previous studies of the ADHD symptomatology and of the effects of pharmacological interventions on cognitive speed and processing efficiency [5-8]. These studies indicated significant statistical differences in the response patterns of adults with ADHD and with psychiatric disorders without ADHD, and neuro-typical adolescents and adults [5,6]. Studies have also explored whether the tests might quantify improvements in cognitive speed and processing efficiency (shift cost) as a results of receiving prescribed ADHD medication (Concerta, Ritalin, Medikinet) or immediate-release methylphenidate in controlled, incremental doses (Medikinet IR) [7,8]. One study used the AQT processing-speed measures with medication-naïve adults, who were not previously diagnosed or had received ADHD specific medication, and administered the tests without and with prior prescribed doses of methylphenidate IR [7]. The outcomes indicated that cognitive speed, measured by color-form combination naming, and processing efficiency (shift cost), measured by an index that used the formula [color-form s – (color s + form s)], improved significantly with the prescribed medications and dosages. An important limitation of the study was that the methylphenidate IR doses were not controlled and that the effects were only evaluated for medication at the prior prescribed dose levels. A second limitation was that the setting was an urban, regional psychiatric clinic that served adults with multiple comorbidities and often with histories of prolonged substance use disorders. This led to controlled-medication monitoring study, in which a standard test protocol introduced incremental doses of Medikinet IR on a set time schedule [8]. We first assessed processing speed after a two-day period without medication and then performed repeated measurements during a period of a few hours after ingestion of first a low-dose and then of a second low-dose of methylphenidate IR. Participants in the study had received ADHD specific medication for at least 6 mo. prior to the beginning of the study and none exhibited substance use disorders (SUD) during the time of the study. We hypothesized that the controlled, incremental doses would result in significantly improved cognitive speed (color-form naming), and that the associated shift costs would decrease significantly; hypotheses that were confirmed by the findings [8].
The aim of the present study was to replicate and validate the dose-monitoring protocol used previously, through independently conducted research in a different regional setting of Sweden and with different patients and psychiatric staff [7]. We hypothesized that the study would generate similar results to those obtained in the original dose-monitoring study, and that they might validate the clinical utility of the AQT dose-monitoring protocol for potential clinical use.
Twenty-one patients, 16 males and 5 females, aged 21-60 years (M = 37.5; SD = 13.6) and with education ranging from 8-17 years (M = 12.4; SD = 2.3), participated in this study. All were recruited specifically for the study, which took place at a regional psychiatric center as part of an annual medical review. Twenty patients were diagnosed with ADHD of the combined type (F90.0B) and one with ADHD of the inattentive type (F90.0C) and only two (9.5 %) exhibited comorbidities in the form of depression (F32.0). All were diagnosed according to Swedish standards and were taking prescribed variants and doses of methylphenidate (Concerta, Medikinet, or Ritalin) for from 7 to 48 months prior to the study. Criteria for inclusion of participants in the study included (a) absence of evidence of substance abuse disorder (SUD), psychosis, uncontrolled diabetes or thyroid dysfunction, or color blindness, (b) IQ of 80 or above, (c) use of Swedish as the primary language, and (d) a diagnosis of ADHD obtained according to Swedish standards. Intake procedures at the time of diagnosis consisted of basic assessment or in-depth psychological evaluation. Behavioral rating scales, including ADHD-ASRS-v.1.1 and Brown’s ADD Scales were administered to all participants [21,22]. The extended psychological evaluation included WAIS-IV measures of verbal and non-verbal intelligence, working memory and performance speed [23]. The D-KEFS Color-Word Interference and Trail Making Test and T.O.V.A were also administered in most cases [24]. Sixteen patients (73%) received in-depth psychological evaluations and five basic evaluations at the time of diagnosis [25]. At intake, ADHD-ASRS-v.1.1 self-ratings ranged from 20-63 (M = 39.07; SD = 12.83). Comparison of Global SE ratings before and after treatment resulted in positive changes that ranged from 1.5-8.0 (M = 5.20; SD = 2.05), indicating improvements in the patients’ perceptions of the severity of symptoms. Authorities in the Region Kronoberg approved the study, and all participants signed informed consent forms in accordance with the Declaration of Helsinki.
The AQT color, form and color-form naming tests were administered individually to monitor the incremental methylphenidate dose effects on perceptual and cognitive processing speed and processing efficiency [12]. Of the tests, color and form naming require rapid naming of 40 randomly sequenced colored squares (black, blue, red, yellow) or black forms (circle, square, line, triangle), and color-form naming requires naming of combinations of these (i.e., black circle). The two single-dimension tests (color, form) measure reaction, retrieval and response time (perceptual speed). The dual-dimension test (color-form) measures perceptual speed plus overhead imposed by shift costs that reflect added demands on attention, working memory, and cognitive control. We calculated the overhead, the measure of processing efficiency, by adding the naming times (s) for color and form and subtracting these from the color-form naming time, using the equation [color-form – (color + form)]. The tests have been validated against commonly used neuropsychological tests [26].
The color, form and color-form tests were administered during scheduled annual reviews and a psychiatrist administered the tests over a period of 3-4 days. The first administration evaluated processing speed in three trials, when the patients were on their physician-prescribed stimulant medications, primarily Concerta or Ritalin (71% of patients). The second administration of three trials occurred after two days (weekend) without prescribed stimulant medication to obtain a non-medicated baseline. On the same day, patients ingested two equal doses of immediate-release methylphenidate hydrochloride tablets (Medikinet IR), either 10 mg, equivalent to 8.65 mg methylphenidate, or 20 mg, equivalent to 17.39 mg methylphenidate. For the low-dose treatment condition, patients ingested a 10 mg tablet, if the prior methylphenidate dose was less than 40 mg, and 20 mg, if the prior dose was 40 mg or larger. The AQT tests were then administered in three trials between 45-55 min after ingestion of the low-dose of Medikinet IR (10/20 mg). For the high-dose treatment condition, patients ingested an added 10 or 20 mg Medikinet IR tablet and the tests were re-administered in three trials between 45-55 min after ingestion of the medication. In the total group six (29%) received a maximum dose of 20 mg, and 15 (71%) a maximum dose of 40 mg Medikinet IR.
With three processing speed measures for each treatment condition, it was determined a priori to use the second naming-time measure to represent the over-all performance. This would ensure that the naming process was familiar and that any learning factors would be minimized. One-way ANOVA with post-hoc analysis (Scheffe), using StatPlus: macPro v5.9.92 (Analyst Soft Inc., Walnut, CA), compared group means for each processing speed measure obtained for each treatment condition. Shapiro-Wilks W tests of normality were performed for all naming time measures, and normality was rejected for several distributions and naming times were subjected to lognormal (ln) transformation for statistical analyses. Null hypotheses were rejected at a priori set p < 0.01 levels of significance to minimize positive bias.
Prior to the statistical analyses, patient records were examined to identify responders and non-responders to the low- and high-dose medication conditions. One patient (5%) was excluded as a non-responder, because naming times changed minimally for color, form and color-form (i.e., within +/-3 or +/-5 s,) across treatments. Without medication, color-form naming time (40 s) and overhead (shift cost) (1 s) were well within the normal range (i.e., < 50 s and < 5 s, respectively) [11,12,19]. As a comparison, 18% were identified as non-responders in the previous dose-monitoring study [7]. Two patients (9.5%) in this study exhibited comorbid depression, compared to 28%, who exhibited comorbid depression in the original study [7]. The difference in the proportions of non-responders may in part reflect the larger sample size in the original study (n = 40) or differences in the proportions of comorbidities in the two studies.
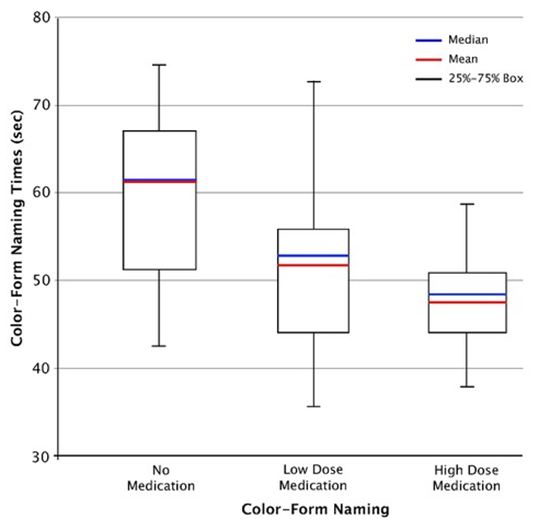
Twenty patients responded to medication based on changes in color-form naming times across treatments that were larger than one standard deviation (i.e., > 6 s) for typical age-level peers [11,12]. Without medication, the naming-time means (s) for responders (n = 20) for color and form were at the upper limits of the normal range compared to neuro-typical adults ages 18-54 year (i.e., < 25 s and < 30 s, respectively) [11,17] (Table 1). The mean for color-form naming (61.40 s) was in the slower-than-normal range (i.e., > 55 s/ + 2 SD) [11,17]. The current mean for color-form naming without medication was comparable to the corresponding mean for responders (58.97 s) in the prior dose-monitoring study [7].
For the low dose condition, the naming times for color, form, and color-form were within the normal range and the means were further reduced and were well within the normal range for the high-dose condition [11,17]. The mean naming times for the high-dose condition were also comparable to those reported in the prior study (20.45 s for color, 22.39 s for form, and 44.06 s for color-form) [7]. Figure 1 shows whisker plots, with suppression of outliers, for the distributions of color-form naming times for the no-medication, low-medication and high-medication conditions.
One-way ANOVA with post hoc analysis (Scheffe) of the lognormal time measures indicated significant treatment effects for all variables (Table 2). The effect sizes for color (η (2) = 0.21) and form (η (2) = 0.24) were in the low range and for color-form naming (η (2) = 0.26) in the medium range. Post hoc analyses (Scheffe) indicated that color, form and color-form naming times were significantly longer for the no-medication than for the high-dose mediation conditions, (p < 0.01), but that there were no statistical differences between the low- and high-dose medication conditions. These findings essentially concur with those of the original dose-monitoring study [7]. However, the effect sizes for color (0.21), form (0.24), and color-form (0.26) proved somewhat larger in this than in the original study (i.e., color 0.10, form 0.11, and color-form 0.20) [7]. The difference in treatment-effect sizes may reflect the larger sample size in the original study or the differences in the comorbidity rates mentioned earlier.
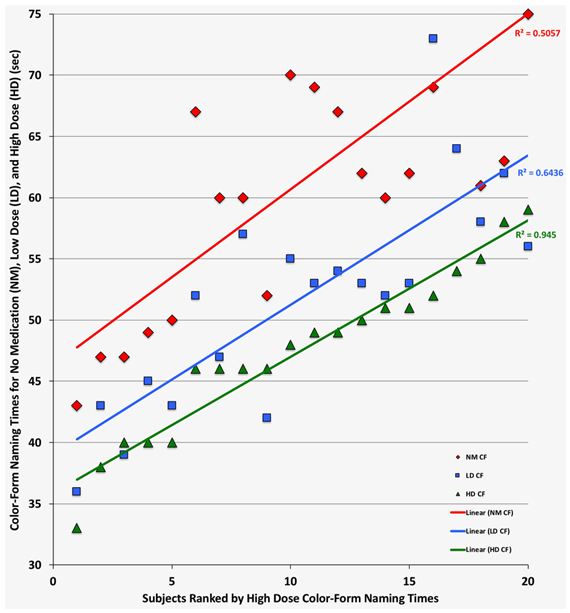
The increases in perceptual speed between no-medication and high-dose medication were on average 19% for color and 22% for form naming. These gains were practically identical to the average increases in perceptual speed (18% for color and 23% for form) observed in the previous dose-monitoring study [7]. In contrast, the average increase in cognitive speed of 23% in this study was considerably larger than that of 14% observed in the original study [7]. Figure 2 provides linear regression plots of the individual color-form naming times for responders for the no-medication, low-dose and high-dose medication treatment conditions. Naming times were ranked based on the high-dose measures and with suppression of color-form naming times longer than 80 sec. Comparison of the regression lines for the no-medication, low-dose and high-dose medication conditions indicates that dose optimization and normalization of cognitive speed (i.e., < 60 s or + 2 SD) was achieved by all with high-dose medication and by 10 adults (48%) with low-dose medication (i.e., within < 5 s difference). In the original study, dose optimization and normalization of cognitive speed was achieved with low-dose medication for seven participants (21%) [7].
For the shift cost [CF – (C + F)], the measure of processing efficiency, the values ranged from 0-20 s (M = 7.80 s; SD = 5.30 s) for the no-medication condition and this cost was larger-than-normal (i.e., > 5 s) for 16/21 patients (76%), compared to that reported for neuro-typical adults ages 18-54 [11,19]. For the high-dose medication condition, the shift cost values ranged from 0-11 s (M = 3.80; SD 3.12) and approximated that reported for neuro-typical typical adults (i.e., < +/- 5 sec) [19]. The difference between the overhead values for the no-medication and the high-dose medication conditions proved significant (F1, 38 = 9.59; p = 0.008; η (2) = 0.17). Comparatively, the greatest relative improvement between the no- and high-dose medication conditions occurred for processing efficiency (shift cost). In the high-dose medication condition, the average shift cost was reduced to within normal limits (i.e., < 5 s) for all responders and processing efficiency was increased by 51%, compared to 25% in the previous study [7]. The differences in the proportional improvements in cognitive speed and processing efficiency in the two studies may reflect the nature of comorbidities or neuro-psychiatric conditions that were not specifically accounted for in the original dose-monitoring study [7].
We evaluated the associations between the AQT single- (color, form) and dual-dimension (color-form) processing-speed measures for the no-medication and high-dose medication conditions. Without medication, the correlation (Pearson r) between color-form and color was r = 0.70 and for form r = 0.78. For the high-dose medication condition the corresponding correlations were r = 0.66 between color-form and color and r = 0.74 for form. There were no statistical differences between these measures in either condition, indicating that they contributed about equally to the cognitive speed measure. In the previous study, color showed significantly greater contributions to cognitive speed in the no-medication and high-dose medication conditions (r = 0.70 and 0.72, respectively) than form naming (r = 0.53 and 0.50, respectively) [7]. The difference may reflect the nature of the samples or other unaccounted for characteristics.
We also explored the relationship between gains in color-form naming times (cognitive speed) between the high-dose and no-medication conditions. The mean gain in cognitive speed was 14.40 s (SD = 8.20 s) and the correlation between the size of gains and the no-medication color-form naming times was r = 0.62 (p= 0.004; Cohen’s d = 1.52). The predictive relationship between gains in cognitive speed indicated that relatively slower cognitive speed (i.e., longer naming times) without medication was associated with relatively greater gains with high-dose medication.
Case-level analysis compared the naming times for the low- and high-dose conditions, to identify color-form changes < 5 s, and indicated that 10 responders (48%) reached optimum naming times after ingesting the low-dose medication. This compares with 8 responders (24%), who reached optimum naming times with low-dose medication in the original study [7]. We identified an outlier in this study, who required 94 s to name the color-form stimuli without medication and 53 s after high-dose medication, indicating an increase in cognitive speed of 44%. An outlier in the original study required 120 s for color-form naming without medication and 58 s with high-dose medication, indicating an increase in cognitive speed of 52% [7]. In spite of the atypically slow cognitive speed without medication (i.e., > + 3 SD), both outliers experienced a normalization of cognitive speed to less than 60 s (i.e., < +2 SD). This suggests that even in the presence of severe cognitive-speed deficits with un-medicated ADHD, cognitive speed may be normalized with methylphenidate, a hypothesis that warrants further investigation.
We applied criterion-referenced cut-off time criteria for normal performance to the individual processing-speed measures of the responders. As a result, 85% were identified by greater-than-typical or atypical processing-speed values for form, color-form or shift costs (overhead), or combinations of these, indicating acceptable levels of sensitivity. This corresponds well with the proportion of patients (82%) identified by applying the same criteria in the original monitoring study [7]. In both instances, all participants had received methylphenidate for an extended period prior to the dose-monitoring study, and no one presented with a substance use disorder (SUD). The sensitivity levels observed in this and the earlier dose monitoring study of previously medicated patients were lower than the 91% and 93 % levels reported in earlier studies of medication-naïve patients [4-7]. The differences might be explained by the fact that the methylphenidate used for a prolonged period of time by patients in this and the earlier dose-monitoring study may have had a normalizing effect on gray matter volumes or functional connectivity [7,27,28].
The study has limitations related to the small sample size (n = 20) and the variations in the diagnostic processes (i.e., in-depth v basic psychological evaluation). While one-fifth of the participants in the previous monitoring study received in-depth psychological evaluation, the proportion (73%) was larger in the current study [7]. It is also a limitation that possible relationships with the commonly used neuro-psychological ADHD assessments used in the in-depth psychological evaluations were not explored. We made no distinction between ADHD, predominantly inattentive (ADHD-PI), and predominantly hyperactive or combined (ADHD-C) types. This may be a limitation as subtypes may differ in regions of gray matter volume or the degree of connectivity between specific regions of the brain [29,30]. However, this limitation may have resulted in only minimal differences in the effects of treatment, as suggested by Reimherr, et al. [31]. The gender distribution in the current study was biased towards males (80%) and this may have resulted in differences in the ADHD symptomatology before medication with methylphenidate, as males are known to show higher degrees of impulsivity than females [31,32]. Whereas the AQT tests do not show gender bias in neuro-typical adolescents and adults, there may be a gender bias in the non-medicated responses of adults with ADHD to the color-form naming test, the measure of cognitive speed, a possibility that should be explored in future studies [18].
The findings of this medication-controlled study replicated a previous study of the effects of incremental doses of immediate-release methylphenidate (Medikinet IR) on processing speed (color, form, and color-form naming) and efficiency (shift cost) [7]. We hypothesized that the cognitive speed (color-form) and efficiency (overhead) measures would prove most sensitive for quantifying incremental effects of increasing methylphenidate doses, and the outcomes supported the hypothesis. In this and the original study, cognitive speed and processing efficiency (shift cost), measures of attention, working memory and set-shifting, established to be associated with bilateral activation of the temporal-parietal and subcortical regions of the brain and to reflect functional connectivity were normalized for every responder to medication [7,11-16]. Both studies shared the finding that the low-dose medication resulted in normalization of cognitive speed and processing efficiency for a considerable proportion of the responders. These findings suggest that the AQT dose-monitoring procedure might be able to identify the dose point at which normalization of cognitive speed and processing efficiency (shift cost) occurs after a controlled methylphenidate dose increase. In combination, this and previous studies suggest that AQT can provide objective measures that may assist to achieve dose optimization during pharmacological treatment [6,7]. It should be noted that the dose-monitoring protocol used in this and the original study was designed for use with immediate-release methylphenidate and was administered over a short period of time [7]. These factors impose limitations for direct clinical application of the methodology. The protocol may be adapted for use with modified-release stimulant medication, a more commonly used variant of methylphenidate. As one aspect of the modification, the assessment of methylphenidate treatment effects may be conducted with weekly intervals rather than at hourly intervals to provide a more realistic clinical scenario.
Jan Gustafsson, Director of Education, Evolan Pharma AB, Danderyd, Sweden supported the study with coordination of the independent dose-monitoring studies in Västervik/Vimmerby and Wäxsjö/Ljungby, Sweden. Evolan Pharma AB provided funding for patient participation and experimental medication to the Wäxjö/Ljungby in Region Kronoberg.
Dr. Göran Magell and Jan Gustafsson report no conflicts of interest. Dr. Niels Peter Nielsen and Professor Elisabeth H. Wiig are co-authors of A Quick Test of Cognitive Speed (AQT), with the copyright held by AQT Assessments ApS, Copenhagen, Denmark.