Nanotechnology as a New Direction in the Creation of Antimicrobial Drugs
The influence of basic physical factors caused by magnetite nanoparticles (constant magnetic field and sorption) on microorganisms by examining the reactions of the intensity of free radical lipid peroxidation (FRLP) and bacteriostatic action was studied. It was well established that the magnetite nanoparticles caused unequal reaction in intensity of FRLP on different groups of microorganisms. It was determined that the most significant factor that influenced on the ultimate indicator of the intensity of luminescence on Candida albicans, Escherichia coli and Pseudomonas aeruginosa was constant magnetic field which induced by nanoparticles. On the contrary, sorption was the most significant factor on Staphylococcus aureus. It was found that the rate of consumption of free radicals lipid reduced reliably on all microorganisms after their processing by magnetite nanoparticles. The results of microbiological studies of Escherichia coli, Klebsiella pneumoniae and Staphylococcus aureus showed that bacteriostatic effect was detected after exposure by magnetite nanoparticles. Visually, it was detected by decreasing the number of colonies on the nutritious medium in comparison with the control. It was revealed an interesting fact that saline NaCl, which had previously been processed by magnetite nanoparticles also significantly, had a marked bacteriostatic effect on the studied microorganisms. This effect could be explained by mechanism of change the polarization structure water of microorganisms by magnetite nanoparticles. It was discovered that degree of expression of bacteriostatic action which induced by magnetite nanoparticles had correlation with marks of reactions intensity of FRLP. Maximum bacteriostatic effect on Staphylococcus aureus was expressed in second variant application of magnetite nanoparticles where mechanism of sorption was more significant than action of the magnetic field. On the contrary, maximum bacteriostatic effect on Escherichia coli and Klebsiella pneumoniae was revealed in third variant, where time exposition of contact with microorganism’s nanoparticles and, consequently, action of a constant magnetic field was determinative.
Keywords: Magnetite Nanoparticles; Microorganisms; Free Radicals Peroxidation Lipids; Polarization Structure; Bacteriostatic Effect
Today the world’s attention is locked on the problem of bacterial resistant to antibiotics-one of the most serious threats to humanity. Bacterial infections are a major cause of chronic infections and mortality. Antibiotics have been the preferred treatment method for bacterial infections because of their cost-effectiveness and powerful outcomes. However, several studies have provided direct evidence that the widespread use of antibiotics has led to the emergence of multidrug-resistant bacterial strains. In fact, super- bacteria, which are resistant to nearly all antibiotics, have recently developed due to abuse of antibiotics. Studies have shown that these bacteria carry a super-resistance gene called NDM-1 [1]. The major groups of antibiotics that are currently in use have three bacterial targets: the cell wall synthesis, translational machinery, and DNA replication machinery. Unfortunately, bacterial resistance can develop against each of these modes of action. The mechanisms of resistance include expression of enzymes that modify or degrade antibiotics, such as β-lactamases and aminoglycosides, modification of cell components, such as the cell wall in vancomycin resistance and ribosomes in tetracycline resistance, and expression of efflux pumps, which provide simultaneous resistance against numerous antibiotics [2-4]. Most of the antibiotic resistance mechanisms are irrelevant for nanoparticles (NPs) because the mode of action of NPs is direct contact with the bacterial cell wall, without the need to penetrate the cell; this raises the hope that NPs would be less prone to promoting resistance in bacteria than antibiotics. Therefore, attention has been focused on new and exciting NP-based materials with antibacterial activity. Chief Medical Officer, Dame Sally Davies, warned that if this problem didn’t solved than in 20 years’ time even minor surgery might lead to death through untreatable infection. In Britain, in spite of greatly reducing hospital infections from bugs such as MRSA (methicillin resistant Staphylococcus aureus) and clostridium difficile to the levels of 10 years ago-falling by 80 per cent-they were being replaced by opportunistic bacteria such as Escherichia coli and Klebsiella pneumoniae, which became one of the most frequent agents of nosocomial infections.
About 5.000 patients a year in the UK died from bloodstream infections, half of them caused by drug-resistant organisms. Antimicrobial resistance is a ticking time-bomb not only for the UK but also for the whole world. Many experts believe that in the future all antibiotics would become useless and humanity had to refuse of taking those [5]. Even now, the numbers of new antibiotics have been reduced dramatically. Antibiotic resistance leads to cases when people get sick for a long time, and increases vital infections. Resistant microorganisms also lead to increasing spends of medical aid because of prolongated stay in the clinics and this situation requires treatment that is more intensive. The development of new antibacterial medicines based on nanoparticles is one of the real ways to solve this problem. Nanomaterials are materials that have at least one dimension (1-100 nm) in the nanometer scale range or whose basic unit in the three-dimensional space is in this range [6]. NPs in particular have demonstrated broad-spectrum antibacterial properties against both Gram-positive and Gram-negative bacteria. For example, ZnO NPs were found to inhibit Staphylococcus aureus, and Ag NPs exhibit concentration-dependent antimicrobial activity against Escherichia coli and Pseudomonas aeruginosa [7]. However, the detailed antibacterial mechanisms of NPs have not been thoroughly explained, and the same types of NPs often present contrasting effects. The antimicrobial mechanism of action of NPs is generally described as adhering to one of three models: oxidative stress induction, metal ion release, or non-oxidative mechanisms [8-10]. These three types of mechanisms can occur simultaneously. Certain studies have proposed that Ag NPs prompt neutralization of the surface electric charge of the bacterial membrane and change its penetrability, ultimately leading to bacterial death [11]. Moreover, the generation of reactive oxygen species (ROS) inhibits the antioxidant defense system and causes mechanical damage to the cell membrane. According to existing research, the major processes underlying the antibacterial effects of NPs are as follows: 1) disruption of the bacterial cell membrane; 2) generation of ROS; 3) penetration of the bacterial cell membrane; and 4) induction of intracellular antibacterial effects, including interactions with DNA and proteins.
The first scientific publications on the investigation influence of magnetite nanoparticles on microorganisms appeared in 1998. Reliable information about the bacteriostatic effect of magnetite nanoparticles to certain pathogens was represented. Also, it was discovered that magnetite nanoparticles significantly increase the sensitivity of pathogens to antibacterial medications [12]. Furthermore, an example of studying human erythrocytes showed that the magnetite nanoparticles altered reliably the polarizable structure of the water sector of cell microenvironment and as a result their permeability [13]. Thus, analysis of above-mentioned dates could give us the opportunity of highly optimistic talking about the future development of a new direction-elaboration of antibacterial medications based on magnetite nanoparticles. The mechanism of their action will be associated with changes of physical factors of the cell existence. But today mechanisms of physical influence of magnetite nanoparticles on microorganisms are still poorly understood, and the main purpose of our investigations was to find out them.
The main goal was to investigate the influence of basic physical factors of magnetite nanoparticles on different groups of microorganisms.
3.1 In order to perform this goal next task were set
- To investigate the effect of magnetite nanoparticle on the intensity of free radical peroxidation lipids (FRPL) in various bacterial
cultures
- to explore direct bacteriostatic action of magnetite nanoparticle on microorganisms;
- to study bacteriostatic effect of saline NaCl that had previously been processed by magnetite nanoparticles;
- To establish a causal link between research results and main physical factors of magnetite nanoparticles.
Colloidal solution of magnet-controlled sorbent (MCS-B). The basis of MCS-B is magnetite nanoparticles (Fe3O4). Magnetite nanoparticles have been produced in Laboratory of Applied Nanotechnology of Belousov. Magnet-controlled sorbent was synthesized via the chemical co-precipitation method using sodium hydroxide as the precipitating agent [14].
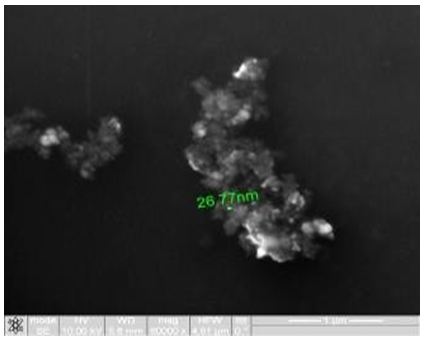
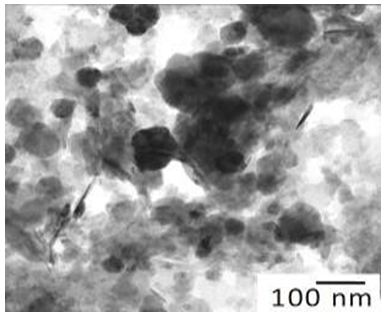
The main physics and chemical properties of MCS-B the following data and also in Tables 1-4; Figure 1 and 2 were presented:
- Concentration of the colloidal solution of magnetite nanoparticles (MCS-B) in physiology solution of NaCl is 0.1%.
- Size of magnetite nanoparticles is 6-12 nm.
- Total area of surface magnetite of nanoparticles Ss = 800-1200 m2/g.
- Magnetization of saturation Is = 2.15 кА/m.
- ζ - potential = - 19 mV.
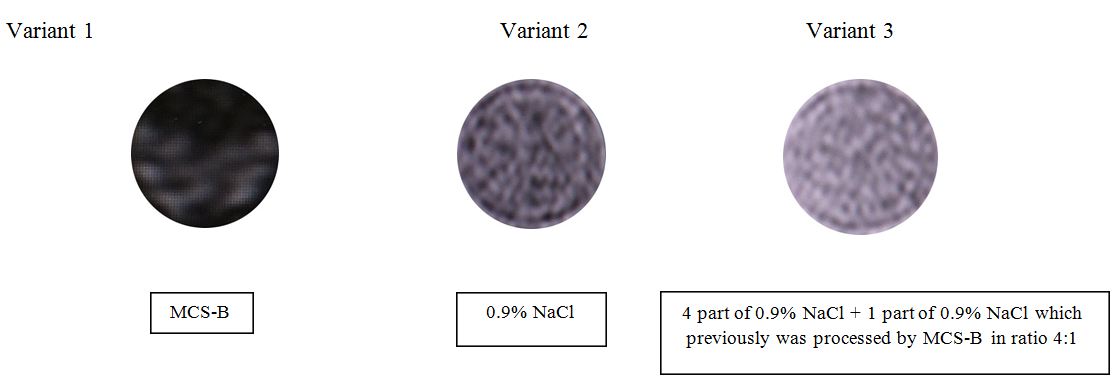
Before starting the experience with microorganisms we used visual assessment by comparison of the brightness of the imagines different variants of solutions. These were: MCS-B, 0.9% NaCl solution and 0.9% NaCl solution that had been treated by magnetite nanoparticles (MCS-B). The tests were performed on the Siemens MR-tomagraphy Magneton Concerto with power magnetic-field 0.2 T. The axial tomograms were received: 1. T1 - the self-weighted sequences of Echo Spin of TR 50 ms, TE 17 ms the field of review the 250 mm, the thickness cut 2 mm. 2. T2 - the self-weighted sequences Echo Gradient of TR 500 ms, TE 17 ms the field of review a 180 mm, the thickness cut 4 mm. MRI are represented in Figure 3.
Figure 3 illustrates the difference of image brightness in liquids compared at the MRI. The order of the brightness increase is the following: MCS-B, 0.9% NaCl solution, 0.9% NaCl solution that was treated by nanoparticles of MCS-B. The difference in brightness of images is explained in the following way:
Variant 1: Magnetite nanoparticles of MCS-B reduce the mobility of hydrogen protons in the liquid medium (0.9% NaCl solution). Therefore, the image brightness was very low in the MRI.
Variant 2: Rising mobility of hydrogen protons in the intact 0.9% NaCl solution increased brightness in comparison with Variant 1.
Variant 3: Mobility of hydrogen protons in 0.9% NaCl solution that has previously been processed MCS-B nanoparticles is maximized. Therefore, the image brightness is much higher than before (in the previous variants).
Thus, previously conducted research clearly shows that the nanoparticles of MCS-B change the mobility and the orientation of the hydrogen atoms in liquids that are registered in the visual evaluation of MRI.
Candida albicans ATCC 885/653, Escherichia coli ATCC 25922, Pseudomonas aeruginosa ATCC 9027, Staphylococcus aureus ATCC 25923, Klebsiella pneumonia ATCC 700603.
Research methods: The intensity of free radical peroxidation lipids (FRPL) was measured by means method of hemiluminescence for installing quantmetric equipment National Science Center “Kharkov Institute of Physics and Technology” with multi-channel photomultiplier PMT-140 [15]. The studied object was placed in thermostatic cuvette at 37 ˚C, which was located at the time measurement of the photomultiplier (PMT) cathode end. The intrinsic noises of the PMT were in the range of 30-70 pulses/sec. The various kinds of hemiluminescencent reaction were used, which allowed to discover the nature of the various content oxygen products of FRPL. Chemiluminescent determination of superoxide anion radical was carried out in the luminol + bacterial medium. In a thermostatic cuvette chemiluminometer placed 1.5 ml 0.075% luminol+0.25 ml of bacterial medium+0.25 ml of a 0.1% solution of magnetite nanoparticles (MCS-B). Induction was carried out by means 0.05 ml 3% Н2О2. Intensity of FRPL was determined at three stages: I stage-I max determined, II stage-I final, III stage-the sum of light Σ. Preparation of bacterial cultures. After 24 h bacterial cultures growth on Mueller-Hinton agar was made microbial suspension in saline NaCl with scale McFarland appropriate 0.5. Then the initial concentration of working culture was titrated to concentration corresponding to 104. Sowing S. aureus was carried out on Mueller-Hinton medium; E. coli and K. pneumoniae - on Endo medium.
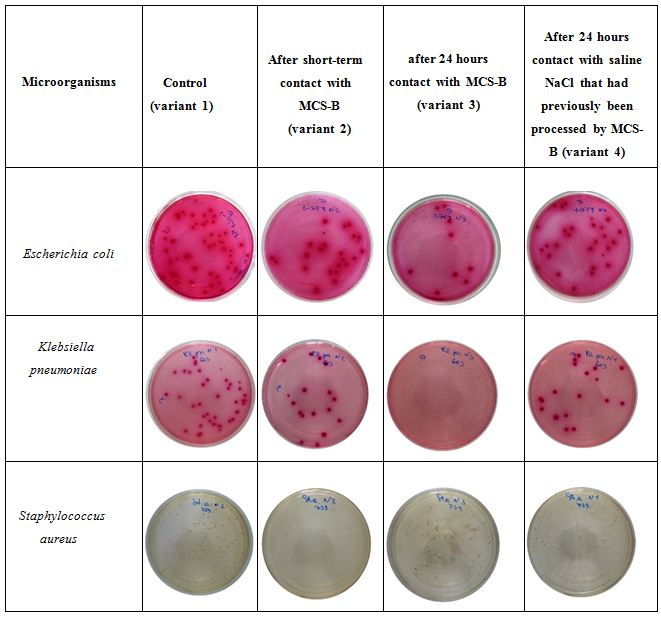
Bacteriostatic effect has been studied in the following variants: variant 1-control; variant 2-the study of bacteriostatic action of magnetite nanoparticles (MCS-B) after their short-term contact with microorganisms; variant 3-after 24 hours contact of microorganisms with MCS-B; variant 4-after 24 hours contact of microorganisms with saline of NaCl, that had previously been processed by MCS-B. Estimate was carried out in comparison with the control.
Statistically processing the obtained results was performed by parametrical method of variation statistics by Student criterion. Data were expressed as SD (standard deviation).
The results of the research intensity of FRPL in various bacterial mediums are presented in Table 5.
I max-intensity first flash luminescence (imp/sec) after the introduction of Н2О2 in the first minute. The maximum value of the first flash gives an indication of the total number of peroxidation products in the substrate.
I final-ultimate intensity of luminescence (imp/sec) after 4 minutes. This index corresponds to the amount of the remaining unreacted peroxidation products or antioxidants.
Σ - sum of light in 4 minutes measurement. This index indicates to rate of consumption of the lipid nature free radicals in consequence their interaction with antioxidants.
The date in Table 5 showed that intensity of the first flash of luminescence after the introduction of H2O2 (I max) for all studied microorganisms after processed by magnetite nanoparticles was (p<0.001) reduced reliably by 2-2.5 times in comparison with the control. This happened due to a decrease in the total amount of lipid peroxidation products as a result of adsorption by magnetite nanoparticles [16].
However, it was not determined reliable differences at stage II of the I final index in compared with control on microorganisms such as Candida albicans, Escherichia coli and Pseudomonas aeruginosa (p>0.05). On the contrary, I final index differed reliably (p<0.001) from the control on Staphylococcus aureus. This fact indicated that the sorption activity of magnetite nanoparticles in the bacterial culture of Staphylococcus aureus was more important factor in the physical action than the effect of a constant magnetic field.
Stage III study (determine Σ - sum light in 4 minutes) demonstrated that after processed of bacterial medium by magnetite nanoparticles the consumption speed of free radical lipid was reduced reliably on all microorganisms. This fact was connected with sorption effect that supplemented by the action of the magnetic field of the nanoparticles. The constant magnetic field that induced (power of 300-400 kA/m) deprotonated (transfer in active status) enzymes of antiradical defend. As a result the synthesis of lipid peroxides and secondary radical reactions were blocked, inhibited lipid peroxidation [17].
Indicators the decline in the intensity of free radical peroxidation in bacterial cultures were supplemented with data from research of bacteriostatic action of magnetite nanoparticles (Figure 4).
Figure 4 could demonstrate that bacteriostatic effect on bacterial cultures such as E. coli and K. pneumonia was determined after 24 hours exposition of magnetite nanoparticles with microorganisms. As a result there was significant decline in the number of colonies on the nutritious medium. Maximum bacteriostatic action on S. aureus was found in the variant of short-term contact with nanoparticles of microorganisms (variant 2). Taking into account the demonstration of pronounced bacteriostatic effect quantified analysis in terms of cell counts was impractical to perform (Figure 4).
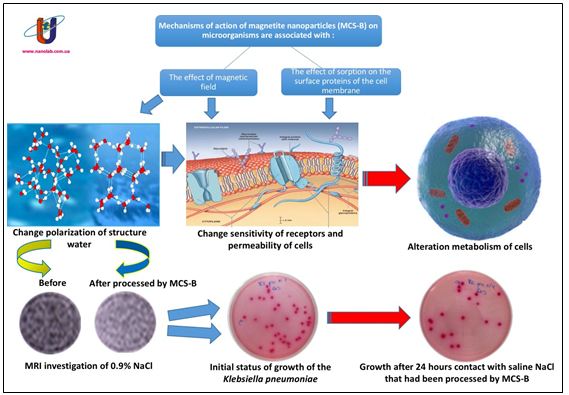
If mechanism of bacteriostatic effect in the second and third variants could be explained from position of the sorption activity of nanoparticles, in the fourth variant, where microorganisms contacted only with saline NaCl, which had previously been processed by nanoparticles, the sorption action was excluded. The mechanism for this effect was explained by increased mobility of the hydrogen protons and changing their spatial orientation after processed by magnetite nanoparticles. As a result, the polarizable structure of the cell water was modified and changed its permeability [18]. After analyzing all received data of research, we made a conclusion that degree of expression of bacteriostatic action had correlation with marks of reactions intensity of FRLP. So, maximum bacteriostatic effect on Staphylococcus aureus was expressed in second variant application of magnetite nanoparticles where mechanism of sorption was more significant than action of the magnetic field. On the contrary, maximum bacteriostatic effect on Escherichia coli and Klebsiella pneumoniae was revealed in third variant, where time exposition of contact with microorganisms nanoparticles and, consequently, action of a constant magnetic field was determinative. Received data confirmed the strength of influence of magnetic field caused by the nanoparticles on the structure of water by the fact of bacteriostatic action of saline NaCl, which had previously been processed by magnetite nanoparticles. Thus, it was found effects of the basic physical factors of magnetite nanoparticles (constant magnetic field and sorption) on different groups of microorganisms and fact that both factors had an impact on microorganisms, but determined influence of different factors would depend reliably on the individual properties of studied microorganisms (Figure 5). In- depth analysis of the mechanisms of microbial reactions, the study of the causes of differences in the effects are the next objectives.
1. It was expanded the range of studying the mechanisms of the influence of physical factors of magnetite nanoparticles on microorganisms by examining the reactions intensity FRPL and bacteriostatic action.
2. It was established reliably that magnetite nanoparticles on different groups of microorganisms caused unequal intensity
FRPL reaction.
3. It was determined that more significant factor that influenced on the ultimate indicator of the intensity of luminescence on Candida albicans, Escherichia coli and Pseudomonas aeruginosa was constant magnetic field which induced by
nanoparticles. On the contrary, sorption was the most significant factor on Staphylococcus aureus.
4. It was found that the rate of consumption of free radicals lipid reduced reliably in all microorganisms after their
processing by magnetite nanoparticles.
5. The results of microbiological studies of Escherichia coli, Klebsiella pneumoniae and Staphylococcus aureus showed that bacteriostatic effect was detected after exposure by magnetite nanoparticles. Visually, it was detected by decreasing the number of colonies on the nutritious medium in comparison with the control.
6. It was revealed an interesting fact that saline NaCl, which had previously been processed by magnetite nanoparticles
also significantly, had a marked bacteriostatic effect on the studied microorganisms. This effect could be explained by mechanism of change the polarizable structure water of microorganisms by magnetite nanoparticles.
7. It was discovered that degree of expression of bacteriostatic action which induced by magnetite nanoparticles had
correlation with marks of reactions intensity of FRLP. Maximum bacteriostatic effect on Staphylococcus aureus was
expressed in second variant application of magnetite nanoparticles where mechanism of sorption was more significant than action of the magnetic field. On the contrary, maximum bacteriostatic effect on Escherichia coli and Klebsiella pneumoniae was revealed in third variant, where time exposition of contact with microorganisms nanoparticles and, consequently, action of a constant magnetic field was determinative.