Plastic Waste Generation and Source Separation by Tertiary Students: A Case Study on a University Campus in Ghana
In recent years the continuous growth of the students’ population in Ghanaian universities have had its resultant effects on waste volumes and type of solid waste generated on campuses and its management. This study was conducted in one of the halls of the University for Development Studies to assess plastic waste generation, separation efficiency and the subsequent revenue that can be generated from the separated waste on the campus. Daily waste separation as well as a waste characterization study was conducted in the hall involving students for 14 days. The total amount of solid waste realized for the study period was 565.2 kg with an average daily waste generation rate of 40.37 kg and a per capita generation rate of 0.20 kg per person daily. Plastic waste accounted for about 38.35% of the total solid waste generated thus 216.73 kg. The average daily plastic waste generation rate was 15.48 kg with a daily per capita generation rate of 0.08 kg per person. However, there was no gender variation in the per capita generation of plastic waste. The various plastics waste identified were as follows: PET (6.5kg), HDPE (10.4kg), PVC (14.5kg), LDPE (40.7kg), PP (8.6kg), PS (8.3%), others (121.8kg) and uncoded plastics (16.5kg). The separation efficiency of the plastic waste was 59%. The female section of the hall had high separation efficiency for plastics materials (68%) compared to the male section (49%). The plastic waste with market values generated GH¢91.61 revenue for the study period.
Keywords:Plastic Waste; Generation Rate; Separation Efficiency; Potential Revenue; Plastic Waste Management
There has been an observed increase in the amount of waste generated globally and this can be attributed to population growth, urbanization and economic development. Every year, world cities generate about 1.3 billion tonnes of waste and this is further projected to increase to 2.2 billion tonnes per anum by 2025. Solid waste accounts for about 70% of the total waste generated globally, out of which a higher percentage ends up at the landfill with 19% of the total waste generated recycled and the remaining 11% channelled directly into energy production [1,2]. Plastics are compose of a network of molecular monomers bounded together to form macromolecules. They are characterized by molecular stability and as such are not easily broken down into simpler units. It is estimated that over 407 million metric tons of plastics are produced on an annual basis globally with the packaging industry being the largest market sector for plastic resins. Plastics pose a significant threat to environmental quality owing to their ubiquity and inability to readily biodegrade [3,4].
In 2012, the Association of Sachet Water Producers in Ghana revealed that there were 895 plastic manufacturing companies and sachet water manufacturers in the country, producing about 26,000 metric tonnes of assorted plastic products annually. Kanton et al. (2013) recounted that more than 10,000 metric tons of already made plastic goods are brought into Ghana yearly. According to the United Nations Environment Programme, 79% of the plastic waste ever produced ends up in landfills, dumps or in the environment, while about 12% is incinerated and only 9% recycled (UNEP, 2018).
In Ghana, it is estimated that only 2% of waste generated is recycled in the country (Thomson, 2010). The remaining 98% is either disposed of by waste management companies like Zoomlion Ghana or disposed of in the open environment (The latter is the most likely). This is consolidated by the fact that most cities in low and middle-income countries have a waste collection coverage of about 30%-60% (UNEP, 2018). The global plastics market size was valued at USD 522.66 billion in 2017 (Grand review research, 2019) and in the United Kingdom, about 324,000 tonnes of waste plastics were exported in 2005 with an observed 700% increase in plastic waste export to China between 1998 to 2004.
These observed market trends in recovered plastic waste export stem from the growing capability of recycled plastics to achieve “fitness for purpose” at a lower cost than virgin plastics (WRAP, 2006). According to the Conference of the parties to the Basel Convention on the Control of Transboundary Movements of Hazardous Wastes and their Disposal sixth meeting report in 2002, it was agreed that there is a full range of recovery options available for plastic waste including; material recycling (mechanical recycling or feedstock recycling), incineration with energy recovery, use as an alternative fuel source replacing traditional fuels for power generation or material production. However, post-user plastics present problems of identification, separation and also contamination. But where sufficient volumes of readily classifiable materials are available, recycling is successfully achieved (Basel Convention, 2002). This notwithstanding, the foundation of any sustainable waste management program is premised on the availability of and accessibility of concrete data about the source, type, composition and volume of waste generated (Iyeke, 2011). People’s mindset and negative attitude towards the management of plastic waste has over the years contributed the most to its persistence in the environment [5]. Since plastic waste management is not integrated into the learning curriculum for schools, students become ignorant about plastic waste management and they tend not to respond actively to issues regarding the effects of plastics on the environment, and there is little motivation towards environmental care [6]. Most students in the University drink water that is bagged or bottled in plastics, either in plastic bags or bottles. Bagged drinking water also known as sachet water is the most patronized due to its affordability. In addition to this, it is widely considered clean and portable by students. According to [7], students in the university perceive sachet water to be more mineralized and cleaner than tap water. Most of these students after gulping down the water, throw away the sachet plastic indiscriminately, thus, littering the environment. Therefore, instilling the culture of source segregation of plastics among members of the University Community, especially students would ensure proper management of plastic waste on the campuses. Universities hold principal responsibility in making sure that students are aware of the relevance of sustainable solid waste management practices such as plastic waste sorting and recycling. Most Universities in Ghana lack segregation equipment, due to this students lump up the waste generated and discard it without any sorting or segregation. However, there is a paucity of information/data about the composition and revenue implications of plastic waste within the University communities and the country as a whole. Information/data needed to aid the effective planning and designing of management strategies for the management of plastic waste in university campuses. This study, therefore, seeks to assess and provide relevant data/information about plastic waste generation and its revenue implications within a university community to inform sustainable plastic waste management programs and policies and provide economic and environmental incentives/bases for plastic waste recycling and recovery within the university community, other university communities and the country as a whole.
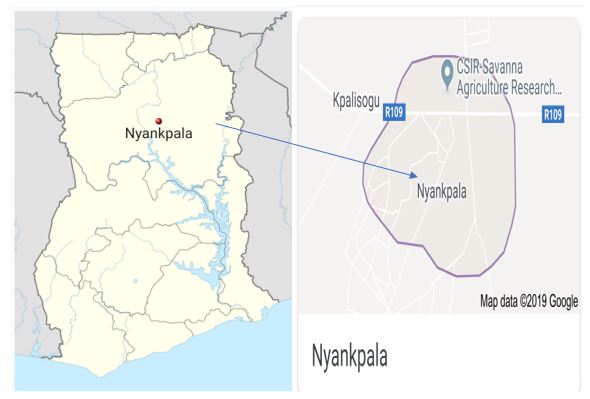
The study was conducted in the University for Development Studies campus found in Nyankpala in the Tolon District; about 20km southwest of Tamale, the capital of the Northern Region of Ghana. It is located within the Guinea savannah and is characterized by sparse vegetation. Nyankpala lies between latitude 9° 25’N and longitude 0° 58’W (Asirifi, 2013). Figure 1 below shows the location of the study area.
Materials and equipment used in the study include:
• Pair of gloves: This was used to protect the researcher from contamination and injures during the process of collecting and sorting waste.
• Nose mask: This was used to protect the researcher from inhaling potentially toxic and hazardous gases or particles.
• Waste bins: These were used to collect waste samples specifically for the research.
•Posters / Stickers – Stickers/posters with the message ‘Put only plastics here’ were placed on each waste bin to inform students of the type of waste to place in the bins.
•Weighing scale: Head pan weighing scale was used to determine the weight of the waste samples in kilograms (kg) and was calibrated to minimize error.
Sampling Techniques and Sample Size
The hall selected for the study accommodates both Male and Females students and is one of the major halls on the campus. The hall is a three-story building with females occupying the two middle floors whiles males occupy the last and ground floors. There are 142 rooms, with 72 rooms designated for females and 70 rooms designated for males. There are 12 waste bins positioned at the hall for waste disposal thus, 3 waste bins on each floor such that two are positioned at the extreme ends and one in the middle. Also, each floor has a cleaner assigned to it, who is responsible for emptying the waste bins as well as cleaning the toilets and bathrooms of the hall.
A convenient sampling technique was used to obtain data from junior members in the hall in the evenings. This was essential because most students spent most of their day either at lecturers or attending to other extracurricular activities. Purposive sampling was also used to sample out cleaners and hall executives for interviews on sanitary management on campus. This was intended to enable the researcher’s acquire information on the challenges of waste management in the hall and measures being implemented to ensure sustainable waste management in the hall. The number of students selected for the study was 109, with the male being 53 (48 %) and the female being 56 (51 %). The age of participants was restricted to students between the ages of 15 to 35. This study focused on waste composition and its revenue implication and therefore did not include a survey of student knowledge of waste handling on campus. However, a recent study by [8] indicated that the majority of the student (35%) produced plastic bags and bottles, followed by food waste (25%), and tins and cans recorded the lowest percentage (20%). From his report, the majority of students stored their waste in waste bins (72%) while the least percentage of students (8.6%) store their waste in polythene bags. The waste generated in the hall is collected and disposed of by a private waste contractor, Zoomlion Company limited. Again, the majority of students 94.8% are aware of waste separation and recycling and about 53.4% of the student were willing to disseminate recycling information.
A direct sampling method that involves sampling and manually sorting the waste into various categories was employed for the waste characterization study (STMD, 2003). Each category obtained from the waste stream was quantified in Kilograms using a weighing scale [9, 10]. Junior members of the hall were orientated on the fundamentals of source separation through personal contact and group discussions before the characterization study; this was to allow them to share their views on waste segregation and to understand what is required of them in terms of waste sorting, storage and collection. Initial sorting of the waste was carried out by members of the hall and further sorting was done by the researchers. Twelve waste bins were supplied in the hall for the sorting of the waste, each beside the already provided bins by the university authorities with an indication “Put only plastic here”. The bins containing the segregated waste (plastic waste) and the existing bins with the other wastes were emptied for sorting and weighing using a weighing scale. This was done at 5 am each day for 14 consecutive days.
The quantities of various components of the waste were recorded on a data sheet. Since the focus of the research was on plastic waste generation, the various types of plastic waste in the waste stream were sorted and quantified. The plastic wastes were sorted into seven major classes, Polyethylene terephthalate (PET), High-density polyethene (HDPE), Polyvinyl chloride (PVC), Low-density polyethene (LDPE), Polypropylene (PP), Polystyrene (PS), other plastics, and uncoded plastics. The percentage of plastic waste generated, the generation per person per day for the study period (per capita generation) and the percentage of plastic waste which was correctly separated by households (separation efficiency) was determined using mathematical formulae.


With the total quantity of solid waste generated and its plastic waste component known, the potential revenue of the recovered plastic waste was estimated from the unit price of the different types of plastic waste sold in the informal waste marketing centres located in the Metropolis. The total revenue was estimated for the period of the study and predicted per anum.
The data obtained from the study were analyzed using the Statistical Package for Social Sciences (SPSS version 25) and Microsoft Office Excel 2019. The results obtained were presented in graphs and tables. Differences in plastic waste quantities between males and females were subjected to independent t-test analysis.
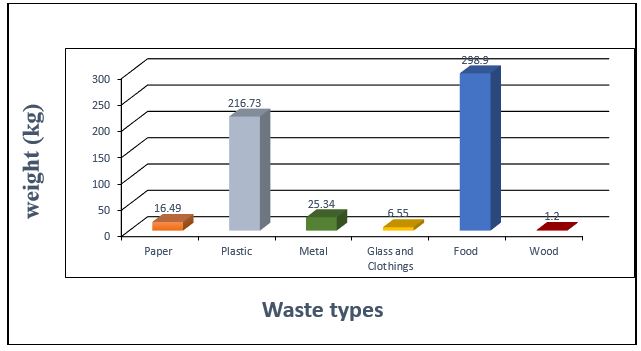
The primary data required for any proper waste management program is the solid waste types and their composition. The main fraction of solid waste recorded for the study (Figure 2) were; food waste, metals, paper, plastics, wood and glass and clothes. The waste types identified were similar to what has been reported in Ghana by [11] and Fobil et al. (2002). They were also related to other international studies recounted by the World Bank in 2012 and [12]. The study also revealed that a total of 565.2 kg of solid waste was generated in the study area, out of which, 336.61 kg (59.55%) was recorded for the female section and 228.60 kg for the male sections of the hall. The high quantity of waste generated by the female sections of the hall may be attributed to the purchasing power and lifestyle of the female students in the hall. It may also be due to over-reliance on packaged and already prepared food and other goods due to convenience, hence the observed high solid waste generation by the females. It was revealed that food waste was the highest waste component by weight (298.9kg) representing 52.9% (figure 3). This comprises 190.5 kg of food waste generated at the female section and 108.4 kg of food waste generated at the male section. A similar result was reported by [10, 11, 13] where food waste or organic waste recorded the highest percentage in their studies.
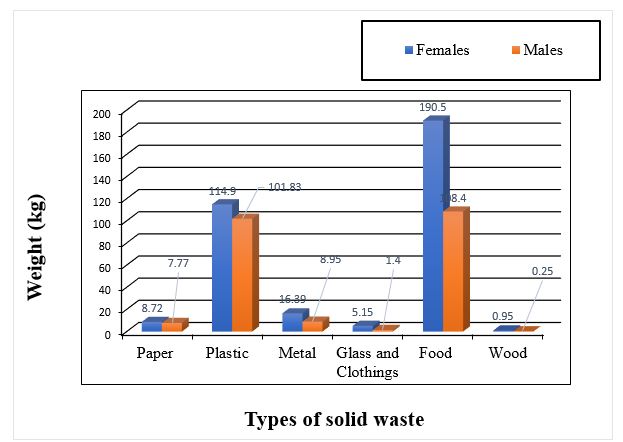
The observed high percentage of organic waste presents an opportunity for revenue generation through compost production which would go a long way to the improve environment and support sustainable agriculture within the study area and beyond [13]. In the case of metals, 16.39 kg was generated from the female section and 8.95 kg from the male section, which is similar to UNEP’s International Environmental Technology Centre (2009) average figures from Accra, Ibadan, Dakar, Abidjan, and Lusaka. Additionally, plastics, papers, wood and glass and clothes were other components identified during the study. Wood represented 0.2 % (0.95kg) for the female section, 0.25kg for the male section, glass and clothes represented 1.2% (5.15kg) for the female section, 1.4kg for the male section, plastics represented 38.35% (114.9kg) for the female section, 101.83kg for the male section, and paper waste represented 2.9% thus, 8.72kg for the female section and 7.77kg for the male section (Figure 3). This presents an opportunity for waste management and recycling companies in the study area in terms of waste recycling and recovery. Judging from the results, substantial materials can be recovered from the waste stream for recycling. Again, this can save materials disposed at the landfill and help reduce the amount of waste disposed on the landfills.
The composition of solid waste is an important issue in the management of waste. This is because, the types of solid waste generated can affect the techniques in its disposal and are necessary for deciding on reuse, reduction and ultimate recycling of waste [14]. The composition of solid waste for male and female sections identified in the waste streams were; paper, plastic, metal, glass and clothes, food and wood. However, the female section recorded the highest quantity of solid waste generated for all the observed solid waste components (Figure 4). Traditionally, females are inclined to cooking because it is seen as their role and a skill that is learnt at home and for these reasons, they tend to prioritize and enjoy cooking in the schools compared to their male counterpart, who often prefers to purchase fast foods or visit restaurants to eat. This may have influenced their waste generation compared to their male counterparts in the hall.
The solid waste generation rate in kg/capita/day for the study area was determined. The solid waste generation rate estimates the amount of waste generated by households over a certain period (day, week, etc.). The per capita waste generation was calculated by dividing the total weight of waste generated by the total number of students who participated in the study and the period of the study. Over the period of study. The hall recorded a mean quantity of 94.20 kg of solid waste. The rate of solid waste generation was 40.37 kg/day whiles the per capita rate of waste generation in the hall was 0.20kg/person/day. The per capita solid waste generation is similar to that of [13], 0.23 kg/capita/day. Nevertheless, the per capita waste generation rate is in contrast with [11] study in Ghana where a per capita waste generation of 0.57 kg/capita/day was recorded. Furthermore, the solid waste generation rate was higher than that of [13] who recorded a 22.07 kg/day solid waste generation rate. This could be due to differences in sampled population and location.
A higher mean quantity of solid waste of 56.10 kg was generated by the female section compared to that (38.10kg) recorded for the male section. The female section recorded a higher generation rate and per capita waste generation rate compared to the male section of the Hall. Solid waste generation rates were 24.04 kg/day and 16.33 kg/day while per capita waste generation rates were 0.22 kg/capita/day and 0.18 kg/capita/day in the female and male sections respectively. The observed results agree with the commonly recorded per capita waste generation rate in developing countries which ranges from 0.4–0.6 kg/person/day [15]. Furthermore, the waste generation rate across Ghana irrespective of the economic considerations ranged from 0.2 to 0.8 kg/person/day. This is also the range for most of the cities in Sub-Saharan Africa [16] (UNEP, 2013) thus further corroborating the recorded per capita rates.
Plastic waste in the form of bags and bottles make up the second-largest component of solid waste generated in the study area representing 38.35% of the total solid waste generated. This can be attributed to the increased use of plastic packages and products by students on campus. The observed results contradict that of [13], [Peprah 2013] and Mensah (2010) who recorded lesser quantities in their studies (11.01% and 15.81%) respectively. It was observed that 114.9kg of plastic waste was generated by the female section whiles 101.83kg was generated by the male section of the hall. An independent t-test analysis at a 5% significance level on the means of the quantities of plastic waste generated from the female and male sections revealed, a significant difference (p=0.046) in the waste generated between male and female students. This high percentage of plastics in both the male and female sections of the hall could be a result of the recent widespread replacement of the existing cultural packaging methods of food, beverage, water and other products using leaf wrappers, brown paper and metal cups with plastics. This observed phenomenon presents a major problem of plastic pollution since plastics do not readily biodegrade and tend to accumulate in the soil and watercourses. Plastic bags can also choke farm animals and wildlife if they are ingested. Although these fractions of plastic waste are not usually seen littering the environment, they constitute an appreciable quantity because of their relatively high molecular weight [17].
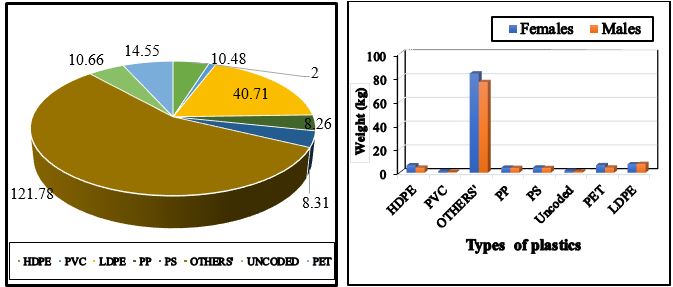
The study identified about seven different types of plastic waste, which were PP, PET bottles, PVC materials, LDPE, HDPE, ‘others’ and uncoded (Figure 5) which is similar to a study conducted by [18] at Independence Hall in the Kwame Nkrumah University of Science and Technology. The types and quantity of the different types of plastics reported by [18] at Independence Hall were similar to that of plastics recovered within the study area (figure 5) except for PET which was very low as a result of continuous scavenging activities. According to [19], PPS have low market value as compared to PET which has medium market value whereas HDPE have a high market value [19] compared to LDPE which has lesser value and is likely to be left out when plastics are being sought for re-use or recycling. This, therefore results in more LDPE plastics in the environment compared to HDPE such as is the case in Watamu [20] where 55% of the plastic waste discarded by households was LDPE plastic.
In addition, the types of plastics discarded by households in Watamu was consistent with the standard plastic types that are usually discarded by students as per this study. The result (figure 5b), further revealed that out of the total plastics generated, both the Male and female sections of the hall recorded higher components of the “others” plastic component (polyethene, polyesters, Styrofoam, nylon) and LDPE compared to PET, uncoded plastics, HDPE, PS, PP, and PVC plastics
The rate of the plastic waste generation just like any other type of waste is inextricably linked to urbanization and economic development. Generally, the higher the economic development and rate of urbanization, the greater the amount of plastic waste produced. Income level and urbanization are highly correlated and as disposable incomes and living standards increase, consumption of goods and services correspondingly increases [21].
A total of 216.73 kg of plastic waste was collected over the study period and a mean quantity of 15.48 kg/day weight of plastic waste. The average weight of plastic waste of individual types of plastics generated per day is shown in (Figure 6). Others waste component recorded the highest average generation per day followed by LDPE, PET, Uncoded, HDPE, PPS, PP, and PVC respectively.
Nevertheless, the average plastic waste generated per day by the male and female sections was 7.27 kg and 8.21 kg respectively. However, both the male and female sections recorded higher average plastic waste generation per day for “other” waste component and LDPE compared to HDPE, PS, PP, and PVC (Figure 6). The per capita plastic waste generation estimated for the study period was 0.08 kg/capita/day. This is lower than 0.47035 kg/capita/day reported by Kodwo et al. (2015) in Ghana but higher than 0.14kg/person/day, 0.0054 kg/person/day and 0.017 kg/capita/day reported by [11], and [22] respectively. The male and female sections both had a per capita plastic waste generation rate of 0.08kg/capita/day for the study period.
The overall separation efficiency of plastic waste components for the hall was 59% (Table 1). The separation efficiency was higher than what was reported by [10] in her study but lower than that reported by [23,24] and Damghani et al. (2007) in their studies. There is therefore, the need to intensify education on source separation of solid waste to maximize the benefits of plastic waste and its proper management. The female section had high (68%) separation efficiency for plastic waste than their male counterparts (49%), (Table 1). The separation efficiency of waste was considered good in the study area. The findings affirm the findings by [25], who stated that separation efficiency of waste materials is higher among females in the communities. This implies that women in society are more involved in household solid waste handling and management. Generally, it was also observed that most of the solid waste generated was being managed by women on campus, since most sanitary staff on campus are females. This is similar to other survey done in different location by [26] which indicates that women played a dominant role in the management of plastic waste. Table 1 shows the separation efficiency of plastic waste in the hall.
In recent years, the plastic industry has proven to be a major economic giant generating about 1,722 billion Euros in 2015 alone (UNEP, 2018). In Europe, the plastic industry is estimated to have had a turnover of close to 350 billion euros and a trade balance nearing 15 billion euros (Plastics Europe and EPRO, 2017). From the study, the potential revenue of plastic waste was estimated by multiplying the total quantities of plastics that are sold in the market eg. PET bottles and sachet water plastics by their market values (price) on the market. PET bottles, sachet water amongst others are the most recycled and usually purchased by middlemen or recycling companies. The study revealed that 1 kg of plastic bottles cost Gh¢ 2.20, water sachets cost GH¢0.5 per kilogram and 1,000 pieces of fine ice sheets (Iced cream wrappers) cost GH¢6. The recorded price for a kilogram of plastic waste is about 900 times that which was recorded (0.25pesewas per kilogram of plastic waste) by Owusu-sekyere et al. (2013) in the Kumasi Metropolis, further reiterating the increasing value of plastic waste in the country [27].
Nevertheless, 119.2 kg of sachet water plastic could provide revenue of GH¢59.60p and 14.55 kg of plastic bottles provided a revenue of GH¢32.01p, giving a total of GH¢91.61p of potential revenue over the study period. This amounts to about 32% of the minimum wage in Ghana thus reiterating the potential of plastic waste to reduce unemployment and serve as a source of income for the teeming unemployed youth. The findings from this study will therefore serve as baseline data for predicting future plastic waste volumes and revenues. From the study, the estimated revenue of Gh¢ 2,381.86 can be generated for the university from sales of separated plastic waste materials. This can contribute to funding solid waste management on campus. It would therefore be prudent for the university management to institute a recycling scheme on campus to support the management of solid waste and to ensure environmental quality on campus.
According to the study, the hall has 12 waste bins and one communal container for temporary holding of waste before it is finally transported for disposal by a waste management company (Zoomlion Ghana Ltd.). The hall has four (4) labourers designated to each floor to take care of waste and cleaning of washrooms and bathrooms. The health inspector in charge of solid waste management in the hall alluded to the fact that plastic waste is not given any special attention and therefore treated like any other waste. This highlights the need for a stakeholder consensus on sustainable plastic waste management within the campus, the university and the country at large. Policy intervention by the university authorities in terms of recycling plastic waste may generate a substantial amount of revenue to support the management of solid waste on university campuses.
In conclusion, the study showed that plastic and food waste make up the major component of the solid waste stream generated in the study area. The percentage composition of plastic in the solid waste was about 38.4%. The total amount of waste collected during the 14 days study was 565.20 kg and the average amount of waste generated per day is 40.37 kg/day. The solid waste generation rate is however 0.20 kg/person/day. The plastic waste generation rate in the study area was 0.08 kg/person/day with 59% separation efficiency. The male and female sections also had 0.08 kg plastic waste generation per capita/day respectively. However, the females were able to separate their waste more efficiently (68%) than their male counterparts (49%). The other plastics was the highest among the plastic waste which recorded a percentage of 56.18%, followed by low-density polyethene (LDPE)(18.78), PET (6.71%), HDPE (4.93%), uncoded (4.91%,) PS (.3.83%), PP (3.81.%), and PVC (0,92%) out of the total plastic waste generated.
The study also revealed that plastic bottles and water sachets presented a total revenue of GH¢91.61 equivalent to Gh¢ 2,381.86 per anum. According to the study, proper and sustainable plastic waste management is limited to mere disposal and therefore, waste separation and recycling is virtually nonexistent in the study area. It is therefore recommended that education and sensitization of hall members within the campus has to be intensified and encouraged by the university authorities, waste management authorities and companies such as Zoomlion Ghana limited. The Government should introduce tax waivers, subsidies amongst other incentives to promote plastic waste separation and recycling in university campuses to help reduce the cost of plastic waste management and consequently increase recovery and recycling of plastic products.
Direct surcharges, punitive taxes, extended producer responsibility, mandatory requirements and a possible ban on certain plastic types (especially single-use plastics) should be considered by the government to encourage proper management of plastic waste materials generated in the country. It is also recommended that the manufacturing of plastic waste from alternative feedstock be encouraged (Bioplastics). Also, it is recommended that a similar study be conducted in other university halls and in other universities to provide a broadened scope of the state of plastic waste management and recycling in university campuses and its accompanying benefits for the university communities.
This article contains information gathered from the field study, and thus, we would like to acknowledge all authors of the article and references used in this article.
There is no conflict of interest among the authors.
The first author was responsible for the accomplishment of most of the works; write up of the paper and standardization of the paper. The second and third authors also contributed to the data collection, searching of literature and manuscript preparation. All authors contributed equally to the preparation of the manuscript and approved the final manuscript for publication.
The research was funded by the authors involved. The authors received no financial support for the research.