Prevention Strategies for Mathematical Model MERS-Corona Virus with Stability Analysis and Optimal Control
In this subsection of the article, we considered the transmission of MERS-CoV in human population though an agent known as camel, which lead an epidemiological mathematical model. For this, first we find the threshold number ”R0” of the model, and biological region of study. Then all endemic equilibrium points are derived. After that stability analysis are retrieved in the presence of R0, while for “global stability analysis” we introduced Lyapunov function. Then to control the infection further we used the control strategy by applying two control variables, u1, and u2, that is, using mask to cover full body parts, and medication or antivirus to maximized the number of susceptible individuals as well as recovered individuals, and trying to reduced the number of infected individuals. Finally numerical simulation is presented with and without control.
Keywords: Mers-corona virus; Mathematical Model; Basic Reproduction Number; Endemic equilibrium points; Local Stability Analysis; Global Stability Analysis; Optimal control; Numerical Simulation
Over then 2,000 cases of the MERS-CoV have been recently reported by 2017, while rate of fatality is > 30 [1]. Eighteen more cases were reported in early May 2018 [2]. After a period of few cases, cases began increasing in the middle of the summer 2018 [3,4]. The earliest cases of MERS were of clade a clusters (EMC/2012 and Jordan-N3/2012), and new cases are genetically distinct (clade B) [5,6]. Early reports compared the virus to severe acute respiratory syndrome (SARS), and it has been referred to as Saudi Arabia’s SARS-like virus [7-9]. MERS-CoV is considered zoonotic virus, which means it transferable through animals to humans. Products of camel is the main source of infection in human. The findings suggest that bats may transfer the virus to camels, and camels transmit it to humans. The study up to February 24, 2015, shown there are 1046 cases reported globally the Middle East Respiratory Syndrome Corona virus (MERS-COV) in which 298 of fatal cases is detected. Hence MERS-COV is still gaining power and grounds in the world. In the United Arab Emirates, there is 67 confirmed cases with 9 death cases have been reported. This situation requires the mobilization of all scientific communities to investigate all the possibilities to control the outbreak and try to respond to the many un answered question associated with the explosion of MERS cases in recent weeks [10,11]. The mathematical epidemiology has shown its efficiency in shedding light on several issues related to the spread of diseases. Severe Acute Respiratory Syndrome (SARS) is the best example, where the Canadian government created the MITACS (Mathematics of Information Technology and Complex System) network to help in the management of SARS epidemic in 2002-2003 [12-14]. Also Tahir, et al. presented the mathematical model for Ebola virus [15]. There is also a report of a Saudi Arabian man who became ill seven days after applying topical medicine to the noses of several sick camels and later he and one of the camels were found to have identical strains of MERS-CoV [16,17]. In January 2018 a larger outbreak of MERS among camels in Kenya is reported [18,19]. As of 5 February 2018 more than 500 camels are said to have died of the said disease [17,20]. MERSE Corona was first occurred in Saudi Arabia in 2012. Corona-viruses having big family viruses which cause infection from a common cold to severe Acute Respiratory Syndrome (SARS). General MERS CoV have fever, cough also shortness of the breath. While Pneumonia considered common symptom, but not always. While diarrhoea is present in gastrointestinal problem. Perform hand hygiene before and after contact with the person and his or her surroundings and after PPE removal [21].
The cells MERS-CoV infects in the lungs only account for 20 percent of respiratory epithelial cells, so a large number of virions are likely needed to be inhaled to cause infection [22,23]. Unless there a close connection among peoples and camels. The most outbreaks in health occurred in various countries, while most outbreaks observed in Saudi Arabia second United Arab Emirates third in Republic of Korea. Severe illness can cause respiratory failure in human. When MERS patients are admitted to hospitals their clinical symptoms mostly include fever, cough, expectoration and shortness of breath [24,25]. In this article, we processed as follows, first section is about introduction and related literature, then we given the mathematical modeling and all its infectious classes. Then the basic key value threshold number R0, as well as, the endemic equilibrium points are obtained. In the light of basic reproductive number all equilibria has been calculated and shown stable while in global stability analysis we introduced “Lyapunov” function. Also we used control strategy to maximize the number of susceptible and recovered individuals by introducing two control variables. In the last we gave numerical simulation with and without control or vaccination to represent the model graphically.
Our model is based on SIR human population model, and vector camel population, properties of the disease, and infectious classes. We divided the whole population as.
1. Thp(t) represent human population.
2. Tcp(t) represent vector camel population.
3. S(t) represent susceptible human population .
4. The infected human population represent by I(t) which are infected by infected camel through (close contact, caring, treatment, using infected camel milk, meat, saliva) are the causes of infection.
5. R(t) represented recovered individuals population.
Now the vector camels population is described as,
6. Susceptible camels population is represented by Sc(t).
7. Infected camels population is represented by Ic(t) respectively.
Here we drawn some compartments in the model as,
8. During care, close contact the susceptible human individuals (owner, shepherd, cherisher) infected partially and move from susceptible human individual compartment1 to infected human individual compartment 4.
9. The partially infected individual using medication or conservancy injection and move from that compartment to recovered individual compartment 5 or die.
10. Totally infected individual joining hospital and spread infection there or die.
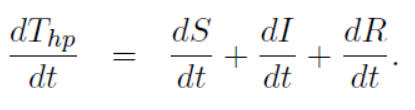
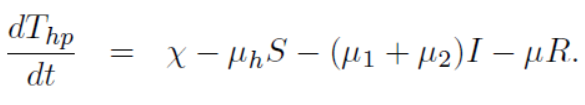
First we represent human population at any time “t” while in second we represent camel population in the same time. Then from all 1 to 10 we get the following mathematical model of Mers-Corona virus which lead the following differentials equations:
Human population:
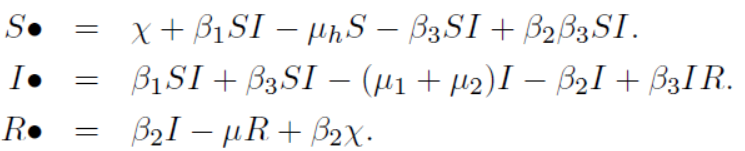
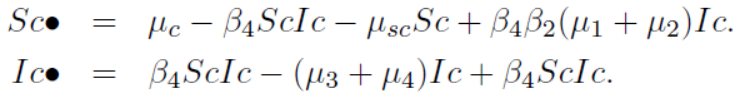
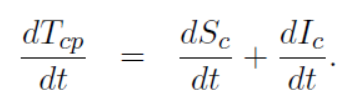
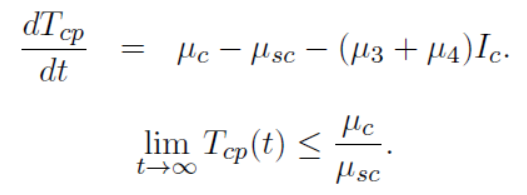
Vector camel population is:
With the following initial conditions,
S(0) ≥ 0, I(0) ≥ 0, Sc(0) ≥ 0, Ic(0) ≥ 0.
further we used the following assumptions in model (1), which are classified as, x represent new birth rate in susceptible human population, β1 represent the transmission rate from susceptible human individuals to infected human individuals due to infection of infected camel and move from susceptible human compartment to infected human individual compartment, represent natural death rate in susceptible human individuals compartment, β2 represent the rate of transmission of partially infected individual to recovered human individuals compartment, μ1 and μ2 respectively represent natural death rate and infected death rate in infected human individuals compartment, μR represent natural death rate in recover human individuals compartment, μc represent new birth rate in susceptible camels population compartment, μsc represent natural death rate in susceptible camels population, β4 represent infection rate in susceptible camels to become infected camel compartment, μ3 and μ4 are respectively represent natural and infectious death rate of infected camels population compartment.
In the model the infection spread in susceptible human individual due to the infected camels in any like, blood, wound, saliva, caring, treatment of infected camel especially the individuals like owner of camels, shepherd, cherisher get MERS CoV infection and the rate of that infection is represented by β3
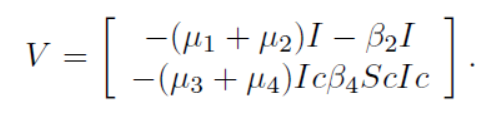
In mathematical epidemiology study the basic reproduction number R0 considered a primary and initial parameter. R0 is one of the basic key of mathematical epidemiology [26]. This (R0) quantity is been obtained by many methods, while an interesting and simple method is the next generation matrix which very useful in the determination of a biologically meaningful formula for a basic reproduction number in the case of continuous time epidemic model, that is in system of differentials equations [27]. For this we processed in proposed model (1) as, the rate of a secondary infectious ϝ of the infected class is represented by (Ih, Ic) also the rate of a disease progression Ѵ of non-infected class is denoted by (S, R, S)
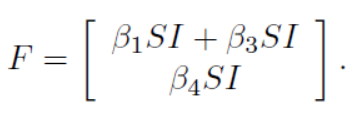
And the non infectious class of the model is,
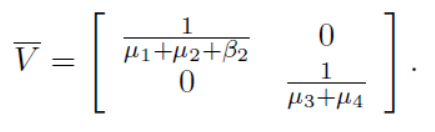
The inverse of Ѵ is represented by,
Hence the required reproduction number, R0 of the proposed model is given by,
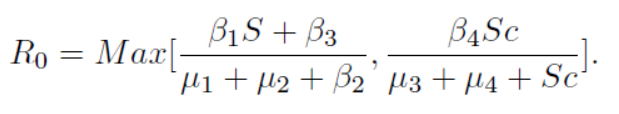
Here for reproductive number we have two possibilities.
First for susceptible human population we have the following,
After putting values from model (1) we get,
Which can be written as,
Now second for susceptible camel population, we have,
After putting values from model (1) we get,
Hence model (1) has two eigen values. The first eigen value is concern with the susceptible human population while the second eigen value related to the susceptible camels
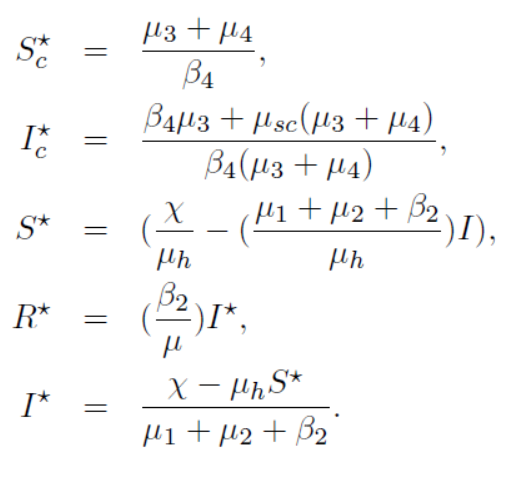
In this subsection, the potential existence of a disease-free equilibrium points is now discussed. Now we find the endemic equilibrium points. For this we know that the points of disease-free equilibrium results to be locally asymptotically stable when the basic reproduction number, that is, (R0) < 1, while the endemic equilibrium points is locally asymptotically stable when the reproductive number exceeds unity, that is, > 1. Following are the endemic equilibrium points of the concern mathematical model of MERS CoV.
In this subsection, we present the stability analysis of the model (1). The stability analysis having two categories (1) local stability analysis and (2) global stability analysis which are discussed below.
Now we show the local stability analysis of the system, at disease free equilibrium of model (1), the points are J(df )( χ/μh, 0, 0, μc/μsc, 0) to assess the local stability analysis of model (1) at disease free equilibrium, the Jacobian matrix at J(df ),
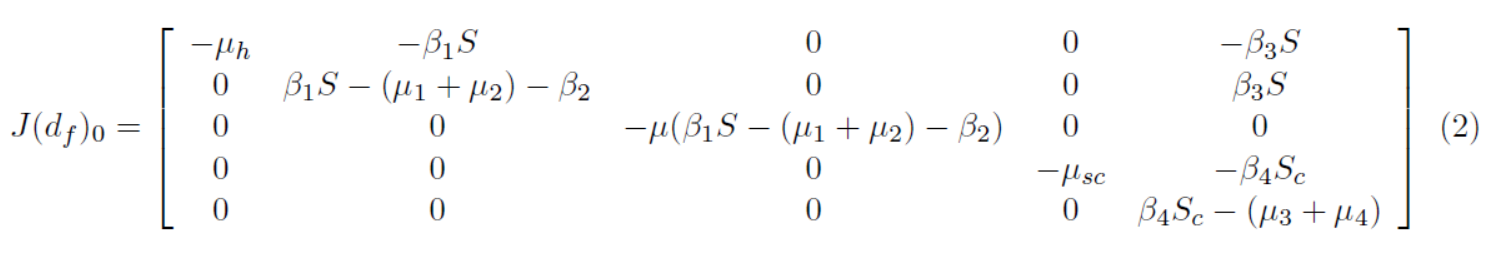
So the disease free equilibrium implies Ih = 0, Rh = 0, Ic = 0 then we have, (2) Thus we have the following well known stability results.
Theorem: If R0 < 1, the proposed model (1) remain locally asymptotically stable on the point disease free equilibrium, D(F)0= (S0, 0, 0,

if R0 > 1.
Proof: From the above equation (2) we write that,
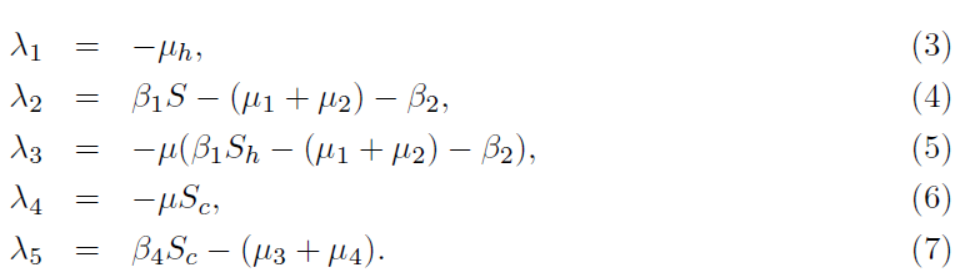
(3), (4), (5), (6), (7)
Its cleared from equations (3), (5) and (6) the eigenvalues are negative. Taking equation (4)
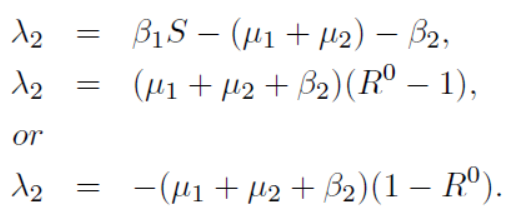
The corresponding value λ2 < 0 iff R0 < 1. Now considered equation (7) which after some simplification given. λ5 = -(μ3 + μ4) (1-R0) < 0 iff R0 < 0,
Now all the eigne values are negative which complete the proof. Hence we say that local stability analysis at disease free equilibrium of the model (1) are asymptotically stable.
We have the following result to prove the local stability analysis of the model at endemic equilibrium stated below,
Theorem: If R0 > 1 then the model (1) is locally asymptotically stable at endemic equilibria, that is at VE = (S*, I*,R*, *cS , *cI)and unstable otherwise.
After simplification we get the following, (8)
Here we made the following assumptions in the above which are describe as below,
From equation (8) we get the following Eigne values which are listed below,
(9), (10), (11), (12), (13)
We definitely know from the equation (9), (12) and (13) have negative Eigne values. Consider equation (10) which implies, X2 = A < 0 iff (μ1+ μ2+ β2) > β1S*. Equation (11) implies X3 < 0 iff 1/μh > R0. Which complete the proof Hence we say that local stability analysis at endemic equilibrium of the model (1) is asymptotically stable.
In study of the mathematical epidemiology global stability at equilibria considered the key problem. Fortunately for this we have a Lyapunov function to check stability analysis is a power full tool of the autonomous system. Thus to find here the global stability of mathematical model (1), we using the concept of Lyapunov function, which used by many authors [28,29]. Now we elaborate the global stability of model (1) at disease free equilibrium. For this we need to construct the Lyapunov function. Thus following are the stability results.
Theorem: For R0 1, the model (1) is said to be globally asymptotically stable on the point disease free equilibrium, if S = S0 and unstable for R0 >1.
Proof: For global stability analysis at disease free equilibrium of the model (1), we need to define the Lyapunov function, consider,
Clearly the above define function is L(S, I, R, Sc, Ic) > 0 and also (S(0); Ih(0), R(0), Sc(0), Ic(0)) = 0. Now differentiate the function L(S, I, R, Sc, Ic) with respect to t, we get,
Taking values from model (1), the above equation becomes,
Hence dL/dt = 0 if and only if S = S0, I = I0, R = Ro, Sc = ocS and Ic = ocIand dL/dt < 0 iff μc < k for S > S0 also 34()342scckμμμμμβ+=+−Hence disease free equilibrium is globally asymptotically stable which complete the proof.
Theorem: For R0 > 1, the endemic equilibrium of the model (1) is globally asymptotically stable, if S = S*, I = I*, R = R*, Sc = *cS and Ic = *cI and unstable, if R0 is less then unity.
Proof: Now we discuss the global stability analysis of model (1) at endemic equilibrium. For that purpose we define the following Lyapunov function,
It clear that W(S*, I*, R*,S*c,I*c ) > 0 and W (S*, I* , R*,S*c , I*c = 0 iff Sc = S*c and Ic = I*c . Differentiating with respect to “t” we have,
Using values from model (1), we get,
Hence dW/dt = 0 if and only if Sc = *cSand Ic = *cI and also dW/dt < 0, iff k > μc which complete the proof. Hence the endemic equilibria of the model (1) is globally asymptotically stable.
To prevent MERS-corona virus in the Arabian community we need to draw special methodology for its control, that is, (we define some control variable) to reduce infection from individuals. For that purpose optimal control is one of the powerful tool considered in Mathematics to check the control of some infectious diseases. Optimal control is used for the development and improvement of the control strategy [30]. In normal population we use control variable tool to minimize MERS-Corona disease.
We use
M1 : u1(t) a mask to cover sensitive part of body and
M2 : u2(t) using medication or antivirus in advance which prevent the spread of disease.
In model (1) we have five variables with names S Susceptible individuals, I Infected individuals, R Recover individuals, Sc Susceptible camels and Ic Infected camels respectively. For minimization of objective functional an optimal control with the help of two control variables are define by the following.
Subjected to M1 and M2 we have the following system of equations,
Considered with initial conditions below,
In above equation (15) the terms A1 represent susceptible individuals, A2 represent infected individuals, A3 assign for recovered individuals, A4 represent susceptible camels, and A5 show infected camels. Also 2111()2wut used to wear mask to cover sensitive part of body parts and 2211()2wut represent the medication or antivirus associated with the proposed problem. While in first we need to derive the control function, given by below,
Subjected to the system (15) also the control set variables for the proposed model is as, W= {(u1, u2) / ui(t) is Lebesgue measurable on [0, 1], 0 < ui(t), i = 1, 2}
Now consider the control system (15) in initial time t = 0 to show the existence of the optimal control problem. The bounded Lebesgue measurable control, positive initial condition, and positive bounded to the state system exist [31]. We find optimal control solution of problem for that consider equation (14) and (15). For that purpose first we define the Lagrangian for optimal control problem as,
For finding the minimal value of the Lagrangian we define the Hamiltonian “H” as.
For existence of the proposed model we have the following result,
Theorem : For existence of optimal control we take u* = **12,uu εW such that, L(**12,uu) = minL(**12,uu). Subjected to the initial condition of the control system (17).
Proof: To prove optimal control existence using in we define positive control variables and state variables. For minimizing the case define above the convexity required for the objective functional in equations (14) u1(t) and u2(t) are satisfied [5]. The set of control variables u1, u2 εW and by definition it closed and also convex. Here optimal control system is bounded which show the compactness and fulfil the existence of the proposed model and optimal control for further to integrand on objective functional (14),
A1S(t) + A2I(t) + A3R(t) + A4Sc(t) + A5Ic(t) + ½ (w1u21(t) + w2u22(t)).
Taking the convex in optimal control, that is, set W that implies the ensure of optimal control (**12,uu)
to minimize (15). Now for optimal control problem we need to find optimal control solution for purposed model for this we use Maximum principle of Pontryagin,s to the Hamiltonian [32].
H (y, p(y), u(y), λ(y)) = f (y, p(y), u(y) + λ(g(p(y), u(y)))
If (p*,**12,uu) we will considered the optimal control solution for the required proposed optimal control problem then obviously there a non-trivial vector exist,
λ(y) = (λ 1(y), λ2(y), λ3(y)…………., λn(y)).
Such that y taking for time, that is, y = t
Now on Hamiltonian equation we apply the necessary condition and then we processed as.
Theorem: Suppose that S*, I*, R*, *cS,*cI are the optimal state solution regarding to optimal control variables **12,uu for the optimal problem (14) also (15). Then the adjoint variables will exist there λ1(y), λ2(y), λ3(y), λ4(y), λ5(y) are satisfied.
with the transversality conditions (Boundary conditions). λi (y) = 0, for i = 1, 2, 3. Further more the optimal control variables *1uand *2u are as.
Proof: Now to find the adjoint equation (15) for transversality conditions (21), considered the Hamiltonian (17) by assigning S = S*, I = I*, R = R*, Sc = *cS and Ic = *cI ; then differentiate Hamiltonian equation with respect to S, I, R, Sc and Ic. Then we obtain the desired adjoint equation (24). We find *1u and *2u. Now to differentiate the Hamiltonian with respect to u1 and u2 we solve ∂H/∂u1= 0 and ∂H/∂u2 = 0 on the interior on the control set we use optimality condition. Finally we use a property of the control space W and we get equation (23) and (24) which complete the required proof. Now again we call equations (23) and (24) from the optimal control u* the characterization of the optimal control. We obtained the State variables and also optimal control variables by the solving optimality system which contain state variables (14) and adjoint system (15) by boundary condition (23) and (24). Putting the values of *1uand *2u in the control system (15) we get the following.
With H*at (t, S*, I*, R*, *cS, *cI, *1u, *2u, λ1, λ2, λ3, λ4, λ5) such that,
Now we solve numerically the optimal control system (24) for the sack of optimal control.
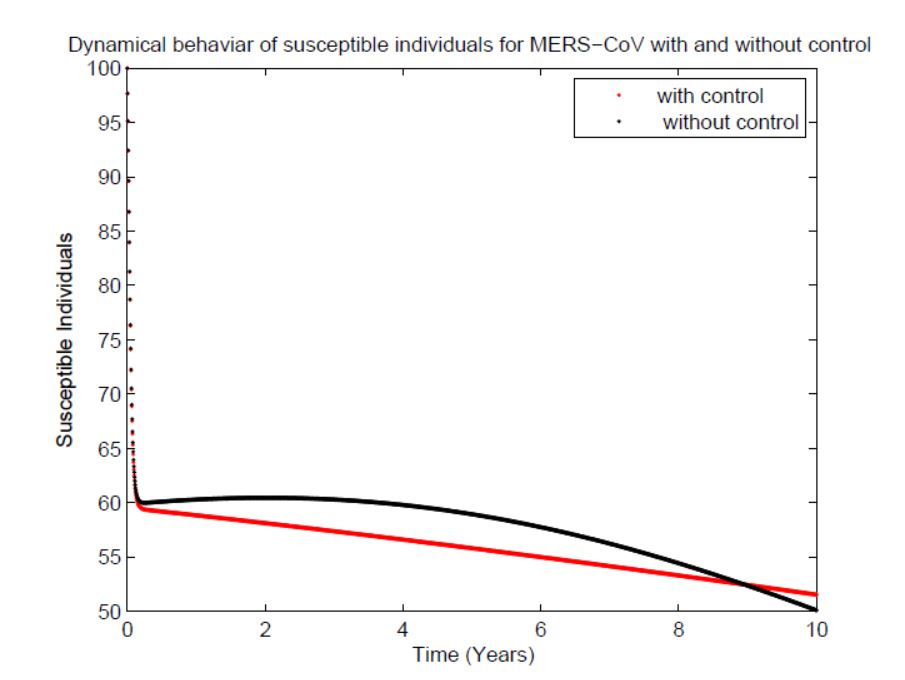
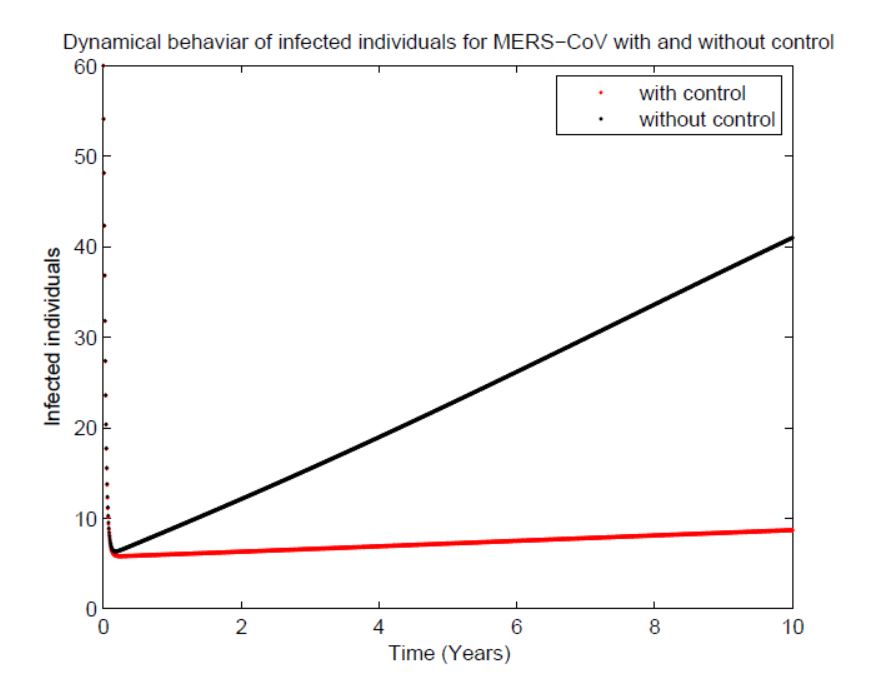
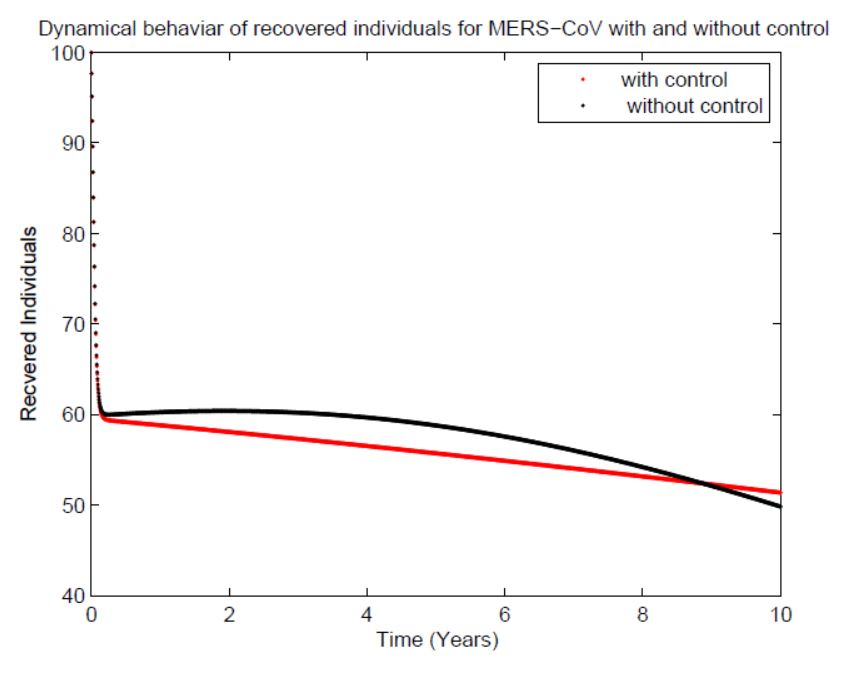
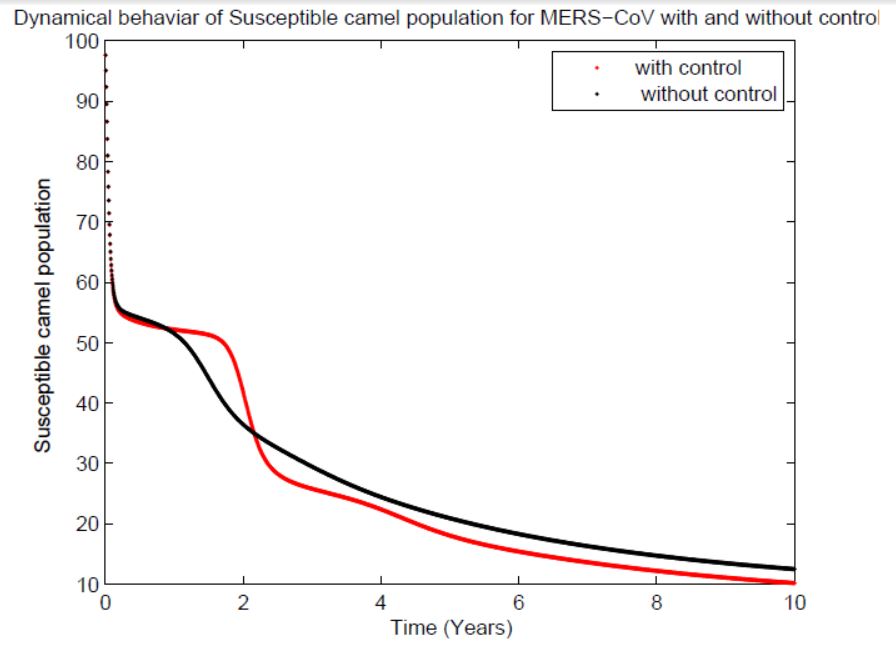
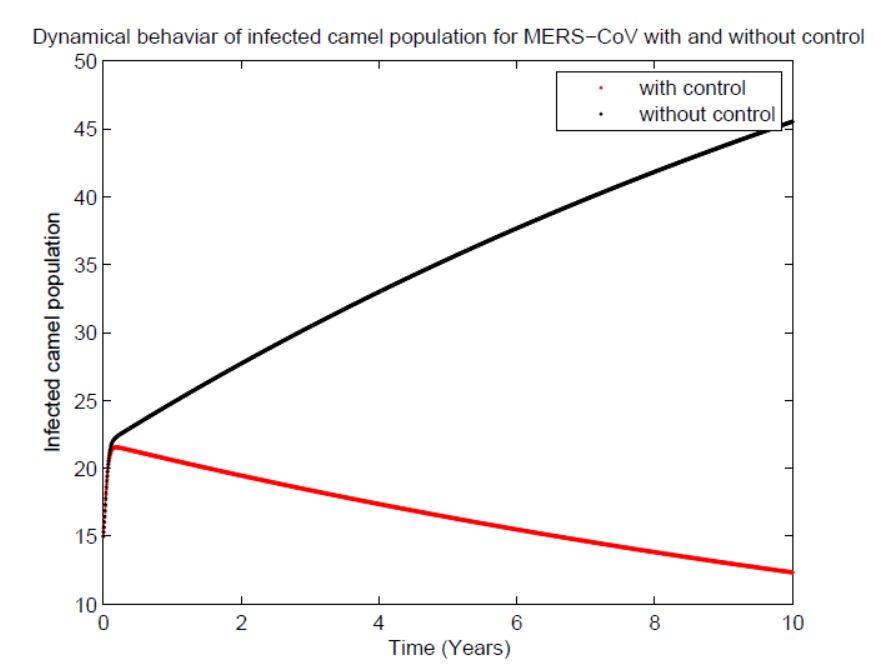
In this subsection of the article, now we solve model (1) by numerical simulation through Runge-kutta, that is, RK4 method. Runge-Kutta method is used in to solve different wide range of differential equation problems [33-35]. The different parameters values provide different numerical results are given in (Figures 1, 2, 3, 4 and 5). Parameters description, notation and their values used in Table at section 10. In our problem we have two types of population, human population and vector camel population. In the simulation the Figure 1 represent the graph of susceptible individuals, where recovery is very fast with vaccination while without vaccination we see that the graph is increasing, showing bed hygienic condition of the susceptible individuals. Figure 2 show the graph of infected individuals of MERS corona virus where disease spread rapidly without control and in this way it reach to uncontrollable level, but by applying vaccine to this class of individuals recovery is very sharp and quick. Figure 3 describe the graph of recover individuals, which rapidly recovered by using vaccine or control. By using vaccine the individuals recovery line is going straight, mean recovery is very fast as compared to non vaccination graph Now in vector camel population Figure 4 represent the graph of susceptible camel which initially high but vaccine slow down its intensity and brought the graph to zero as compared to the non vaccinated its going high and not touch the zero. In Figure 5 which show the graph of infected camel going maximum and finally in this level no recovery is possible but when we apply vaccine or control strategy we observe that the recovery is very fast. In our article the mission is to applying the optimal control to reduce the number of infection individuals and increase the number of normal individuals. All the values in the Table given in section 14 are fixed. Graph of the Figures 1, 2, 3, 4 and 5 in the simulation are shown with and without control. It is clear from simulation that with vaccination the status is very effective and the recovery is very much faster while in case of without vaccination the recovery in very slow or we say without vaccine the recovery take very large time.
Here a mathematical epidemic model for both, human population and vector camel population of MERS corona virus is considered. In the model the transmission of infection is spread from infected camel population to susceptible individual population, which specially effected the owner, shepherd and cherisher individuals and further they spread infection in human community. In the article we proceeded as, after the introduction and related literature in the first, we calculated the basic key value, that is, reproductive number R0, by the using of next generation approach. Then we derived all the endemic equilibrium points of the concern model. Further in presence of reproductive number we shown the stability analysis, that is, local stability analysis and global equilibria were stable. While for global stability analysis we developed the technique of Lyapunov function and discussed its stability. Finally we obtained numerical solution of mathematical model by the use of Runge-Kutta method of order 4four tool and presented the results from Figure 1 to 5 with and without
There is no conflict of interest regarding this paper.
All authors equally contributed this paper.
All authors read and approved the final version.