Reduced Graphene Oxide as an Excellent Temperature Sensor
In this study we demonstrated an efficient way to fabricate a reduced graphene oxide (rGO) temperature sensor and studied its sensing properties. The sensor device was fabricated by drop casting of the GO solution directly onto platinum inter-digital electrodes (Pt-IDE) and then reduced to rGO by low-temperature annealing and hydrazine vapor treatment. X-Ray diffraction and Raman spectroscopy were used to characterize the structural properties of the device. The temperature sensing properties of rGO were measured from 100-400 K and found that the resistance decreases exponentially with increasing temperature. The conductance of rGO sensor was following exactly the behavior of a standard temperature controller. The high sensitivity, stability and repeatability of the rGO sensor observed, are favorable for its temperature sensing applications.
Keywords: Graphene Oxide; Temperature Sensing Applications
Portable, reliable, low-cost, low-power temperature sensors play an important role in many current and future temperature measurement applications, including those in the industry, agriculture and environmental fields [1,2]. So far, many efforts have been made to develop high performance temperature sensors using carbon-based materials including nanotubes, but all have their own advantages and specific working conditions [3,4]. Graphene-based complexes received significant attention for various applications ranging from optoelectronic to energy storage to memory devices [5-7]. Recently, graphene oxide (GO) based compounds have aroused tremendous interest for various sensing applications, mainly due to their large specific surface area for molecular adsorption and outstanding electrical properties, such as low noise level and high carrier mobility [8,9]. Yet, the application of GO based electronic sensors is still in its infancy, but their promising performances are remarkable [10-12]. However, the electrical insulating nature of conventional GO due to the presence of various functional groups makes it unfit to use as a conductance-based sensor, whereas reduced graphene oxide (rGO) restores the conductivity by removal of these functional groups and makes it suitable for these type of sensing applications. Being atomically thin and having a high surface-to-volume ratio, its surface can absorb gas molecules very efficiently. Although there are many reports on the gas sensing properties of GO, its temperature sensing properties have not been explored much. A recent report has shown the infrared photodetector and wearable temperature sensor in the temperature range of 35-45 °C utilizing reduced graphene oxide and graphene flakes [13]. Another study shows the utilization of cellulose/rGO based composite films as a temperature sensor in the temperature range of 25-80 °C [14]. Also, there is report highlighting the use of CVD grown graphene monolayer as thermistor by utilizing the polarization charge from ferroelectric polymer beneath [15]. Although at present there are number of conventional and commercial devices for temperature sensing, but rGO based temperature sensor described in this study has the advantage of low cost, facile, sensitive and have wide working temperature range. Furthermore, the rGO based temperature sensor were fabricated by simple drop cast method on inter-digital electrodes (IDE). As, IDE’s are pervasive devices in modem electronics made up of two individually addressable inter-digitated comb-like electrode structures. These are one of the most popular transducers, widely employed in various technological and analytical applications, especially in the field of sensors due to their low cost, and excellent sensitivity. In the present study, we have fabricated reduced graphene oxide based temperature sensor using inter-digital electrodes (IDE’s) by a facile method of drop casting and the sensor performed very well in a wide temperature range of 100-400K.
Graphene oxide (GO) synthesis was performed using a modified Hummers method as described in our earlier study [16]. The sensor device was fabricated by drop casting of the GO solution directly on the platinum interdigital electrodes (Pt-IDE). After drying it was kept at 400 °C for 5 minutes followed by hydrazine vapor. The resistance of the GO before annealing was a few mega-ohms and decreased to several ohms after reduction due to the removal of oxygen functional groups, which decreases the distance between carbon atoms and facilitates charge transport via variable range hopping. Since the resistance of rGO sheets was found to be > 200 Ohms, we have employed a two-probe method to study the sensor characteristics. The structural characterization was carried out using XRD and Raman. The morphological characterization was carried out using FESEM. The temperature sensing properties of rGO were measured using MMR temperature controller and Keithley 2401.
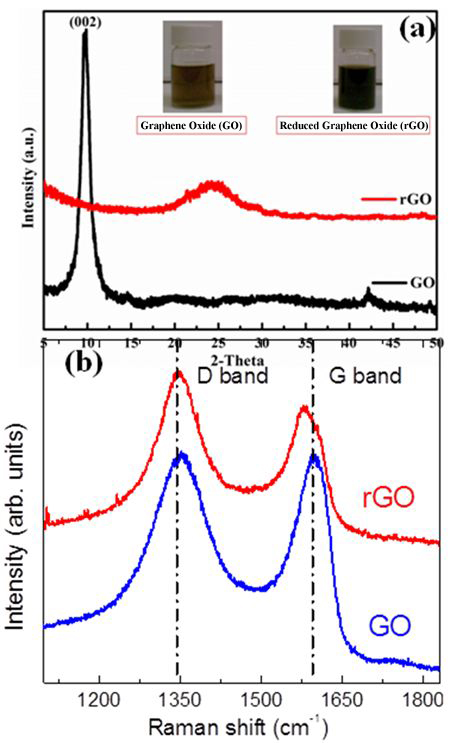
Figure 1a shows the XRD patterns of GO and rGO samples. The as-synthesized GO sample shows a major diffraction peak (002) at 10.2°, which is due to the introduction of oxygen functional groups on the graphite sheets as well as water molecules held in the interlayer galleries of hydrophilic GO [17]. For rGO, an obvious shift in the (002) peak was observed, which can be ascribed to the reduction of GO and the disordered stacking of rGO due to the removal of oxygen functional groups and water molecules. Inset shows the photograph of graphene oxide (brown) and reduced graphene oxide (black) solutions.
Figure 1b compares the Raman spectra of GO and rGO samples and both shows two distinct peaks at 1350 and 1580 cm-1, which are the so-called D and G Raman bands, respectively. The peak height of D and G bands are almost same in GO. However, the D band intensity is larger than that of G band in rGO, and this is due to the formation of large number of defects during the reduction process and consistent with the earlier reports [18].
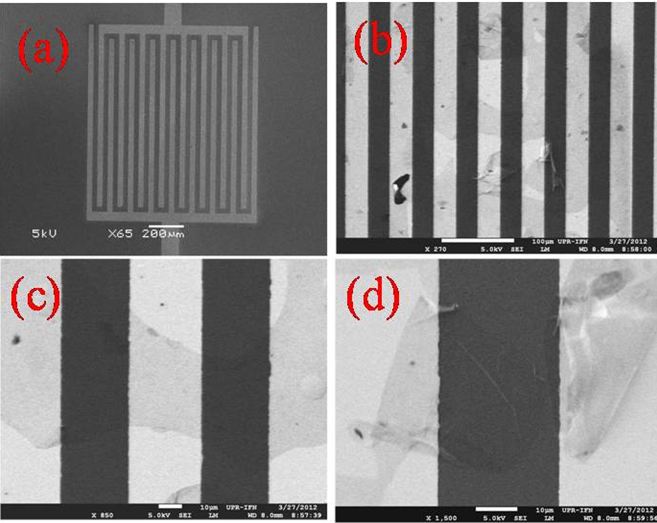
Figure 2a shows the FESEM image of the Pt-IDE on which a few layers of GO was deposited. Each of the Pt-IDE electrodes is 1000x20 μm length/width. The spacing between the consecutive electrode fingers is about 20 μm. FESEM images in Figure 2b,Figure 2c and Figure 2d show that the rGO film is transparent and consist of few layers.
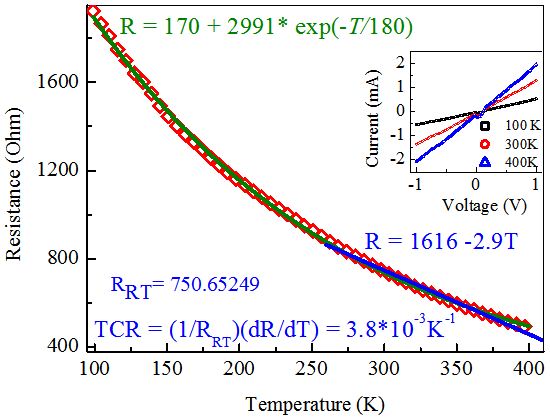
To determine the temperature sensing properties of rGO sensor, we have measured the resistance as a function of temperature in the range from 100-400 K. Voltage was fixed at 1 V and the resistance was calculated using the Ohm’s law (R = V/I), as shown in Figure 3. The resistance (R) of the rGO sensor decreases exponentially with increasing temperature, which is similar to that of a standard thermistor temperature sensor and is also recently reported in multiwall carbon nanotubes [19]. Inset of Figure 3 shows the linear I-V characteristics over the voltage range of -1 V to +1 V at different temperatures, which indicates the ohmic nature of rGO. Although linear I-V curve do not always imply ohmic conduction (e.g. schottky barriers with small mean free paths). However, a non-linear I-V curve can be obtained if GO is not reduced enough [20]. The R-T curve was found to be well fitted with the single exponential equation R = 170 + 2991e-T/180. This curve is almost linear above 240 K, and hence the temperature coefficient of resistance (TCR) was estimated by using a linear fit to the R-T curve in the region from 240 K to 400 K. For TCR, the most significant parameter for thermistor is estimated using the relation
TCR = (1/R)×(dR/dT) (1)
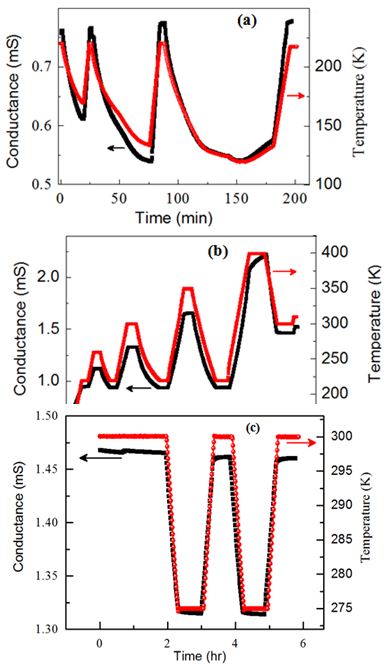
Where R is the resistance of the sample, and dR/dT is the slope. From this linear fit, dR/dT is found to be -2.9 Ohm/K, and hence the TCR is – 3.8×10⁻³ K-1. Interestingly, this TCR value is very close to that reported for single layer graphene resistor (= -1.47×10⁻³ K-1), but slightly smaller than the TCR value of a bilayer graphene resistor [21]. Although we don’t have direct evidence of number of graphene layers in our device, this result suggests that single and bi-layers of graphene might be distributed non-uniformly on the Pt-IDE. A study on negative TCR in graphene was predicted earlier by Cheianov and Falkoo which states that the negative TCR is associated to the presence of structural defects and structural disorder etc [21]. However, unlike pure graphene, the negative TCR in our rGO sensor may be intrinsic in origin as it has many activated sites present after chemical and subsequent thermal treatment. It is known that the epoxy and hydroxyl groups can be removed from the surface of GO under thermal treatment and leave behind structural defects in graphene. This can be confirmed from the Raman spectra of rGO (Figure 1b), where the intensity of the defect related D peak is larger compared to the G peak intensity. This experiment was performed several times and over long periods of times to ensure repeatability of the result. The sensitivity of the sensor is calculated by taking the first derivative of the R-T curve and is shown in Figure 3. It shows that while the sensitivity increases very slowly and linearly with lowering temperature, it increases rapidly below 150 K. Hence, fast response of the sensor can be achieved below 150 K. An ideal temperature sensor should have stable R(T), repeatability, fast response, high sensitivity, etc. To ensure the repeatability of our sensor, we have cooled and warmed the sample several times for different temperatures and compare our results with the MMR temperature controller in (Figure 4a and Figure 4b). It was found that the conductance of the rGO sensor followed the behavior of MMR K-20 controller in the complete temperature range. During measurements we intentionally increased/decreased the temperature of MMR controller and found that our sensor followed exactly the same way. To check the stability of our sensor, we maintain the temperature of sensor for a long time at 275 K and 300 K and cool and warm the sensor in this temperature range shown in Figure 4c. It was found that our sensor follows exactly same behavior as that of a standard temperature controller.
In summary, the temperature sensing properties of rGO based sensor have been studied. Resistance of the rGO sensor increased exponentially with lowering temperature, which is similar to that of a standard thermistor. The linearity in resistance as a function of temperature was found and the TCR was 3.8 x10⁻³ Ohm/K. The conductance of rGO sensor follows exactly the behavior of a standard temperature controller. The sensing properties were found to be excellent for cooling and warming cycles at different temperatures, establishing it as a potential candidate for temperature sensing applications.
The research was supported by the DOD Grant AFOSR-FA9550-16-1-0295.